418969 style essentials 1 agenda 6 piece powerpoint presentation diagram infographic slide
Display fortitude with our Six Staged Flower Pot Diagram Business Process Flat Powerpoint Design. They encourage a fearless disposition.
Display fortitude with our Six Staged Flower Pot Diagram Business Process Flat Powerpoint Design. They encourage a fearless..
- Google Slides is a new FREE Presentation software from Google.
- All our content is 100% compatible with Google Slides.
- Just download our designs, and upload them to Google Slides and they will work automatically.
- Amaze your audience with SlideTeam and Google Slides.
-
Want Changes to This PPT Slide? Check out our Presentation Design Services
- WideScreen Aspect ratio is becoming a very popular format. When you download this product, the downloaded ZIP will contain this product in both standard and widescreen format.
-

- Some older products that we have may only be in standard format, but they can easily be converted to widescreen.
- To do this, please open the SlideTeam product in Powerpoint, and go to
- Design ( On the top bar) -> Page Setup -> and select "On-screen Show (16:9)” in the drop down for "Slides Sized for".
- The slide or theme will change to widescreen, and all graphics will adjust automatically. You can similarly convert our content to any other desired screen aspect ratio.
Compatible With Google Slides

Get This In WideScreen
You must be logged in to download this presentation.
PowerPoint presentation slides
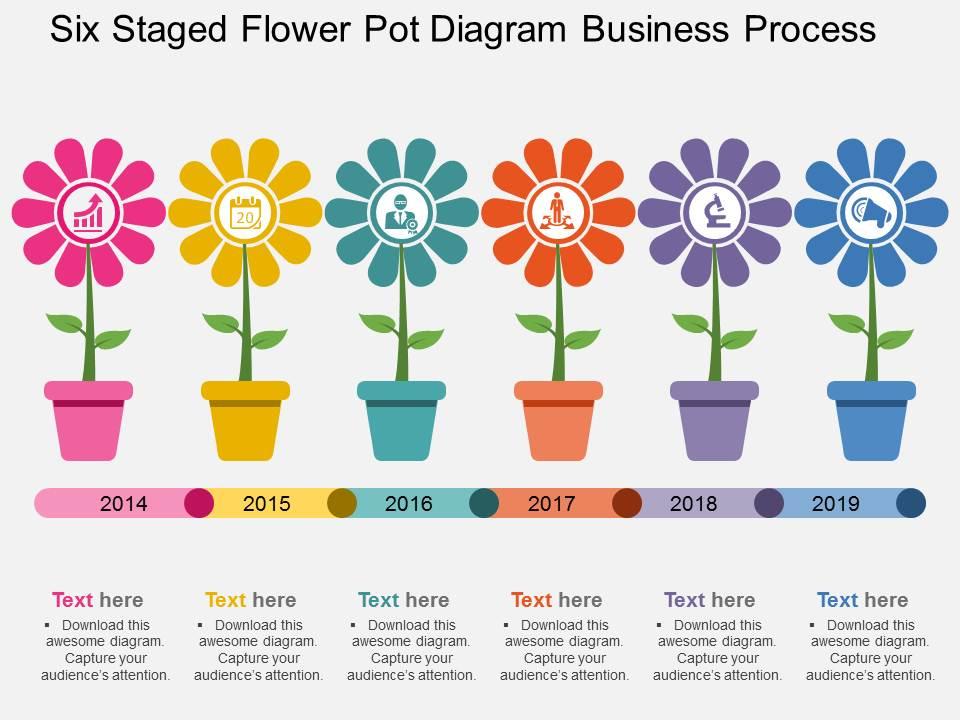
We are proud to present our six staged flower pot diagram business process flat powerpoint design. Six staged flower pot diagram has been used to design this power point template diagram. This PPT diagram contains the concept of business process flow representation. Use this PPT diagram for business and marketing related presentations.
Content of this Powerpoint Presentation
Description:
The image displays a PowerPoint slide titled "Six Staged Flower Pot Diagram Business Process." The slide contains a creative infographic representing a timeline from 2014 to 2019, where each year is denoted by a colorful flower in a pot, and each flower has a different symbol in its center, signifying various stages or milestones in a business process. The symbols include a graph, a calendar, a lightbulb, a weighing scale, a pound currency symbol, and a clock, suggesting themes of growth, planning, innovation, evaluation, financial performance, and time management.
1. Years 2014 to 2019: Indicate specific time periods in a business timeline.
2. Symbols in flowers: Represent key business concepts or metrics for each year.
3. Text placeholders: Provide space for detailed descriptions of activities or achievements for each corresponding year.
Use Cases:
This infographic can be adapted for use across various industries, including:
1. Marketing:
Use: Visualizing annual marketing campaign milestones.
Presenter: Marketing Director.
Audience: Marketing team, stakeholders.
2. Education:
Use: Showing yearly educational program developments.
Presenter: Curriculum Coordinator.
Audience: Educators, administrative staff.
3. Finance:
Use: Outlining financial growth and budgeting over the years.
Presenter: CFO.
Audience: Investors, finance department.
4. Healthcare:
Use: Tracking yearly health initiatives or program outcomes.
Presenter: Healthcare Administrator.
Audience: Medical staff, board members.
5. Real Estate:
Use: Demonstrating annual sales trends and property development.
Presenter: Real Estate Manager.
Audience: Sales agents, investors.
6. Technology:
Use: Highlighting technological advancements or product releases by year.
Presenter: Chief Innovation Officer.
Audience: R&D team, investors.
7. Non-Profit:
Use: Reporting on annual milestones in fundraising and project implementation.
Presenter: Director of Development.
Audience: Donors, volunteers, board members.
418969 style essentials 1 agenda 6 piece powerpoint presentation diagram infographic slide with all 4 slides:
Under pressure to meet that next deadline? Agile Six Staged Flower Pot Diagram Business Process Flat Powerpoint Design design can have you ready in seconds.
-
Understandable and informative presentation.
-
Out of the box and creative design.


