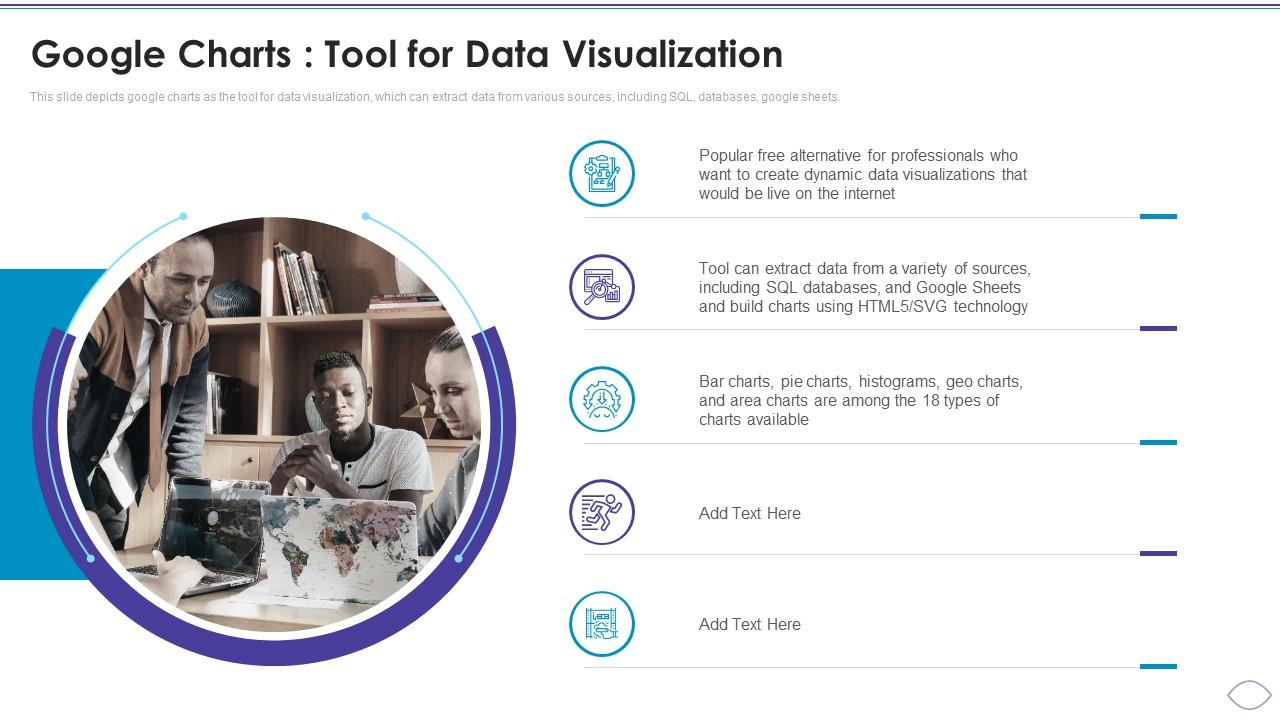
Visualization Research Branches Google Charts Tool For Data Visualization
This slide depicts google charts as the tool for data visualization, which can extract data from various sources, including SQL, databases, google sheets.
- Google Slides is a new FREE Presentation software from Google.
- All our content is 100% compatible with Google Slides.
- Just download our designs, and upload them to Google Slides and they will work automatically.
- Amaze your audience with SlideTeam and Google Slides.
-
Want Changes to This PPT Slide? Check out our Presentation Design Services
- WideScreen Aspect ratio is becoming a very popular format. When you download this product, the downloaded ZIP will contain this product in both standard and widescreen format.
-

- Some older products that we have may only be in standard format, but they can easily be converted to widescreen.
- To do this, please open the SlideTeam product in Powerpoint, and go to
- Design ( On the top bar) -> Page Setup -> and select "On-screen Show (16:9)” in the drop down for "Slides Sized for".
- The slide or theme will change to widescreen, and all graphics will adjust automatically. You can similarly convert our content to any other desired screen aspect ratio.
Compatible With Google Slides

Get This In WideScreen
You must be logged in to download this presentation.
PowerPoint presentation slides
This slide depicts google charts as the tool for data visualization, which can extract data from various sources, including SQL, databases, google sheets. Increase audience engagement and knowledge by dispensing information using Visualization Research Branches Google Charts Tool For Data Visualization. This template helps you present information on five stages. You can also present information on Popular Free Alternative, Dynamic Data Visualizations, Technology using this PPT design. This layout is completely editable so personaize it now to meet your audiences expectations.
Visualization Research Branches Google Charts Tool For Data Visualization with all 6 slides:
Use our Visualization Research Branches Google Charts Tool For Data Visualization to effectively help you save your valuable time. They are readymade to fit into any presentation structure.
-
My presentations were a bit amateur before I found SlideTeam’s designs. I’ve been able to find slides for nearly every topic I’ve had to present. Thanks, Slideteam!
-
The best part about SlideTeam is their meticulously prepared presentations (complete-decks and single-slides both), infused with high-quality graphics and easy to edit. All-in-all worthy products.


