All Business Slides Cost Reduction Strategies Powerpoint Diagram Slide
-
 79212323 style essentials 2 financials 4 piece powerpoint presentation diagram infographic slide
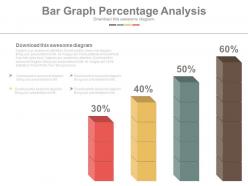
Presenting four staged bar graph percentage analysis powerpoint slides. This Power Point template diagram has been crafted with graphic of four staged bar graph and percentage diagram. This PPT diagram contains the concept of business result analysis. Use this PPT diagram for business and finance related presentations.
-
 72672770 style essentials 2 financials 4 piece powerpoint presentation diagram infographic slide
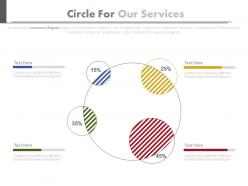
Presenting four staged circle for our services powerpoint slides. This Power Point template diagram has been crafted with graphic of four staged circle diagram. This PPT diagram contains the concept of business services representation. Use this PPT diagram for business and finance related presentations.
-
 96875047 style essentials 2 financials 4 piece powerpoint presentation diagram infographic slide
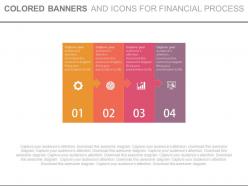
Presenting four colored banners and icons for financial process powerpoint slides. This Power Point template diagram slide has been crafted with graphic of four colored banners and icons diagram. This PPT diagram contains the concept of financial process flow representation. Use this PPT diagram for business and marketing related presentations.
-
 68321825 style essentials 2 financials 7 piece powerpoint presentation diagram infographic slide
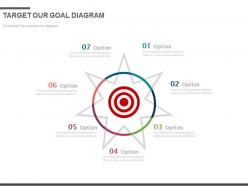
Presenting seven staged target our goal diagram powerpoint slides. This Power Point template diagram slide has been crafted with graphic of seven staged our goal diagram. This PPT diagram contains the concept of business goal achievement. Use this PPT diagram for business and finance related presentations.
-
 11789514 style essentials 2 financials 6 piece powerpoint presentation diagram infographic slide
Presenting six staged cubes and icons diagram powerpoint slides. This Power Point template diagram slide has been crafted with graphic of six staged cubes and icons diagram. This PPT diagram contains the concept of business data representation. Use this PPT diagram for business and finance related presentations.
-
 64710172 style essentials 2 financials 3 piece powerpoint presentation diagram infographic slide
Presenting three circles with business icons infographics powerpoint slides. This Power Point template diagram slide has been crafted with graphic of three circles and icons diagram. This PPT diagram contains the concept of business information representation. Use this PPT diagram for business and finance related presentations.
-
 45692377 style essentials 1 roadmap 6 piece powerpoint presentation diagram infographic slide
Presenting six staged year based timeline for business target powerpoint slides. This power point template diagram has been crafted with graphic of six staged year based timeline diagram. This PPT icon slide contains the concept of business target analysis representation. Use this PPT diagram for business and finance related presentations.
-
 8060557 style essentials 1 roadmap 5 piece powerpoint presentation diagram infographic slide
Presenting year based tags timeline for success powerpoint slides. This power point template diagram has been crafted with graphic of year based tags timeline diagram. This PPT icon slide contains the concept of business success representation. Use this PPT diagram for business and finance related presentations.
-
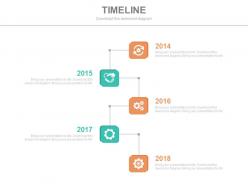 79883237 style essentials 1 roadmap 5 piece powerpoint presentation diagram infographic slide
Completely editable PowerPoint slide for vertical timeline for business process control. Professional use of colors, icons and design. Presentation design can be displayed in standard and widescreen view. PPT template is fully editable to allow customization. Simple to download and convert into PDF format. Compatible with number of software options. Personalize the presentation with individual company name and logo. Excellence in picture quality. Beneficial for investors, shareholders, financiers, professors, students, marketers, sales people, etc.
-
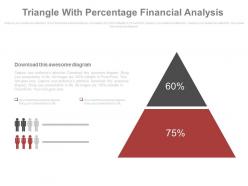 43015259 style essentials 2 financials 2 piece powerpoint presentation diagram infographic slide
Presenting triangle with percentage financial analysis powerpoint slides. This Power Point template diagram with graphic of triangle and percentage diagram. This PPT diagram contains the concept of financial analysis. Use this PPT diagram for business and finance related presentations.
-
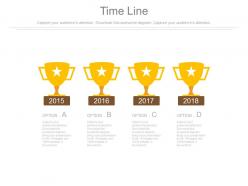 14434817 style essentials 1 roadmap 4 piece powerpoint presentation diagram infographic slide
Quick and simple to download at your convenience. Fully modifiable text as per your requirement. Original resolution of images and diagrams unchanged post editing. Totally editable colors, contrast, orientation and sizes of PPT icons. Insert your own company logo, tagline, trademark, brand name etc. to personalize. Fits seamlessly anywhere between your slides.
-
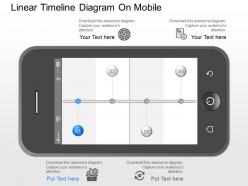 48881407 style essentials 1 roadmap 4 piece powerpoint presentation diagram infographic slide
Plentiful color choices, briskness and effects. Delete or add the slide as and when required. Smooth animations, transitions and movement of objects across the slide. PPT slide can turn out to be very useful for business growth, marketing figures. Improvement, focus on acquisition and mergers in long run. Works well in Windows 7, 8, 10, XP, Vista and Citrix.
-
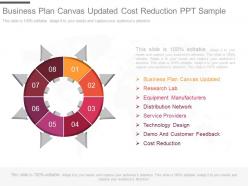 51882815 style circular hub-spoke 8 piece powerpoint presentation diagram infographic slide
Presenting business plan canvas updated cost reduction ppt sample. This is a business plan canvas updated cost reduction ppt sample. This is a eight stage process. The stages in this process are business plan canvas updated, research lab, equipment manufacturers, distribution network, service providers, technology design, demo and customer feedback, cost reduction.
-
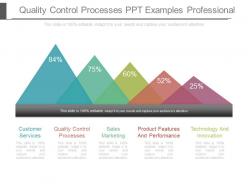 23361619 style essentials 2 financials 5 piece powerpoint presentation diagram infographic slide
Presenting quality control processes ppt examples professional. This is a quality control processes ppt examples professional. This is a five stage process. The stages in this process are customer services, quality control processes, sales marketing, product features and performance, technology and innovation.
-
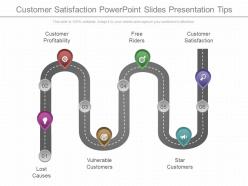 49545434 style circular zig-zag 6 piece powerpoint presentation diagram infographic slide
Presenting customer satisfaction powerpoint slides presentation tips. This is a customer satisfaction powerpoint slides presentation tips. This is a six stage process. The stages in this process are customer profitability, free riders, customer satisfaction, lost causes, vulnerable customers, star customers.
-
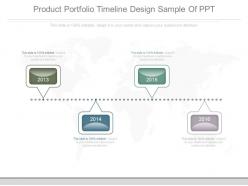 68465032 style essentials 1 roadmap 4 piece powerpoint presentation diagram infographic slide
Presenting product portfolio timeline design sample of ppt. This is a product portfolio timeline design sample of ppt. This is a four stage process. The stages in this process are years, planning, roadmap, business, management.
-
 59923983 style essentials 2 financials 5 piece powerpoint presentation diagram infographic slide
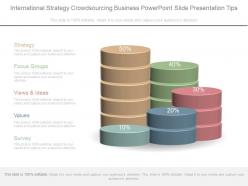
Presenting international strategy crowd sourcing business powerpoint slide presentation tips. This is a international strategy crowd sourcing business powerpoint slide presentation tips. This is a five stage process. The stages in this process are strategy, focus groups, views and ideas, values, survey.
-
 43763681 style essentials 2 compare 2 piece powerpoint presentation diagram infographic slide
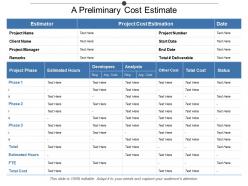
Presenting this set of slides with name - A Preliminary Cost Estimate. This is a two stage process. The stages in this process are Cost Estimate, Price Estimate, Value Estimate.
-
 30583524 style essentials 1 roadmap 5 piece powerpoint presentation diagram infographic slide
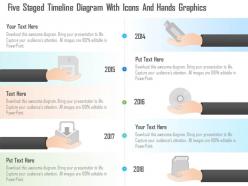
We are proud to present our 0115 five staged timeline diagram with icons and hands graphics powerpoint template. Five staged timeline diagram with hand icons has been used to develop this power point template. This diagram template depicts the concept of business data representation. Use this PPT for your business and sales related presentations.
-
 38405391 style essentials 2 financials 2 piece powerpoint presentation diagram infographic slide
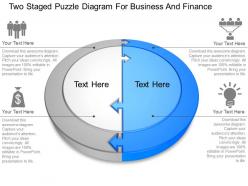
We are proud to present our two staged puzzle diagram for business and finance powerpoint template slide. Graphic of two staged puzzle diagram has been used to design this power point template diagram. This PPT diagram contains the concept of business and finance problem solving. Use this PPT diagram for business and finance presentations.
-
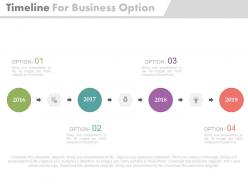 36081650 style essentials 1 roadmap 4 piece powerpoint presentation diagram infographic slide
Presenting four staged linear timeline for business options powerpoint slides. This Power Point template slide has been crafted with graphic of four staged linear timeline with years icons. This PPT slide contains the concept of business options representation. Use this PPT slide for business and finance related presentations.
-
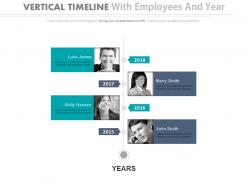 48803823 style essentials 1 roadmap 4 piece powerpoint presentation diagram infographic slide
No preoccupation of pixels when opened on extra large screen. Permitted gathering or ungrouping of the articles. Access to alter the shading, style, topics and the introduction of the slide symbols. Neighborly with the Google slides and major PowerPoint variants. Inconvenience free addition of trademark in the slides. Advantageous for the advertising experts, entrepreneurs and the Professional moderators.
-
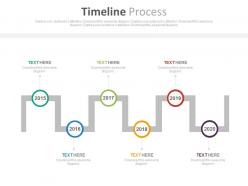 82191037 style essentials 1 roadmap 6 piece powerpoint presentation diagram infographic slide
Presenting sequential timeline with years for target management powerpoint slides. This Power Point template slide has been crafted with graphic of sequential timeline with years icons. This PPT slide contains the concept of business target management representation. Use this PPT slide for business and finance related presentations.
-
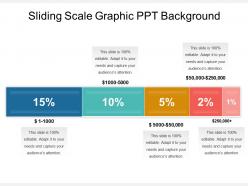 69869792 style linear single 5 piece powerpoint presentation diagram infographic slide
Presenting sliding scale graphic ppt background. This is a sliding scale graphic ppt background. This is a five stage process. The stages in this process are sliding scale, sliding bar.
-
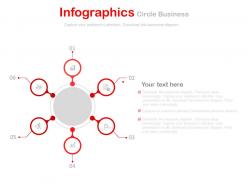 10094375 style essentials 2 financials 6 piece powerpoint presentation diagram infographic slide
Presenting six staged infographics and icons powerpoint slides. This Power Point template diagram has been crafted with graphic of six staged info graphics and icons diagram. This PPT diagram contains the concept of business data and info representation. Use this PPT diagram for business and finance related presentations.
-
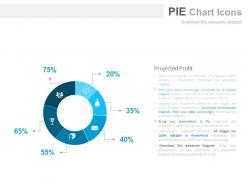 46368273 style essentials 2 financials 6 piece powerpoint presentation diagram infographic slide
Presenting six staged pie chart with icons for business data powerpoint slides. This Power Point template diagram has been crafted with graphic of six staged pie chart and percentage diagram. This PPT diagram contains the concept of business data analysis. Use this PPT diagram for business and finance related presentations.
-
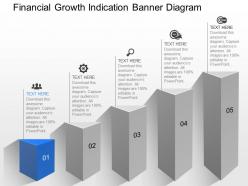 70584861 style concepts 1 growth 5 piece powerpoint presentation diagram infographic slide
Presenting a financial growth indication banner diagram powerpoint template. This Power Point template diagram has been crafted with graphic of banner diagram. This PPT diagram contains the concept of financial growth indication. Use this PPT diagram for finance and marketing related presentations.
-
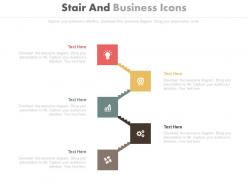 14700440 style essentials 2 financials 5 piece powerpoint presentation diagram infographic slide
Presenting five staged stair and business icons diagram powerpoint slides. This Power Point template diagram slide has been crafted with graphic of five staged stair and icons diagram. This PPT diagram contains the concept of business success representation. Use this PPT diagram for business and marketing related presentations.
-
 73095262 style essentials 1 roadmap 4 piece powerpoint presentation diagram infographic slide
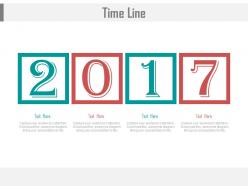
Presenting timeline for year 2017 for business powerpoint slides. This power point template diagram has been crafted with graphic of timeline for year 2017 diagram. This PPT icon slide contains the concept of business success parameters representation. Use this PPT diagram for business and finance related presentations.
-
 76879137 style essentials 1 roadmap 5 piece powerpoint presentation diagram infographic slide
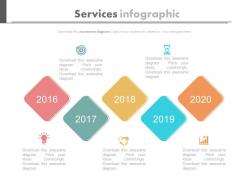
Presentation layout is beneficial to service providers, managers, project in charge, financial sector and businessmen to regulate operations. Color, style and position can be standardized, supports font size which can be read from a distance. PPT slide is compatible with Microsoft 2010 and 2013 versions. Text and graphics can be placed on the slide. PPT diagram 100% compatible with Google slide.
-
 70546864 style essentials 2 financials 5 piece powerpoint presentation diagram infographic slide
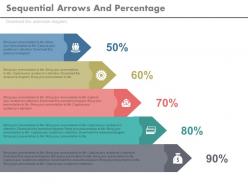
Presenting five staged sequential arrows and percentage powerpoint slides. This Power Point template slide has been crafted with graphic of five staged arrow and percentage chart. This PPT slide contains the concept of financial growth analysis. Use this PPT slide for business and finance related presentations.
-
 58124536 style essentials 2 financials 4 piece powerpoint presentation diagram template slide
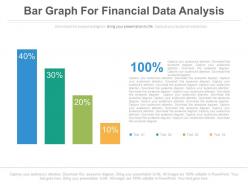
Presenting bar graph for financial data analysis powerpoint slides. This Power Point template diagram with graphic of bar graph and finance icons. This PPT diagram contains the concept of financial data analysis. Use this PPT diagram for business and finance related presentations.
-
 22513487 style essentials 2 financials 3 piece powerpoint presentation diagram infographic slide
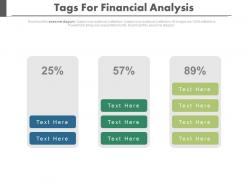
Presenting three staged tags for financial analysis diagram powerpoint slides. This Power Point template diagram with graphic of three staged tags diagram. This PPT diagram contains the concept of financial analysis. Use this PPT diagram for business and finance related presentations.
-
 25028285 style essentials 2 dashboard 3 piece powerpoint presentation diagram infographic slide
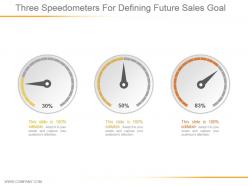
Presenting three speedometers for defining future sales goal ppt slide examples. This is a three speedometers for defining future sales goal ppt slide examples. This is a three stage process. The stages in this process are business, marketing, planning, presentation, technology.
-
 13048043 style essentials 1 roadmap 1 piece powerpoint presentation diagram infographic slide
Presenting mj graphic of sign board diagram powerpoint template. This Power Point template diagram has been crafted with graphic of sign board diagram. This PPT diagram contains the concept of information representation. Use this PPT diagram for business and marketing related presentations.
-
 87098378 style essentials 1 roadmap 5 piece powerpoint presentation diagram infographic slide
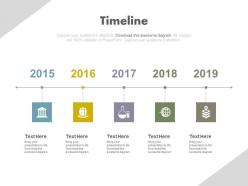
Presenting five staged timeline year based analysis powerpoint slides. This Power Point template slide has been designed with graphic of five staged timeline and year diagram. This PPT diagram contains the concept of timeline formation representation .Use this PPT slide for business and finance related presentations.
-
 50584393 style essentials 1 roadmap 7 piece powerpoint presentation diagram infographic slide
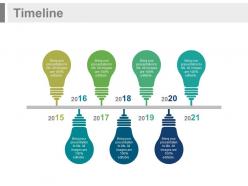
Presenting linear timeline with bulb design and years powerpoint slides. This Power Point template slide has been designed with graphic of linear timeline and bulb diagram. This PPT diagram contains the concept of idea generation and success milestones representation .Use this PPT slide for business and marketing related presentations.
-
 96390352 style essentials 1 roadmap 6 piece powerpoint presentation diagram infographic slide
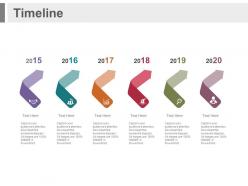
Presenting six staged arrows year based timeline powerpoint slides. This Power Point template slide has been designed with graphic of six staged arrow and year based timeline diagrams. This PPT diagram contains the concept of year based business success analysis .Use this PPT slide for business and marketing related topics.
-
 68794496 style essentials 2 financials 3 piece powerpoint presentation diagram infographic slide
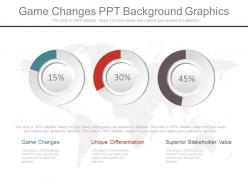
Presenting game changes ppt background graphics. This is a game changes ppt background graphics. This is a three stage process. The stages in this process are game changes, unique differentiation, superior stakeholder value.
-
 4255337 style essentials 2 compare 2 piece powerpoint presentation diagram infographic slide
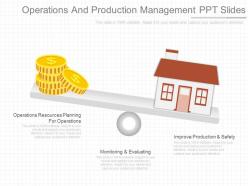
Presenting operations and production management ppt slides. This is a operations and production management ppt slides. This is a two stage process. The stages in this process are operations resources planning for operations, monitoring and evaluating, improve production and safety.
-
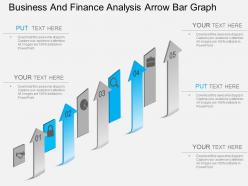 28746018 style concepts 1 growth 5 piece powerpoint presentation diagram infographic slide
Utilization of cutting edge determination of pictures and the symbols in the slides. Permit altering of the size, style and introduction of the slide symbols. Inconvenience free inclusion of the organization's name or watermark. If guidelines to alter and change the slide symbol outline. Flexible with multiple format options like JPEG, JPG or PDF. Accessible an assortment of symbols to download and supplant in the slides. Valuable for the expert moderators and the business chiefs, financiers, businessmen, entrepreneurs, investors, and funding companies.
-
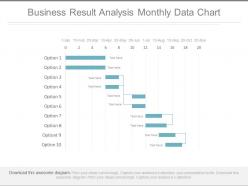 33188912 style essentials 2 financials 10 piece powerpoint presentation diagram infographic slide
Presenting business result analysis monthly data chart powerpoint slides. This is a business result analysis monthly data chart powerpoint slides. This is a ten stage process. The stages in this process are financials.
-
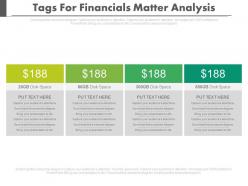 6161812 style essentials 2 financials 4 piece powerpoint presentation diagram infographic slide
Presenting four tags for financial matter analysis powerpoint slides. This is a four tags for financial matter analysis powerpoint slides. This is a four stage process. The stages in this process are financials.
-
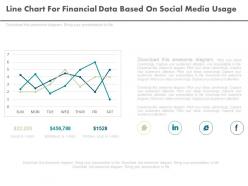 7512246 style essentials 2 financials 3 piece powerpoint presentation diagram infographic slide
Presenting line chart for financial data based on social media usage powerpoint slides. This is a line chart for financial data based on social media usage powerpoint slides. This is a three stage process. The stages in this process are financials.
-
 11188495 style essentials 1 roadmap 5 piece powerpoint presentation diagram infographic slide
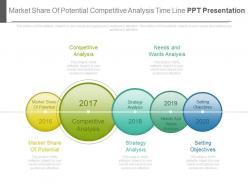
Presenting market share of potential competitive analysis timeline ppt presentation. This is a market share of potential competitive analysis timeline ppt presentation. This is a five stage process. The stages in this process are timeline.
-
 30562062 style essentials 2 financials 5 piece powerpoint presentation diagram template slide
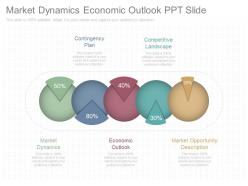
Presenting market dynamics economic outlook ppt slide. This is a market dynamics economic outlook ppt slide. This is a five stage process. The stages in this process are contingency plan, competitive landscape, market opportunity description, economic outlook, market dynamics.
-
 24566023 style circular zig-zag 5 piece powerpoint presentation diagram infographic slide
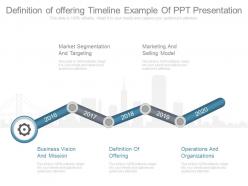
Presenting definition of offering timeline example of ppt presentation. This is a definition of offering timeline example of ppt presentation. This is a five stage process. The stages in this process are market segmentation and targeting, marketing and selling model, operations and organizations, definition of offering, business vision and mission.
-
 31303079 style essentials 1 roadmap 5 piece powerpoint presentation diagram infographic slide
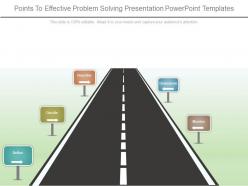
Presenting points to effective problem solving presentation powerpoint templates. This is a points to effective problem solving presentation powerpoint templates. This is a five stage process. The stages in this process are define, decide, describe, monitor, brainstorm.
-
 71576720 style essentials 1 roadmap 5 piece powerpoint presentation diagram infographic slide
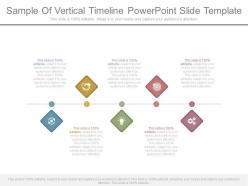
Presenting sample of vertical timeline powerpoint slide template. This is a sample of vertical timeline powerpoint slide template. This is a five stage process. The stages in this process are business, planning, development, marketing, timeline, icon.
-
 81453596 style essentials 2 financials 4 piece powerpoint presentation diagram infographic slide
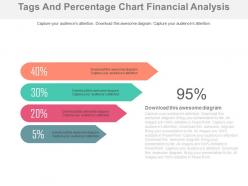
Presenting four tags and percentage chart financial analysis powerpoint slides. This Power Point template diagram slide has been crafted with graphic of four tags and percentage chart diagram. This PPT diagram contains the concept of financial analysis. Use this PPT diagram for business and finance related presentations.
-
 70911293 style essentials 2 financials 4 piece powerpoint presentation diagram infographic slide
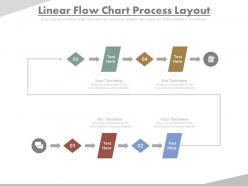
Presenting linear flow chart process layout powerpoint slides. This Power Point template diagram slide has been crafted with graphic of linear flow chart diagram. This PPT diagram contains the concept of business process layout representation. Use this PPT diagram for business and finance related presentations.
-
 6433190 style essentials 2 financials 12 piece powerpoint presentation diagram infographic slide
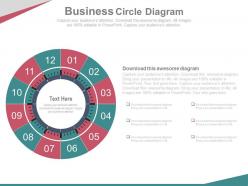
Presenting twelve staged business circle diagram powerpoint slides. This Power Point template diagram slide has been crafted with graphic of twelve staged circle diagram. This PPT diagram contains the concept of business process flow representation. Use this PPT diagram for business and finance related presentations.
-
 24311071 style essentials 1 roadmap 5 piece powerpoint presentation diagram infographic slide
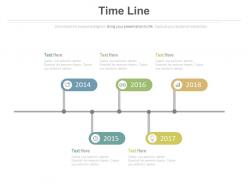
Presenting five staged sequential timeline for sales powerpoint slides. This Power Point icon template slide has been crafted with graphic of five staged sequential timeline icons. This icon template slide contains the concept of finance target analysis and timeline formation. Use this icon template slide can be used for business and finance related presentations.
-
 3828689 style essentials 1 roadmap 4 piece powerpoint presentation diagram infographic slide
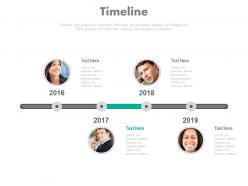
Presenting linear timeline with business peoples and years powerpoint slides. This Power Point icon template slide has been crafted with graphic of linear timeline and business people?s diagram. This icon template slide contains the concept of timeline formation for employee management .Use this icon template slide can be used for business and finance related presentations.
-
 99296258 style essentials 1 roadmap 2 piece powerpoint presentation diagram infographic slide
Professionally designed Presentation design. Fully compatible PPT slides with Google slides. Presentable PowerPoint design in standard 4:3 and widescreen 16:9 view. Flexible option to modify the presentation template as per the industry requirement. Fast download saves valuable time. Slide can be converted into JPG and PDF format. Benefitted for small and large scale businesses.
-
 90045632 style essentials 2 financials 8 piece powerpoint presentation diagram infographic slide
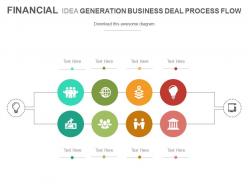
Presenting financial idea generation business deal process flow powerpoint slides. This Power Point template slide has been crafted with graphic of finance info graphics. This PPT slide contains the concept of financial idea generation and business deal analysis. Use this PPT slide for business and finance related presentations.
-
 19901804 style essentials 2 financials 4 piece powerpoint presentation diagram infographic slide
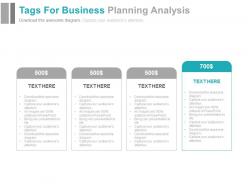
Presenting four tags for business planning analysis powerpoint slides. This Power Point template slide has been crafted with graphic of four tags. This PPT slide contains the concept of business planning analysis. Use this PPT slide for business and finance related presentations.
-
 38520667 style essentials 2 financials 4 piece powerpoint presentation diagram infographic slide
Presenting saving piggy mobile dollars financial planning powerpoint slides. This Power Point template slide has been crafted with graphic of piggy bank, dollars and mobile icons. This PPT slide contains the concept of financial planning. Use this PPT slide for business and finance related presentations.
-
 29543811 style essentials 1 roadmap 6 piece powerpoint presentation diagram infographic slide
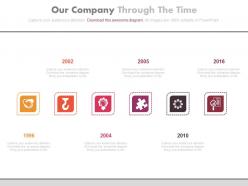
Swift and simple to download. Absolutely editable icons and PPT infographics-remove or keep to your liking. Original resolution of PPT images and diagrams undiminished post editing. Absolutely editable text to suit the context of your presentation. Totally editable colors, contrast, orientation and sizes of PPT icons. Insert your own company logo, tagline, trademark etc.
-
 44352811 style essentials 2 financials 5 piece powerpoint presentation diagram infographic slide
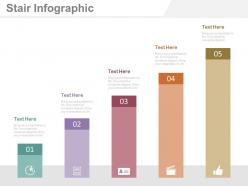
Presenting five staged bar graph for financial management analysis powerpoint slides. This Power Point template diagram with graphic of five staged bar graph and icons. This PPT diagram contains the concept of financial management analysis. Use this PPT diagram for business and finance related presentations.


