All Diagrams Finance Powerpoint Diagram Slide
-
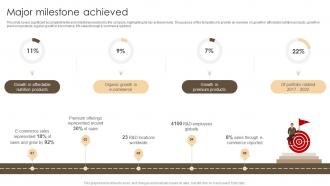 Major Milestone Achieved Nestle Investor Funding Elevator Pitch Deck
This slide covers significant accomplishments and milestones reached by the company, highlighting its key achievements. The purpose of this template is to provide an overview on growth in affordable nutrition products, growth in premium products, organic growth in ecommerce, 8percent sales through e-commerce reported. Present the topic in a bit more detail with this Major Milestone Achieved Nestle Investor Funding Elevator Pitch Deck Use it as a tool for discussion and navigation on Nutrition Products, Organic Growth, Premium Products This template is free to edit as deemed fit for your organization. Therefore download it now.
-
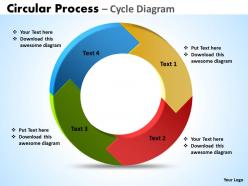 Circular process cycle diagram 4 stages powerpoint slides templates
Use this Recycle based PowerPoint Diagram to elaborate four interconnected issues which performs their actions in cycle. This diagram provides an overview of the interactions of different factors in a company. This can be used for presentations on arrow, art, bright, calendar, chart, circle, circular, clip, clipart, collection, daily, graph, graphic, illustration, isolated, menu, process etc.
-
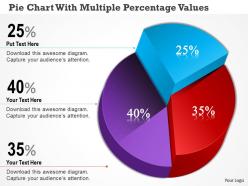 87170413 style division pie 3 piece powerpoint presentation diagram infographic slide
Straightforward download in quick and easy steps. Fully editable text as per your need and no limits on title or subtitle length. PPT infographics with absolutely modifiable size and orientation. Converts seamlessly into PDF or JPG format and runs with any software. Insert your company name, trademark, logo, tagline etc.
-
 84087482 style concepts 1 leadership 1 piece powerpoint presentation diagram infographic slide
We are proud to present our global women leadership for business and success powerpoint template. Concept of global women leadership with success can be explained in any presentation with this professional PPT diagram. This PPT diagram contains the graphic of world map and women icons. Use this PPT diagram for women empowerment and social communication related presentations.
-
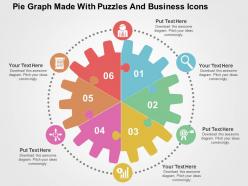 7090689 style circular loop 6 piece powerpoint presentation diagram infographic slide
Superior resolution pictures and the slide symbols. Access to alter and redo according to your business prerequisite. Permit its clients to open on a wide screen show without trading off with the nature of the symbols. Procedure agreeable slide designs. Perfect to be utilized with the Google Slides. Simple to download and spare in the organization you like. It is valuable for the advertising experts, business directors and the business system fashioners.
-
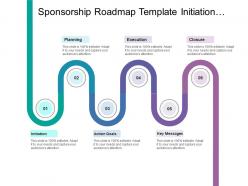 79408939 style circular zig-zag 6 piece powerpoint presentation diagram infographic slide
Presenting this set of slides with name - Sponsorship Roadmap Template Initiation Action Goals Key Messages. This is a six stage process. The stages in this process are Sponsorship Roadmap Template, Sponsorship Timeline Template, Sponsorship Linear Process Template.
-
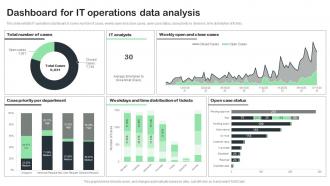 Dashboard For IT Operations Data Analysis
This slide exhibits IT operations dashboard. It covers number of cases, weekly open and close cases, open case status, case priority by divisions, time distribution of tickets. Introducing our Dashboard For IT Operations Data Analysis set of slides. The topics discussed in these slides are Case Priority, Distribution Of Tickets, Open Case Status. This is an immediately available PowerPoint presentation that can be conveniently customized. Download it and convince your audience.
-
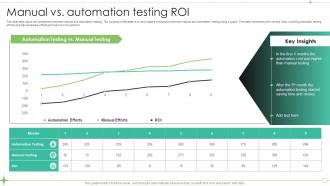 Manual Vs Automation Testing ROI
This slide talks about the comparison between manual and automation testing. The purpose of this slide is to showcase a comparison between manual and automation testing using a graph. The table represents nine months data, including automatic testing efforts and manual testing efforts and returns on investment. Presenting our well structured Manual Vs Automation Testing ROI. The topics discussed in this slide are Automation Testing, Manual Testing, ROI. This is an instantly available PowerPoint presentation that can be edited conveniently. Download it right away and captivate your audience.
-
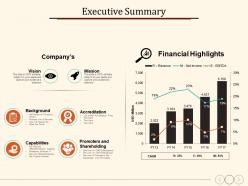 50461109 style essentials 2 financials 4 piece powerpoint presentation diagram infographic slide
Presenting this set of slides with name - Executive Summary Background Accreditation Capabilities Vision Mission. This is a four stage process. The stages in this process are Background, Accreditation, Capabilities, Vision, Mission.
-
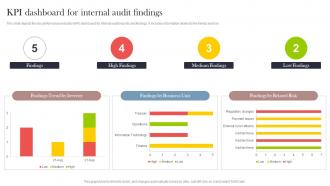 KPI Dashboard For Internal Audit Findings
This slide depicts the key performance indicator KPI dashboard for internal audit reports and findings. It includes information related to the trends and risk. Introducing our KPI Dashboard For Internal Audit Findings set of slides. The topics discussed in these slides are Findings, High Findings, Medium Findings, Low Findings. This is an immediately available PowerPoint presentation that can be conveniently customized. Download it and convince your audience.
-
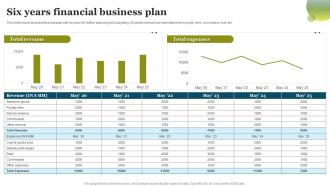 Six Years Financial Business Plan
This slide shows business financial plan with six years for further planning and budgeting. It include revenue and expenditure from royalty fees, commission, rent, etc. Introducing our Six Years Financial Business Plan set of slides. The topics discussed in these slides are Total Revenue, Financial Business, Plan. This is an immediately available PowerPoint presentation that can be conveniently customized. Download it and convince your audience.
-
 0514 to do list powerpoint presentation
Straightforward download and effortlessly adaptable into JPEG and PDF. PowerPoint slide crafted with high quality images and designs. Presentation design can be easily modified i.e. colour and font. Alternate to share the PPT template in standard and widescreen view. Design can be obtain with different nodes and stages. Adjustable presentation visual as companionable with Google slides. Helpful for business managers, industry professionals, project supervisors, scholars etc.
-
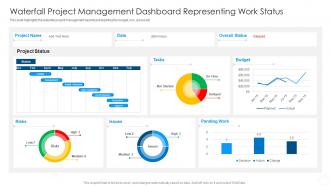 Waterfall Project Management Dashboard Representing Work Status
This slide highlights the waterfall project management dashboard depicting the budget, risk, issues etc. Introducing our Waterfall Project Management Dashboard Representing Work Status set of slides. The topics discussed in these slides are Waterfall Project Management Dashboard Representing Work Status. This is an immediately available PowerPoint presentation that can be conveniently customized. Download it and convince your audience.
-
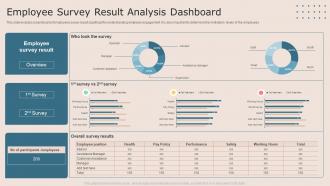 Employee Survey Result Analysis Dashboard
This slide includes a dashboard of employees survey result significant for understanding employee engagement. It is also important to determine the motivation levels of the employees. Presenting our well structured Employee Survey Result Analysis Dashboard. The topics discussed in this slide are Employee Survey, Result Analysis, Dashboard. This is an instantly available PowerPoint presentation that can be edited conveniently. Download it right away and captivate your audience.
-
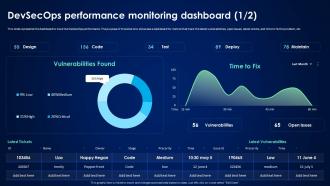 Devsecops Best Practices For Secure Devsecops Performance Monitoring Dashboard
This slide represents the dashboard to track the DevSecOps performance. The purpose of this slide is to showcase a dashboard for metrics that track the latest vulnerabilities, open issues, latest tickets, and time to fix the problem, etc. Deliver an outstanding presentation on the topic using this Devsecops Best Practices For Secure Devsecops Performance Monitoring Dashboard. Dispense information and present a thorough explanation of Devsecops Performance, Monitoring Dashboard, Track The Latest Vulnerabilities using the slides given. This template can be altered and personalized to fit your needs. It is also available for immediate download. So grab it now.
-
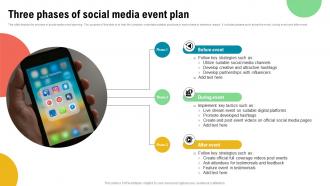 Three Phases Of Social Media Event Plan
This slide highlights the tactics to create successful social media event plans. The purpose of this slide is to help develop successful digital strategies for events through the use of strategies such as creation of attractive social media pages, utilization of countdown stickers on social media stories, etc. Presenting our set of slides with Three Phases Of Social Media Event Plan. This exhibits information on three stages of the process. This is an easy to edit and innovatively designed PowerPoint template. So download immediately and highlight information on Develop Partnerships With Influencers, Suitable Digital Platforms, Promote Developed Hashtags.
-
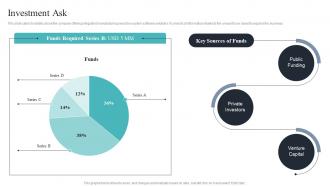 Investment Ask Digital Solutions Company Investor Funding Elevator Pitch Deck
This slide caters to details about the company offering integrated manufacturing execution system software solutions. It consists of information related to the amount to be raised to expand the business. Present the topic in a bit more detail with this Investment Ask Digital Solutions Company Investor Funding Elevator Pitch Deck Use it as a tool for discussion and navigation on Private Investors, Venture Capital, Public Funding This template is free to edit as deemed fit for your organization. Therefore download it now.
-
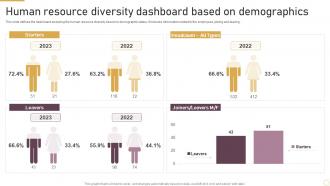 Human Resource Diversity Dashboard Based On Demographics
This slide defines the dashboard analyzing the human resource diversity based on demographic status. It includes information related to the employees joining and leaving. Introducing our Human Resource Diversity Dashboard Based On Demographics set of slides. The topics discussed in these slides are Human Resource, Diversity Dashboard, Based On Demographics. This is an immediately available PowerPoint presentation that can be conveniently customized. Download it and convince your audience.
-
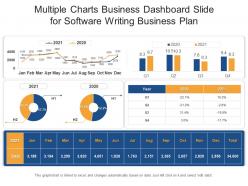 Multiple charts business dashboard slide for software writing business plan powerpoint template
If you are looking for a perfect template to display metrics and insights, then this template titled Multiple Charts Business Dashboard Slide For Software Writing Business Plan Powerpoint Template is the best choice. Deploy this PowerPoint presentation slide to evaluate the status of a campaign or identify different trends that affect the working culture of your organization. It offers a well-structured layout with many graphical representations to display real-time information. Our PPT slide can also be used as a measurement and comparison tool to weigh in different prospects in achieving your end goal. Additionally, this is a very useful set to share with higher authorities to help them make informed decisions based on analytical data and insights. The biggest advantage of this PowerPoint layout is that it has built-in features and graphics that make it easy to modify. Therefore, grab it now
-
 Statistics Of Existing Workplace Diversity Multicultural Diversity Development Ppt Brochure
This slide illustrates the statistics of existing workplace diversity in terms gender representation overall and department wise, ethnicity in leadership roles, promotion rate etc. Present the topic in a bit more detail with this Statistics Of Existing Workplace Diversity Multicultural Diversity Development Ppt Brochure. Use it as a tool for discussion and navigation on Gender Representation, Department Wise, Promotion Rate. This template is free to edit as deemed fit for your organization. Therefore download it now.
-
 3d currency symbols powerpoint presentation slides
Communicate emphatically with your audience to convey your Business Finance message with maximum effect with our 3D Currency symbols Powerpoint visuals and graphics. Our 3D Currency Power Powerpoint slides, templates and diagrams are ideal for you to visually support your ideas in your Global Business, Finance, Security, Purchasing, Earnings, Budget and Stock Prices PPT presentations, Global Business Ideas, Solutions, Marketing Targets, Productivity and Growth Sales and profit PPT slideshows, Global Business Franchise, Strategy, Mergers, Takeover and Integration Powerpoint presentations, Business Operational process, Performance Improvement, Automations and Cost Reduction PPT slideshows, and all financial transactions in your Architecture, Computer, Medical, Manufacturing, Industrial, Technology, Music, Digital Multimedia, Construction, Real Estate, Internet, Transportation and Tourism Industry Powerpoint presentations.
-
 Competitive analysis chart with bubbles
Presenting this set of slides with name Competitive Analysis Chart With Bubbles. The topics discussed in these slides are Sales, Month, Competitor, Price Millions. This is a completely editable PowerPoint presentation and is available for immediate download. Download now and impress your audience.
-
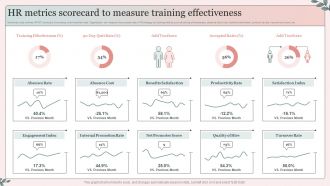 HR Metrics Scorecard To Measure Training Effectiveness
Mentioned slide outlines HR KPI scorecard showcasing most important kpis. Organization can measure the success rate of HR strategy by tracking metrics such as training effectiveness, absence rate and cost, benefits satisfaction, productivity rate, net promotor score, etc. Presenting our well-structured HR Metrics Scorecard To Measure Training Effectiveness. The topics discussed in this slide are HR Metrics, Scorecard, Measure, Training Effectiveness. This is an instantly available PowerPoint presentation that can be edited conveniently. Download it right away and captivate your audience.
-
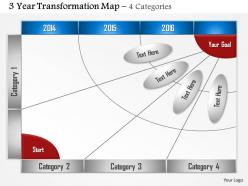 0514 4 category 3 year transformation map
Easily editable presentation layout as color, text and font are editable. Proficiently shaped PowerPoint diagram. PowerPoint designs are totally compatible with Google slides. Effortlessly download and changeable into JPEG and PDF document. Choice of insertion of corporate symbol and image for personalization. Presentable and easy to comprehend info graphic format. PPT slide can be presented in both standard and widescreen view. Suitable for financiers, investors, entrepreneurs, finance managers, economist, executives etc.
-
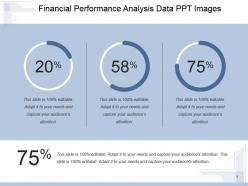 22583326 style essentials 2 financials 3 piece powerpoint presentation diagram infographic slide
Presenting financial performance analysis data ppt images. This is a financial performance analysis data ppt images. This is a three stage process. The stages in this process are business, success, strategy, finance, management, analysis.
-
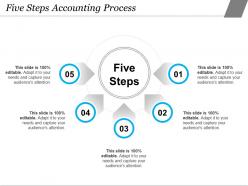 9550007 style circular semi 5 piece powerpoint presentation diagram infographic slide
Presenting this set of slides with name - Five Steps Accounting Process. This is a five stage process. The stages in this process are Accounting Process, Accounting Cycle, Accounting Management.
-
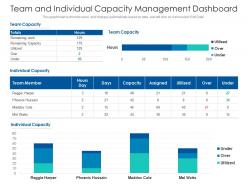 Team and individual capacity management dashboard
This graph or chart is linked to excel, and changes automatically based on data. Just left click on it and select Edit Data. Introducing our Team And Individual Capacity Management Dashboard set of slides. The topics discussed in these slides are Team Capacity, Team Member, Individual Capacity. This is an immediately available PowerPoint presentation that can be conveniently customized. Download it and convince your audience.
-
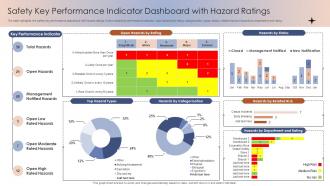 Safety Key Performance Indicator Dashboard With Hazard Ratings
The slide highlights the safety key performance dashboard snapshot with hazard ratings. It showcases key performance indicator, open hazards by rating, categorization, types, status, related risk and hazards by department and rating Introducing our Safety Key Performance Indicator Dashboard With Hazard Ratings set of slides. The topics discussed in these slides are Safety, Key Performance Indicator, Dashboard, Hazard Ratings. This is an immediately available PowerPoint presentation that can be conveniently customized. Download it and convince your audience.
-
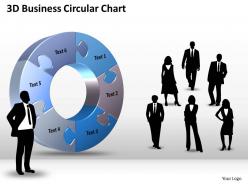 3d business circular chart powerpoint templates ppt presentation slides 0812
It is all there in bits and pieces. Individual components well researched and understood in their place. Now you need to get it all together to form the complete picture and reach the goal. You have the ideas and plans on how to go about it. Use this template to illustrate your method, piece by piece, and interlock the whole process in the minds of your audience.
-
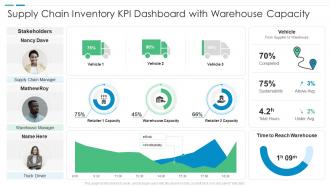 Supply chain inventory kpi dashboard with warehouse capacity
Introducing our Supply Chain Inventory KPI Dashboard With Warehouse Capacity set of slides. The topics discussed in these slides are Supply Chain Inventory KPI Dashboard With Warehouse Capacity. This is an immediately available PowerPoint presentation that can be conveniently customized. Download it and convince your audience.
-
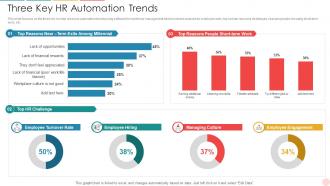 Three Key HR Automation Trends
This slide focuses on the three key human resource automation trends using software for workforce management which includes reasons for employee exits, top human resource challenges, reasons people choosing short-term work, etc. Introducing our Three Key HR Automation Trends set of slides. The topics discussed in these slides are Employee Turnover Rate, Employee Hiring, Managing Culture, Employee Engagement. This is an immediately available PowerPoint presentation that can be conveniently customized. Download it and convince your audience.
-
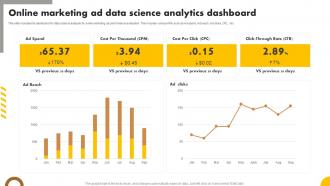 Online Marketing Ad Data Science Analytics Dashboard
This slide includes the dashboard for data science analysis for online marketing ad performance evaluation. This includes various KPIs such as Ad spend, Ad reach, Ad clicks, CPC, etc. Introducing our Online Marketing Ad Data Science Analytics Dashboard set of slides. The topics discussed in these slides are Marketing, Data, Analytics. This is an immediately available PowerPoint presentation that can be conveniently customized. Download it and convince your audience.
-
 32568914 style division donut 3 piece powerpoint presentation diagram infographic slide
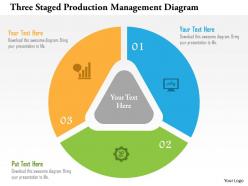
Runs extremely smooth and jitter-free on related software. PowerPoint images are of high resolution. Projection on widescreen doesn’t let PPT graphics to be pixelated. Fluent download of PPT slides. Further customize slide by inserting your company’s logo, trademark. Add titles and sub titles at will with no space constraints. Compatible with Google slides. Useful for startups, businesses and project management.
-
 92027336 style essentials 1 agenda 7 piece powerpoint presentation diagram infographic slide
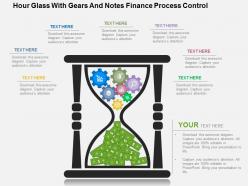
Spectacular presentation of designs and colors. Excellent quality pictures which do not pixelate when projected on wide screen. Compatibility with multiple format options like JPEG and JPG. Harmonious with numerous online and offline software options. 100 percent editable. Ease of swipe out and/or inclusion of content as per individual choice. Freedom to personalize the presentation with company name, logo and or trademark. Used by marketing professionals, financiers, strategists, students and educators.
-
 Manufacturing Audit Team Inspection Dashboard
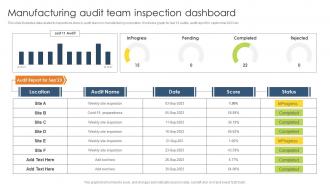
This slide illustrates data related to inspections done by audit teams in manufacturing corporation. It includes graph for last 10 audits, audit report for september 2023 etc. Introducing our Manufacturing Audit Team Inspection Dashboard set of slides. The topics discussed in these slides are Manufacturing, Audit Team Inspection, Dashboard. This is an immediately available PowerPoint presentation that can be conveniently customized. Download it and convince your audience.
-
 Marketing Project Campaigns Weekly Status Report
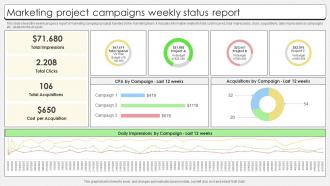
This slide shows the weekly progress report of marketing campaign projects handled by the marketing team. It includes information related to total cost incurred, total impressions, clicks, acquisitions, daily impressions by campaigns etc. related to the projects. Introducing our Marketing Project Campaigns Weekly Status Report set of slides. The topics discussed in these slides are Marketing Project, Campaigns Weekly, Status Report. This is an immediately available PowerPoint presentation that can be conveniently customized. Download it and convince your audience.
-
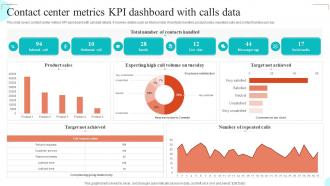 Contact Center Metrics KPI Dashboard With Calls Data
This slide covers contact center metrics KPI dashboard with call data details. It involves details such as total number of contacts handled, product sales, repeated calls and contact handles per day. Presenting our well structured Contact Center Metrics KPI Dashboard With Calls Data The topics discussed in this slide are Product Sales, Target Not Achieved, Contacts Handled This is an instantly available PowerPoint presentation that can be edited conveniently. Download it right away and captivate your audience.
-
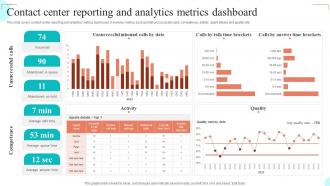 Contact Center Reporting And Analytics Metrics Dashboard
This slide covers contact center reporting and analytics metrics dashboard. It involves metrics such as total unsuccessful calls, competence, activity, agent details and quality rate. Introducing our Contact Center Reporting And Analytics Metrics Dashboard set of slides. The topics discussed in these slides are Unsuccessful Inbound, Talk Time Brackets, Answer Time Brackets This is an immediately available PowerPoint presentation that can be conveniently customized. Download it and convince your audience.
-
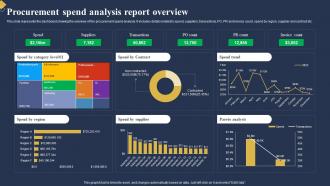 Procurement Spend Analysis Report Overview
This slide represents the dashboard showing the overview of the procurement spend analysis. It includes details related to spend, suppliers, transactions, PO, PR and invoice count, spend by region, supplier and contract etc. Introducing our Procurement Spend Analysis Report Overview set of slides. The topics discussed in these slides are Spend By Region, Spend By Supplier, Pareto Analysis. This is an immediately available PowerPoint presentation that can be conveniently customized. Download it and convince your audience.
-
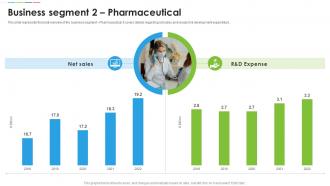 Bayer Company Profile Business Segment 2 Pharmaceutical Ppt Slides CP SS
This slide represents financial overview of the business segment Pharmaceutical. It covers details regarding net sales and research and development expenditure. Deliver an outstanding presentation on the topic using this Bayer Company Profile Business Segment 2 Pharmaceutical Ppt Slides CP SS. Dispense information and present a thorough explanation of Net Sales, Expense using the slides given. This template can be altered and personalized to fit your needs. It is also available for immediate download. So grab it now.
-
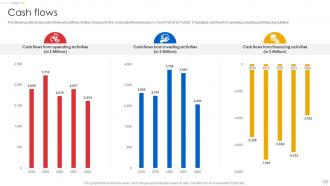 Ebay Company Profile Cash Flows Ppt Rules CP SS
The following slide shows cash inflows and outflows of eBay company for five consecutive financial years i.e. from FY2018 to FY2022. It highlights cash flow from operating, investing and financing activities. Present the topic in a bit more detail with this Ebay Company Profile Cash Flows Ppt Rules CP SS. Use it as a tool for discussion and navigation on Cash Flows. This template is free to edit as deemed fit for your organization. Therefore download it now.
-
 Business idea powerpoint presentation slides
These high quality, editable pre-designed powerpoint slides have been carefully created by our professional team to help you impress your audience. Each graphic in every slide is vector based and is 100% editable in powerpoint. Each and every property of any slide - color, size, shading etc can be modified to build an effective powerpoint presentation. Use these slides to convey complex business concepts in a simplified manner. Any text can be entered at any point in the powerpoint slide. Simply DOWNLOAD, TYPE and PRESENT!
-
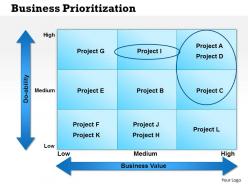 0514 business prioritization powerpoint presentation
Simple and fast download in easy steps. Change orientation and size of PPT images as per need. Insert your trademark, brand name, tagline, logo etc. for personalization. Fully editable text- add titles and subtitles of any word length. Easily convertible to JPG or PDF and runs easily with any other software too.
-
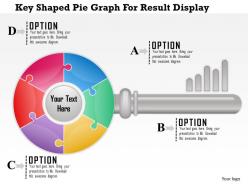 33400816 style puzzles circular 4 piece powerpoint presentation diagram infographic slide
We are proud to present our 1114 key shaped pie graph for result display powerpoint template. Key shaped pie graph has been used to decorate this power point template slide. This PPT slide contains the concept of result analysis. This result analysis can be used for business and finance processes. Use this PPT slide and build exclusive presentation for your viewers.
-
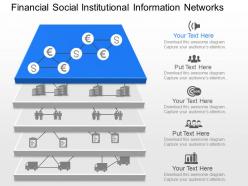 73649027 style technology 1 networking 5 piece powerpoint presentation diagram infographic slide
Presenting ik financial social institutional information network powerpoint template. This Power Point template diagram has been crafted with graphic of network diagram. This PPT diagram contains the concept of financial and social information representation. Use this PPT diagram for business and finance related presentations.
-
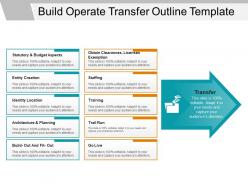 45396507 style layered vertical 10 piece powerpoint presentation diagram infographic slide
Presenting Build Operate Transfer Outline Template which is completely editable. Open and save your presentation in various formats like PDF, JPG, and PNG. Freely access this slide in both 4:3 and 16:9 aspect ratio. You can modify the font, color, font size, and font types of the slides as per your needs. This template is adaptable with Google Slides which makes it easily accessible at once.
-
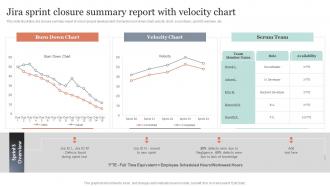 Jira Sprint Closure Summary Report With Velocity Chart
This slide illustrates Jira closure summary report of scrum project development. It includes burn down chart, velocity chart, scrum team, sprint S overview, etc. Presenting our well structured Jira Sprint Closure Summary Report With Velocity Chart. The topics discussed in this slide are Burn Down Chart, Velocity Chart, Scrum Team. This is an instantly available PowerPoint presentation that can be edited conveniently. Download it right away and captivate your audience.
-
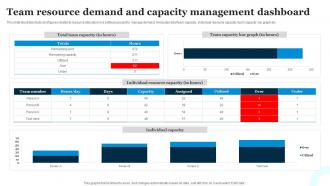 Team Resource Demand And Capacity Management Dashboard
This slide illustrates facts and figures related to resource allocation in a software project to manage demand. It includes total team capacity, individual resource capacity, team capacity bar graph etc. Presenting our well structured Team Resource Demand And Capacity Management Dashboard. The topics discussed in this slide are Team Resource, Capacity Management Dashboard, Individual Capacity. This is an instantly available PowerPoint presentation that can be edited conveniently. Download it right away and captivate your audience.
-
 13866112 style essentials 2 financials 4 piece powerpoint presentation diagram infographic slide
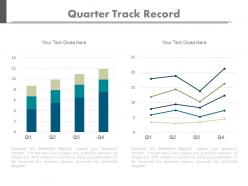
Editable PPT Slide for viewing quarterly track record line chart. Compatible with numerous format options like JPEG, JPG or PDF. Access to inclusion and exclusion of contents as per specific needs of any business. Provides a professional outlook to your PowerPoint presentation. Beneficial for business professionals, students, teachers, business analysts and strategists. Customization of each PowerPoint graphic and text according to your desire and want. Available in Widescreen slide size also. Freedom to customize it with company name and logo.
-
 87971878 style layered vertical 4 piece powerpoint presentation diagram infographic slide
Presenting this set of slides with name - Bank Icons Powerpoint Slide Background Designs. This is a four stage process. The stages in this process are Bank Icon, Finance Icons, Money Icon.
-
 Various digital marketing trends shown by charts
Presenting this set of slides with name Various Digital Marketing Trends Shown By Charts. The topics discussed in these slides are Multi Channel Analytics, Content Marketing, Email Marketing, Social Media Marketing, Campaign Marketing. This is a completely editable PowerPoint presentation and is available for immediate download. Download now and impress your audience.
-
 Project financial management dashboard with revenue and expenses
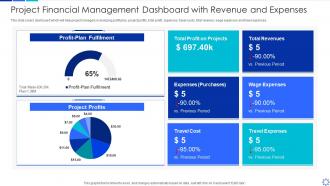
Introducing our Project Financial Management Dashboard With Revenue And Expenses set of slides. The topics discussed in these slides are Project Financial Management Dashboard With Revenue And Expenses. This is an immediately available PowerPoint presentation that can be conveniently customized. Download it and convince your audience.
-
 Process To Formulate Focus Cost Leadership Strategy Offer Low Priced Products Niche Market
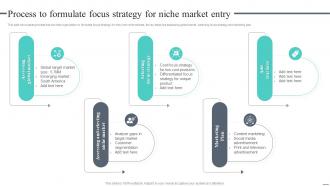
This slide showcases process that can help organization to formulate focus strategy for entry into niche markets. Its key steps are assessing global market, selecting focus strategy and marketing plan.Introducing Process To Formulate Focus Cost Leadership Strategy Offer Low Priced Products Niche Market to increase your presentation threshold. Encompassed with five stages, this template is a great option to educate and entice your audience. Dispence information on Target Market, Emerging Market, Differentiated Focus, using this template. Grab it now to reap its full benefits.
-
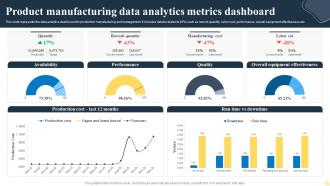 Product Manufacturing Data Analytics Metrics Dashboard
This slide represents the data analytics dashboard for production manufacturing and management. It includes details related to KPIs such as rework quantity, labor cost, performance, overall equipment effectiveness etc. Introducing our Product Manufacturing Data Analytics Metrics Dashboard set of slides. The topics discussed in these slides are Availability, Performance, Overall Equipment Effectiveness. This is an immediately available PowerPoint presentation that can be conveniently customized. Download it and convince your audience.
-
 Web style performance scorecard powerpoint slides presentation diagrams templates
We are proud to present our web style performance scorecard powerpoint slides presentation diagrams templates. This diagram slideshows performance scorecard in a web style format. It is a graphical representation of the progress over time of some entity toward some specified goal or goals. You have it all down to a T. Now put it up there for all to see.
-
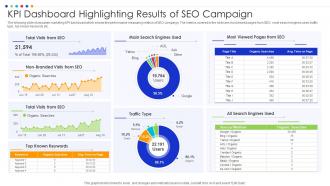 KPI Dashboard Highlighting Results Of SEO Campaign
The following slide showcases marketing KPI dashboard which shows the performance measuring metrics of SEO campaign. The metrics covered in the slide are most viewed pages from SEO, most search engines used, traffic type, top known keywords etc. Presenting our well structured KPI Dashboard Highlighting Results Of SEO Campaign. The topics discussed in this slide are Total Visits From SEO, Main Search Engines Used, Traffic Type, Most Viewed Pages From SEO. This is an instantly available PowerPoint presentation that can be edited conveniently. Download it right away and captivate your audience.
-
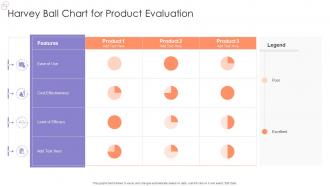 Harvey Ball Chart For Product Evaluation
Introducing our Harvey Ball Chart For Product Evaluation set of slides. The topics discussed in these slides are Level Of Efficacy, Cost Effectiveness, Features. This is an immediately available PowerPoint presentation that can be conveniently customized. Download it and convince your audience.
-
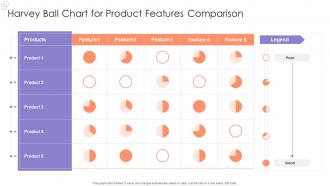 Harvey Ball Chart For Product Features Comparison
Presenting our well-structured Harvey Ball Chart For Product Features Comparison. The topics discussed in this slide are Harvey Ball Chart, Product Features Comparison. This is an instantly available PowerPoint presentation that can be edited conveniently. Download it right away and captivate your audience.
-
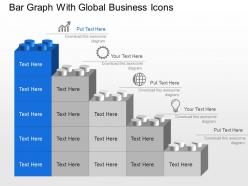 68560503 style concepts 1 growth 5 piece powerpoint presentation diagram infographic slide
Extraordinary and unique PPT presentation slides. Result and action oriented patterns. High-quality bold graphics to impress the viewers. Creates transparency of the motive and objective of the presentation. Runs smoothly with all the software’s. Can be easily converted to JPG and PDF format. Extremely flexible and reliable templates. Allows complete modification by any user at any point of time.
-
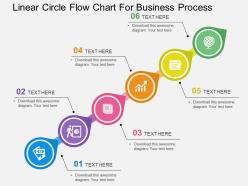 80835443 style essentials 1 agenda 6 piece powerpoint presentation diagram infographic slide
We are proud to present our linear circle flow chart for business process flat powerpoint design. Graphic of linear circle flow chart has been used to craft this power point template diagram. This PPT diagram contains the concept of business process indication .Use this PPT diagram for business and finance related presentations.


