Investor personality profile powerpoint presentation slides
Pitching your business idea to the prospective shareholder is tough. However, our investor personality profile PowerPoint presentation is a perfect deal for you. This ready-made and well researched investor’s profile PowerPoint presentation includes topics like company stockholder update, business model canvas, annual run rate, revenue model, investment deals, production costs, investment scorecard, competitive analysis, market dynamics, market budget, value chain, operating excellence, financial highlights, performance dashboards, investment timelines, organic growth etc. Using our investor outline PPT presentation templates, investment bankers can illustrate who all are the potential stockholders for the company to senior management. These investor summary overview PPT templates can be used for related subjects like investor’s classification, stakeholder in production, ideal stockholder profile, stakeholder’s personality etc. Our investor personality profile presentation slides includes such topics that will keep the audience engaged until the end. Download these slides and impress your stakeholders. Build an excellent foundation with our Investor Personality Profile Powerpoint Presentation Slides. They help build a concrete base.
Pitching your business idea to the prospective shareholder is tough. However, our investor personality profile PowerPoint p..
- Google Slides is a new FREE Presentation software from Google.
- All our content is 100% compatible with Google Slides.
- Just download our designs, and upload them to Google Slides and they will work automatically.
- Amaze your audience with SlideTeam and Google Slides.
-
Want Changes to This PPT Slide? Check out our Presentation Design Services
- WideScreen Aspect ratio is becoming a very popular format. When you download this product, the downloaded ZIP will contain this product in both standard and widescreen format.
-

- Some older products that we have may only be in standard format, but they can easily be converted to widescreen.
- To do this, please open the SlideTeam product in Powerpoint, and go to
- Design ( On the top bar) -> Page Setup -> and select "On-screen Show (16:9)” in the drop down for "Slides Sized for".
- The slide or theme will change to widescreen, and all graphics will adjust automatically. You can similarly convert our content to any other desired screen aspect ratio.
Compatible With Google Slides

Get This In WideScreen
You must be logged in to download this presentation.
PowerPoint presentation slides
Slides are editable in PowerPoint. This presentation has 79 slides. Downloads are risk-free. This PPT is useful for the investment bankers and consultants. Slides are compatible with Google slides. Customers have Prime support. The Presentation works well in standard and widescreen. This is a one stage process. The stages in this process are product team, business model canvas, investment deals, investor scorecard, diversified global portfolio.
Content of this Powerpoint Presentation
Slide 1: This slide presents Investor Personality Profile. State Your Company Name and begin
Slide 2: This slide shows Our Agenda. State your company agengda and use it as per your requirement.
Slide 3: This slide presents Company Investor Update with these three criterias- Position, Name, Email Address.
Slide 4: This slide showcases About Our Company with these four parameters- No. of employees, Funding, Headquarters, Company founded.
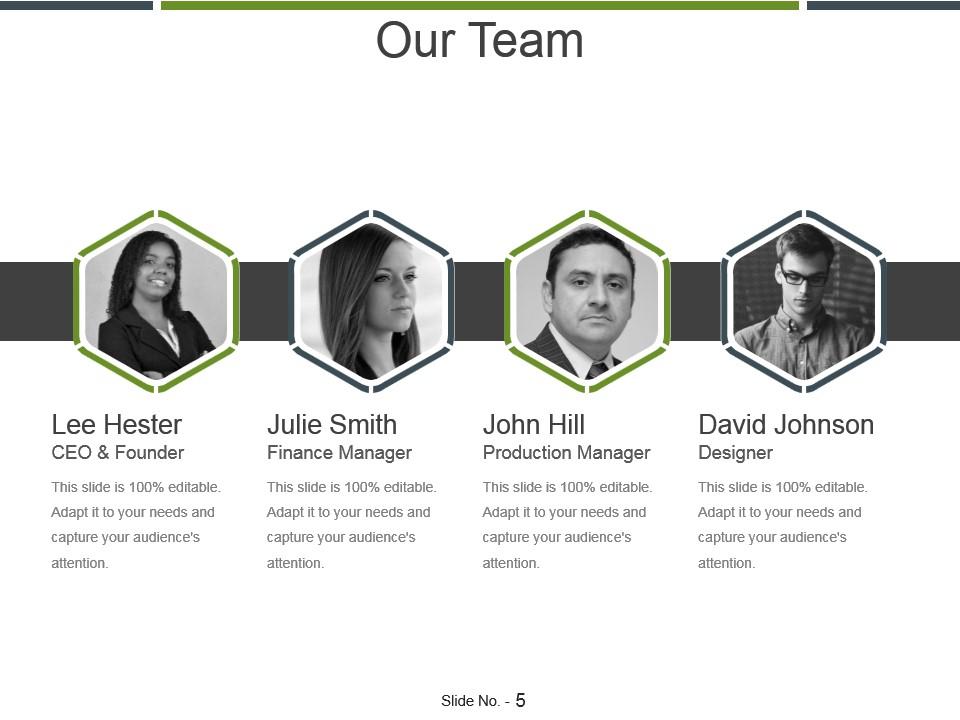
Slide 5: This slide presents Our Team. Add your company description and use it.
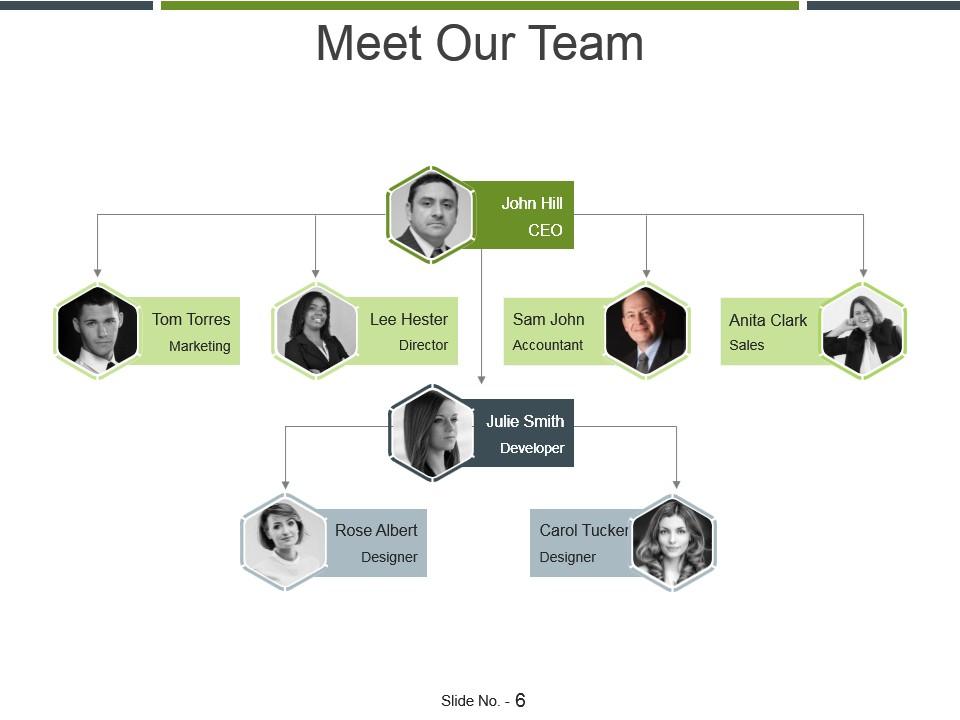
Slide 6: This slide shows Meet Our Team with a flow chart diagram.
Slide 7: This slide showcases Product Team.
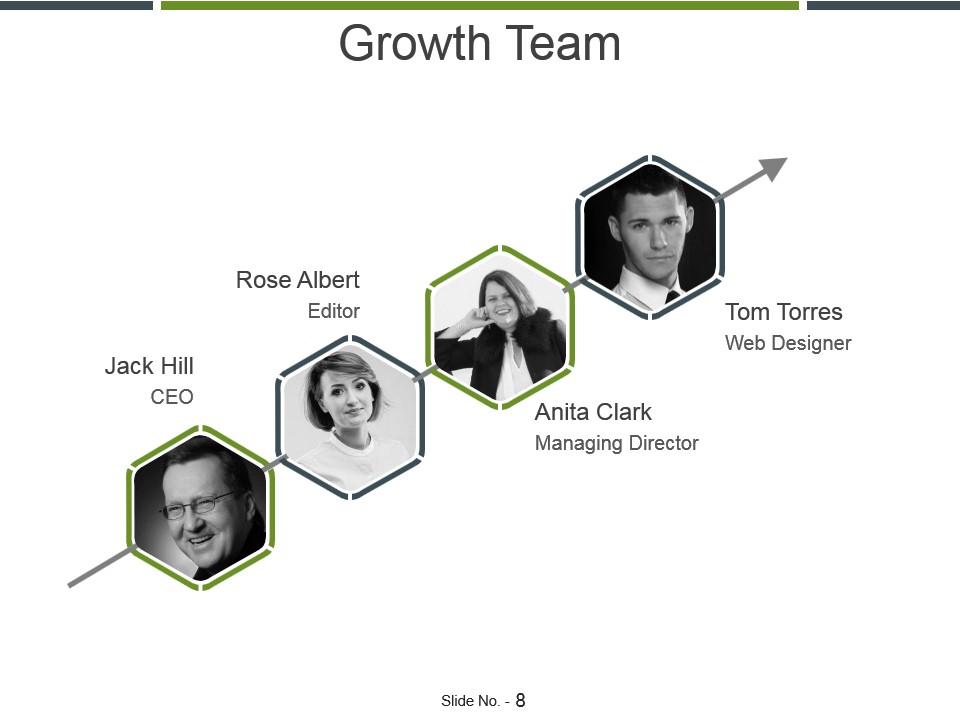
Slide 8: This slide presents Growth Team. Add the team you want to add for your requirement.
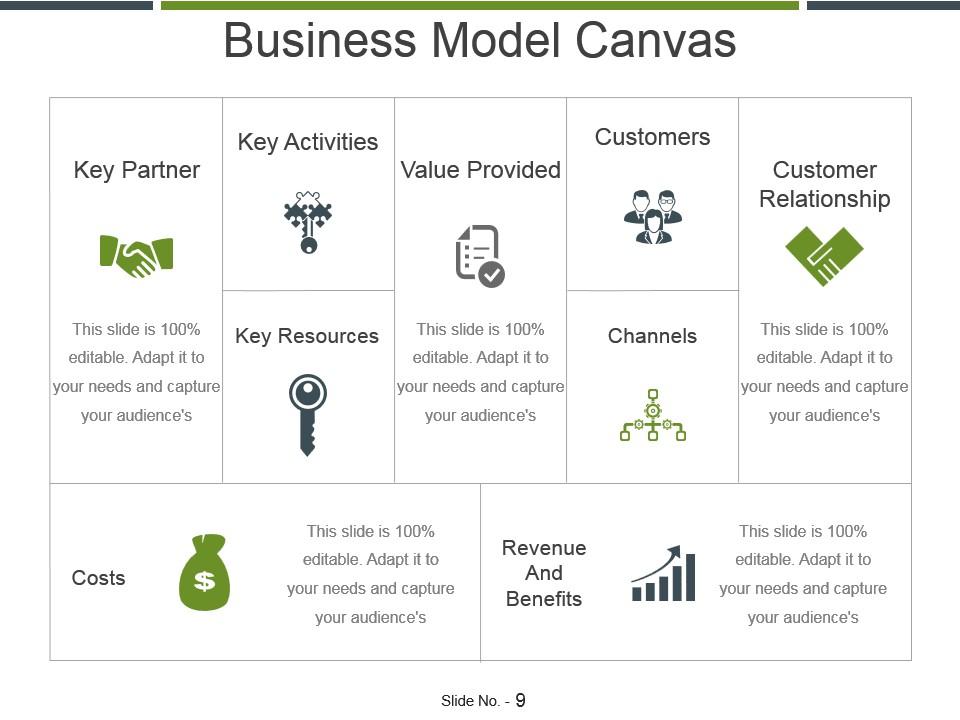
Slide 9: This slide showcases Business Model Canvas with these factors- Key Activities, Key Resources, Channels, Customers, Key Partner, Value Provided, Customer Relationship, Costs, Revenue And Benefits.
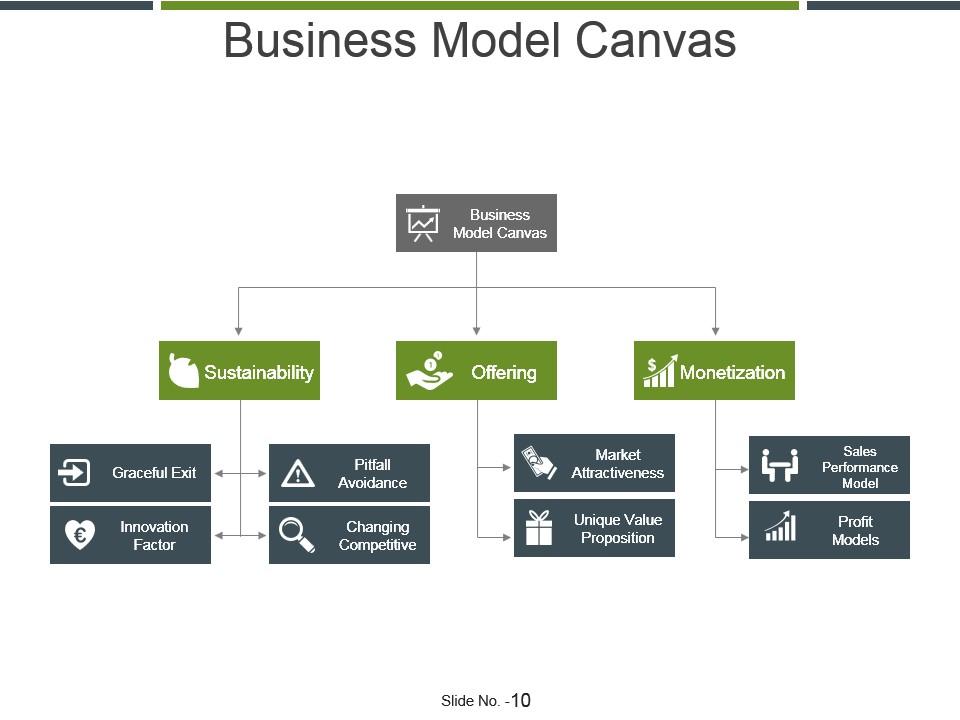
Slide 10: This slide presents Business Model Canvas which further add these factors- Business Model Canvas, Sustainability Offering, Monetization, Unique Value Proposition, Market Attractiveness, Innovation Factor, Changing Competitive, Pitfall Avoidance, Graceful Exit Profit Models Sales Performance Model
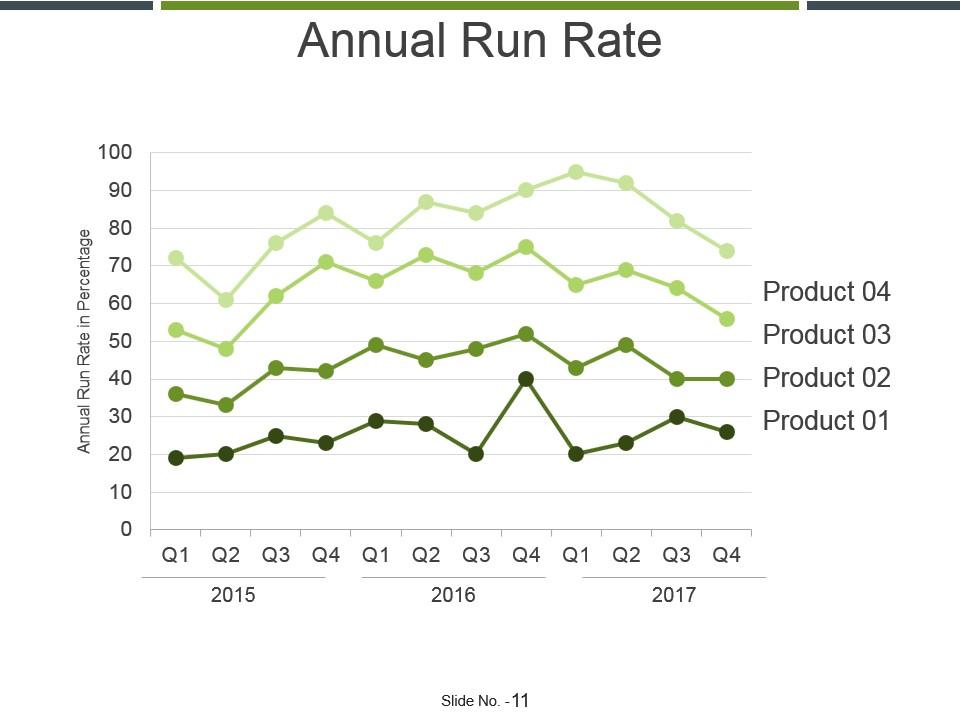
Slide 11: This slide showcases Annual Run Rate with a graph.
Slide 12: This slide presents Revenue Model with five factors.
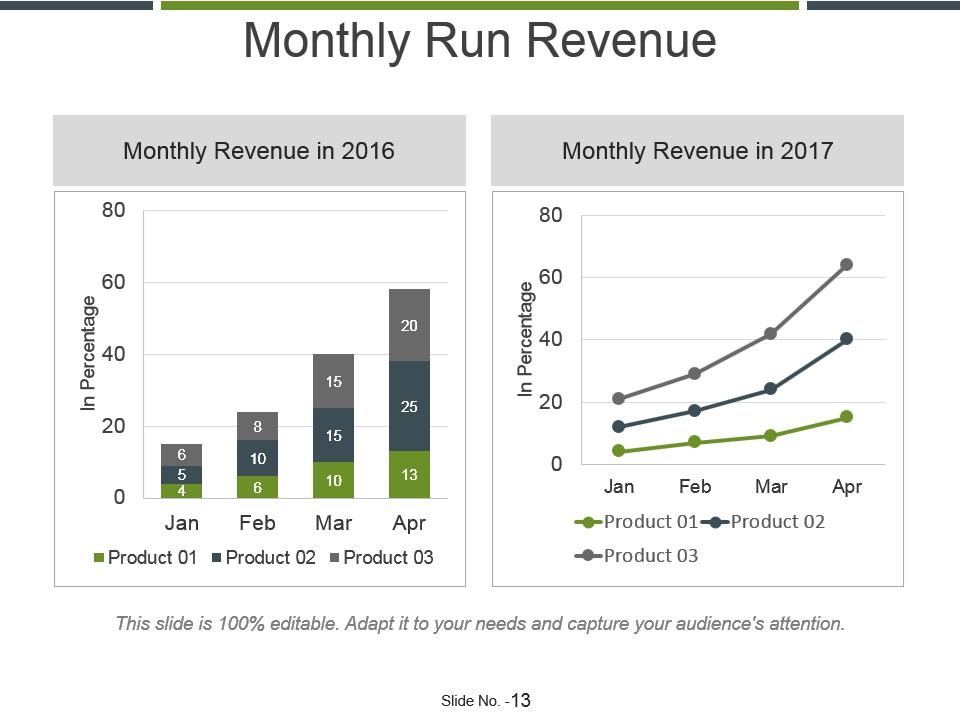
Slide 13: This slide shows Monthly Run Revenue with two charts comparison.
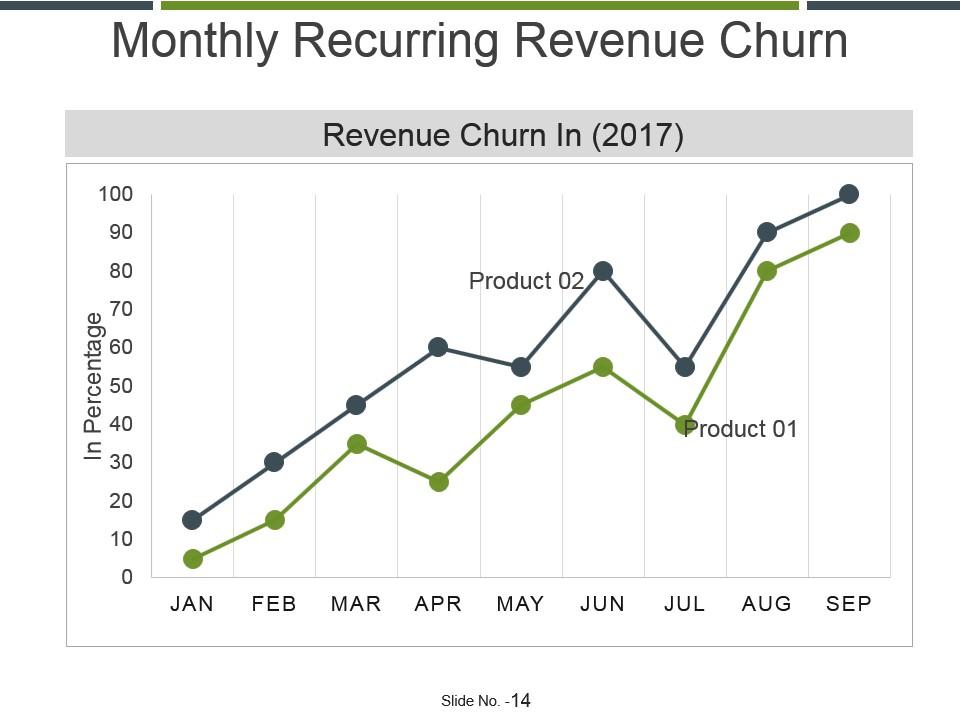
Slide 14: This slide presents Monthly Recurring Revenue Churn which help you to compare the two products.
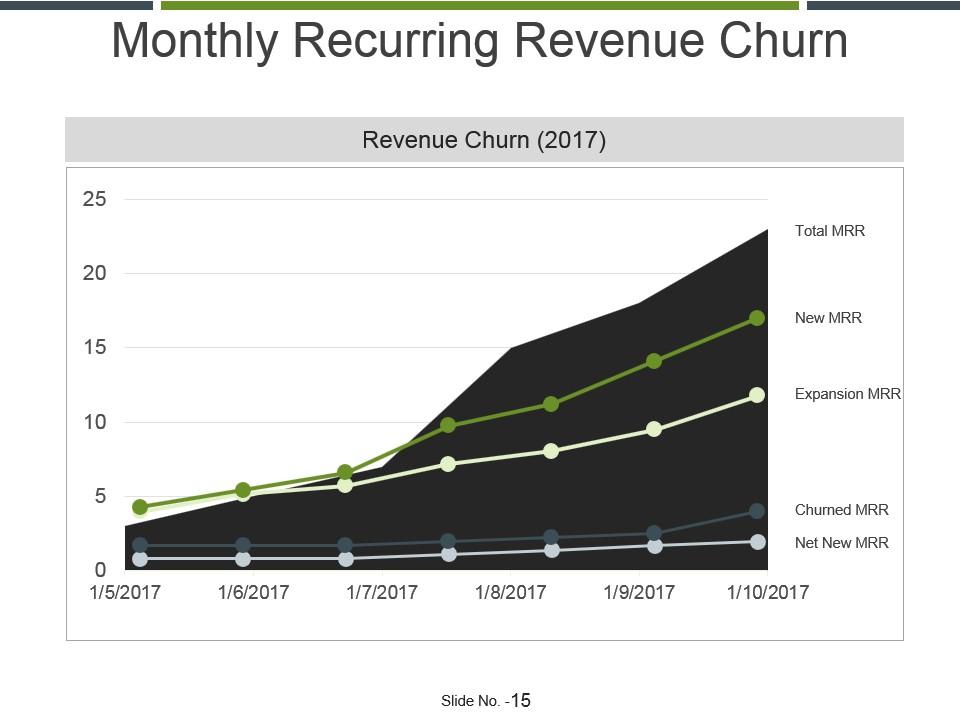
Slide 15: This slide showcases Monthly Recurring Revenue Churn. You can show the data and make use of it.
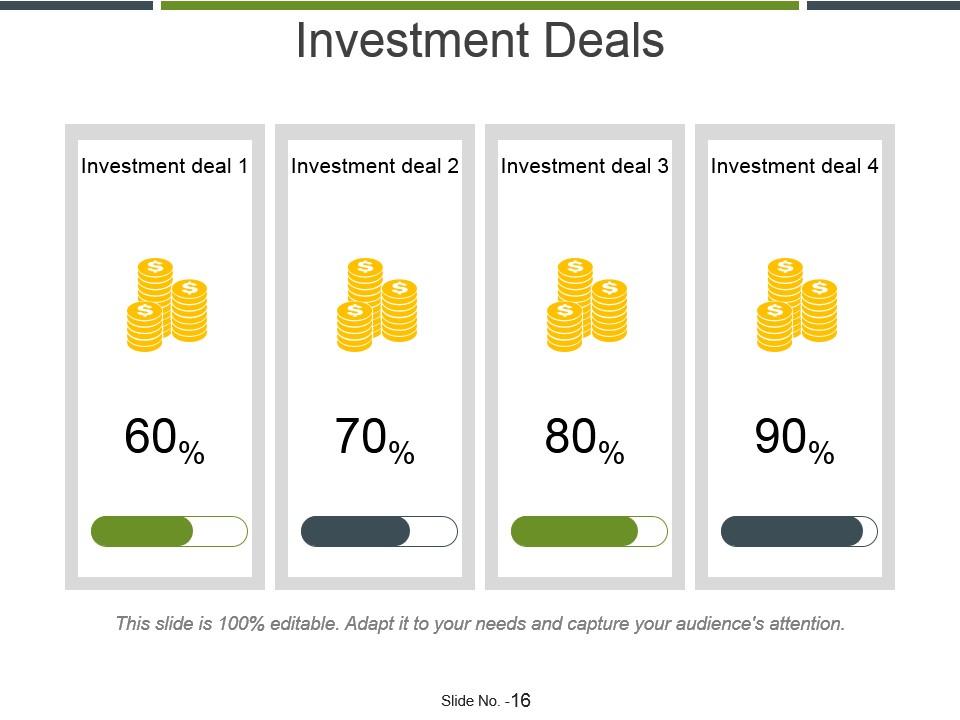
Slide 16: This slide presents Investment Deals. you can add the percentage in investment deal.
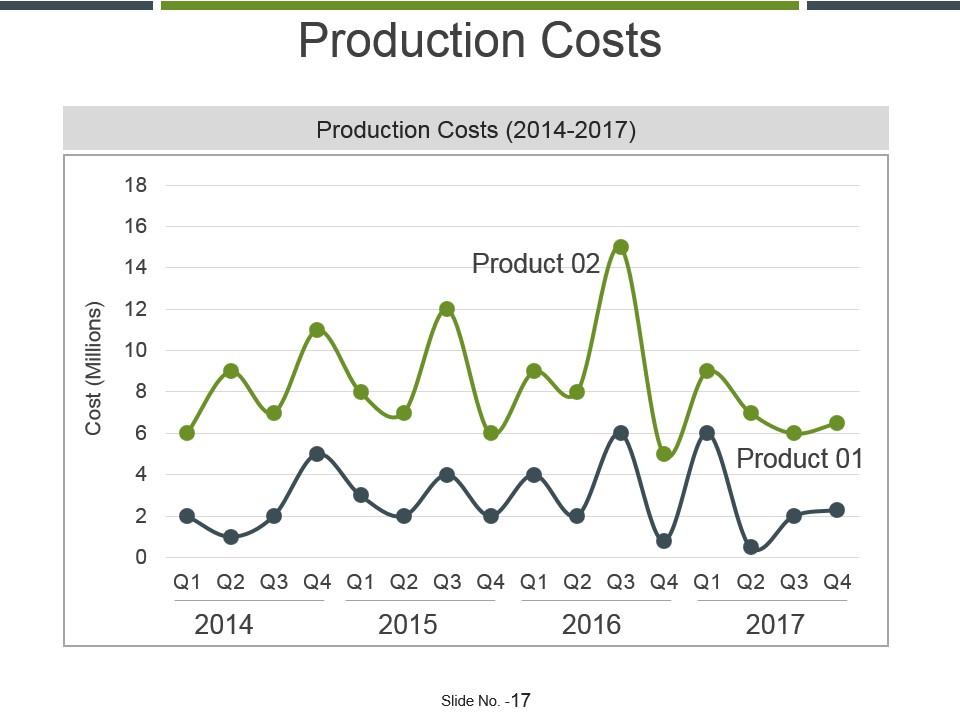
Slide 17: This slide showcases Production Costs with a bar chart.
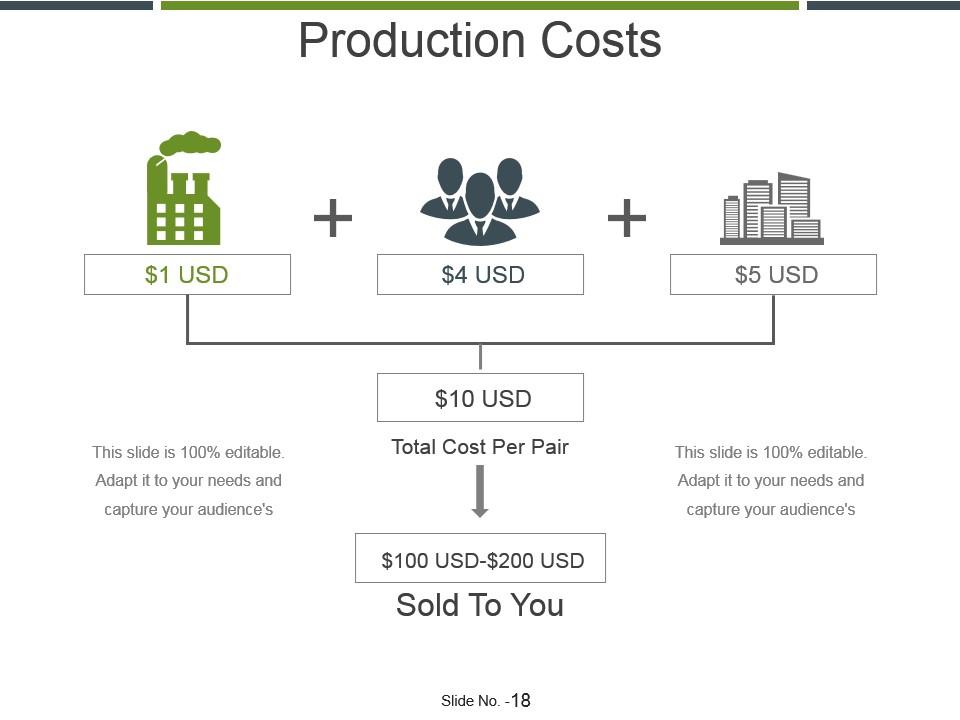
Slide 18: This slide presents Production Costs with this you can add the data/information as you needed.
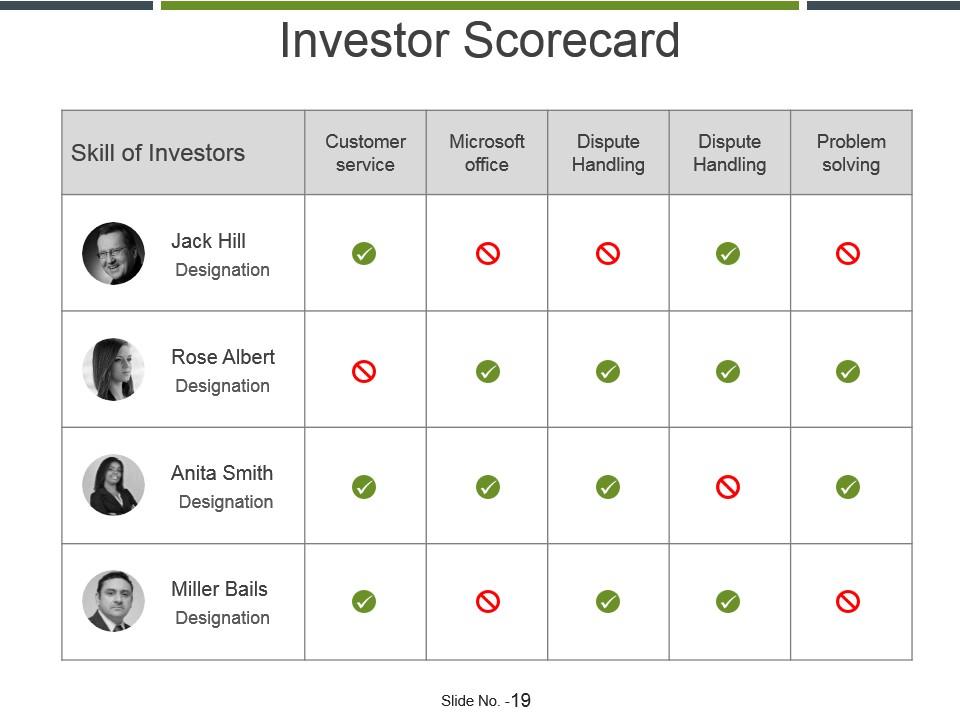
Slide 19: This slide showcases Investor Scorecard table. Add the name and designation.
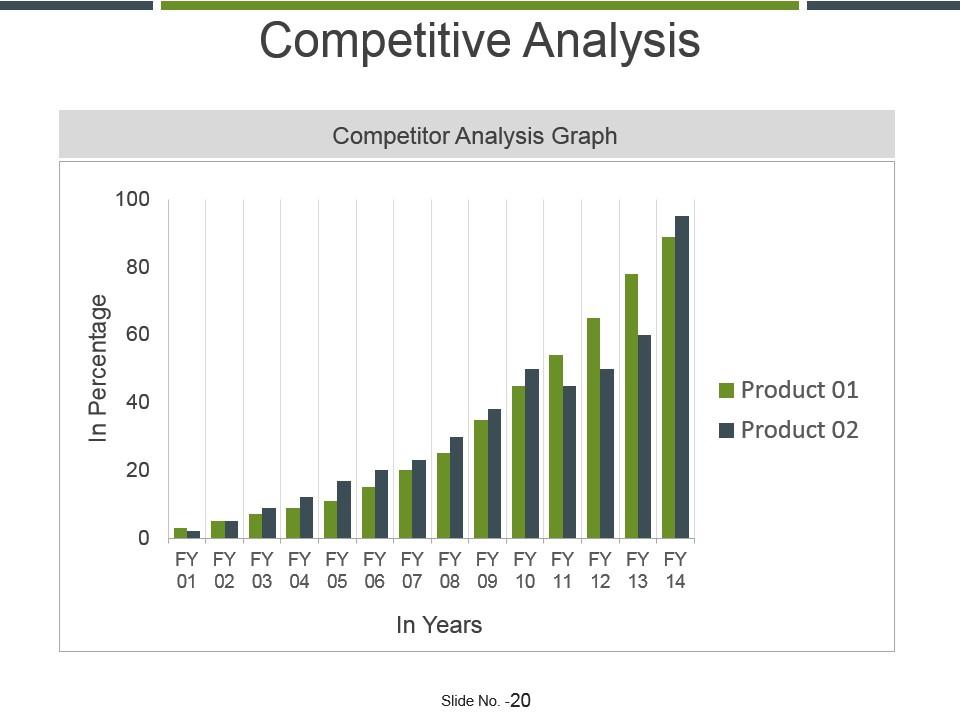
Slide 20: This slide presents Competitive Analysis. You can add the Competitor Analysis Graph.
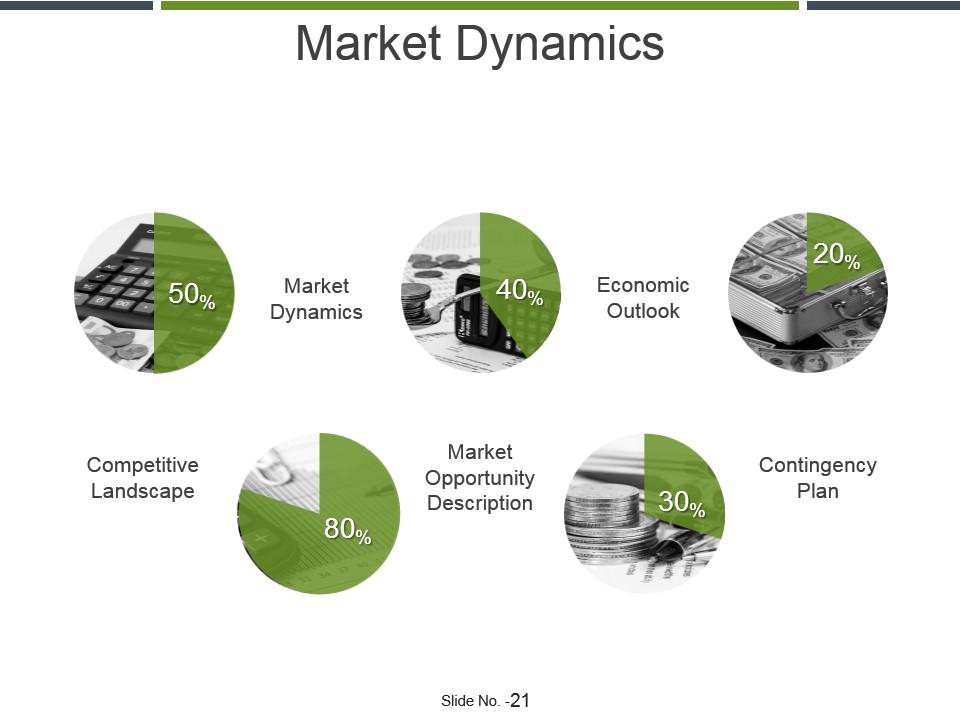
Slide 21: This slide showcases Market Dynamics with pie chart.
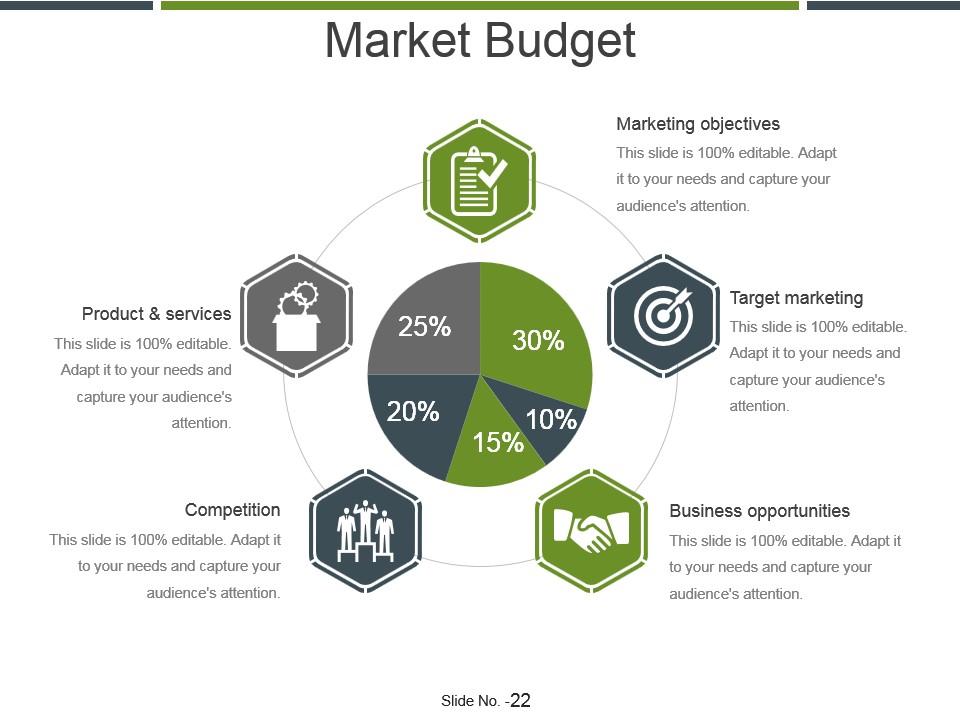
Slide 22: This slide presents Market Budget with these main factors- Marketing objectives, Target marketing, Business opportunities, Competition, Product & services.
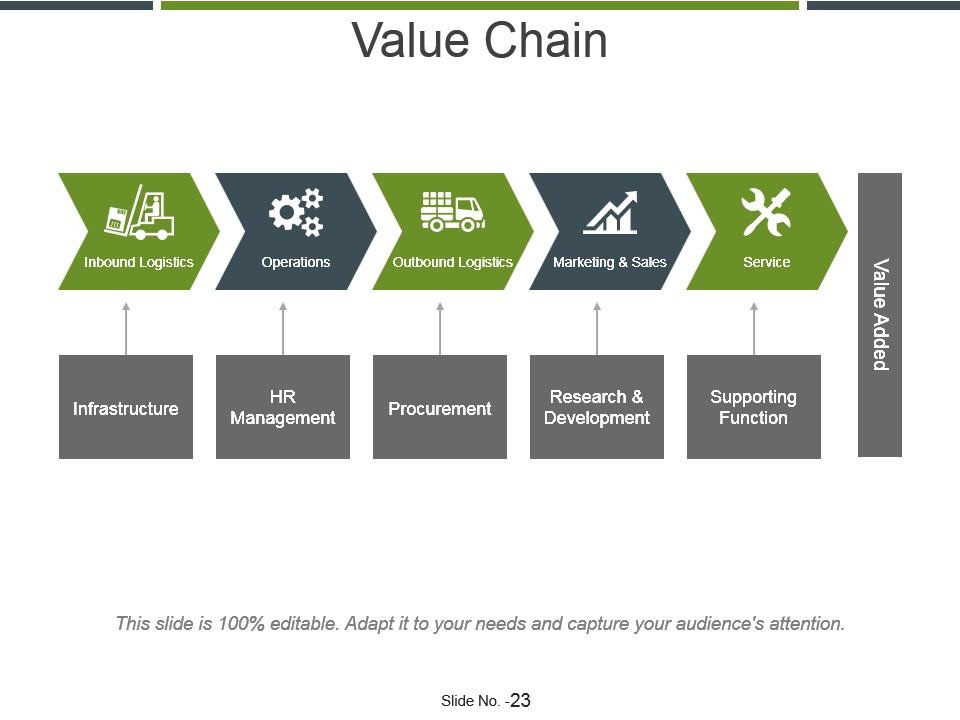
Slide 23: This slide shows Value Chain with these parameters- Inbound Logistics, Operations, Outbound Logistics, Marketing & Sales, Service, Infrastructure, HR Management, Research & Development, Procurement, Supporting Function, Value Added.
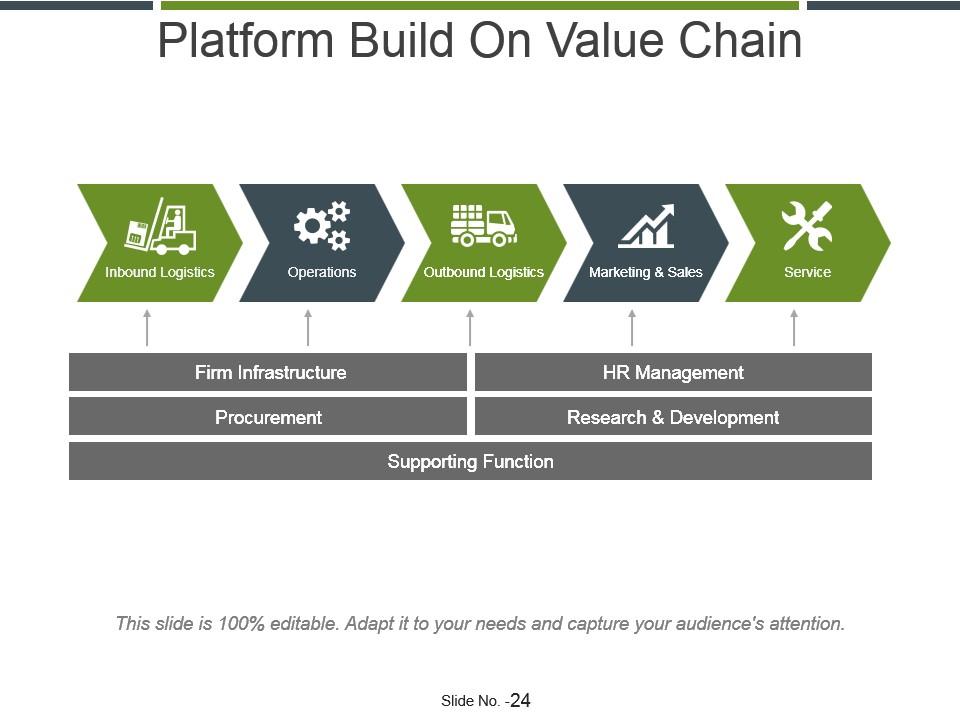
Slide 24: This slide presents Platform Build On Value Chain- Firm Infrastructure, HR Management, Research & Development, Procurement, Supporting Function, Inbound Logistics, Operations, Outbound Logistics, Marketing & Sales, Service.
Slide 25: This slide is a Coffee Break image for a halt.
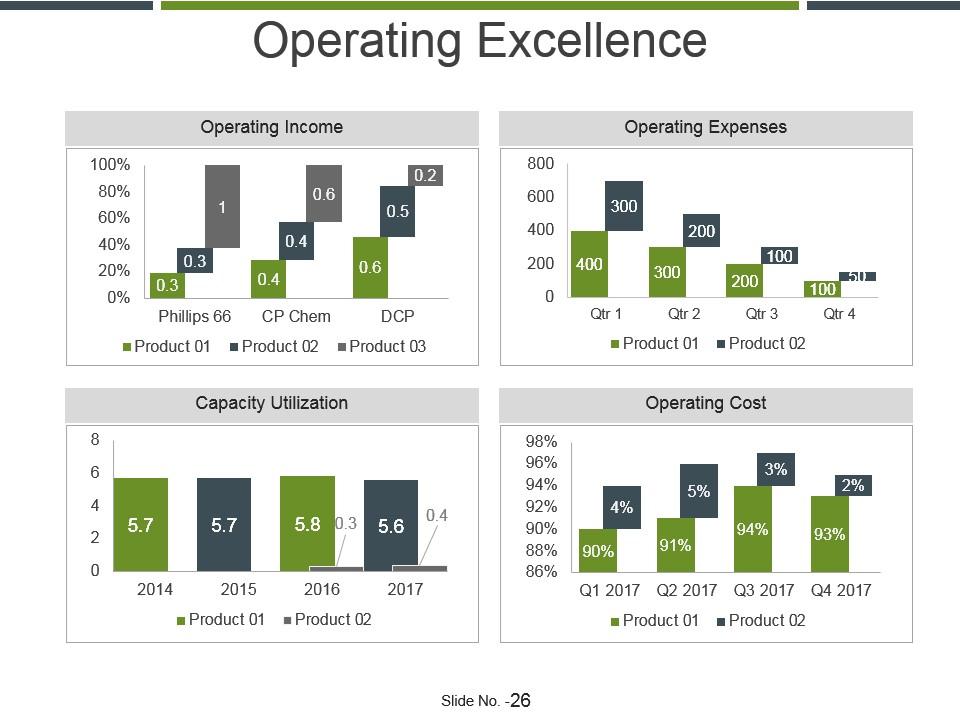
Slide 26: This slide showcases Capacity Utilization with these points- Operating Excellence, Operating Income, Operating Expenses, Operating Cost.
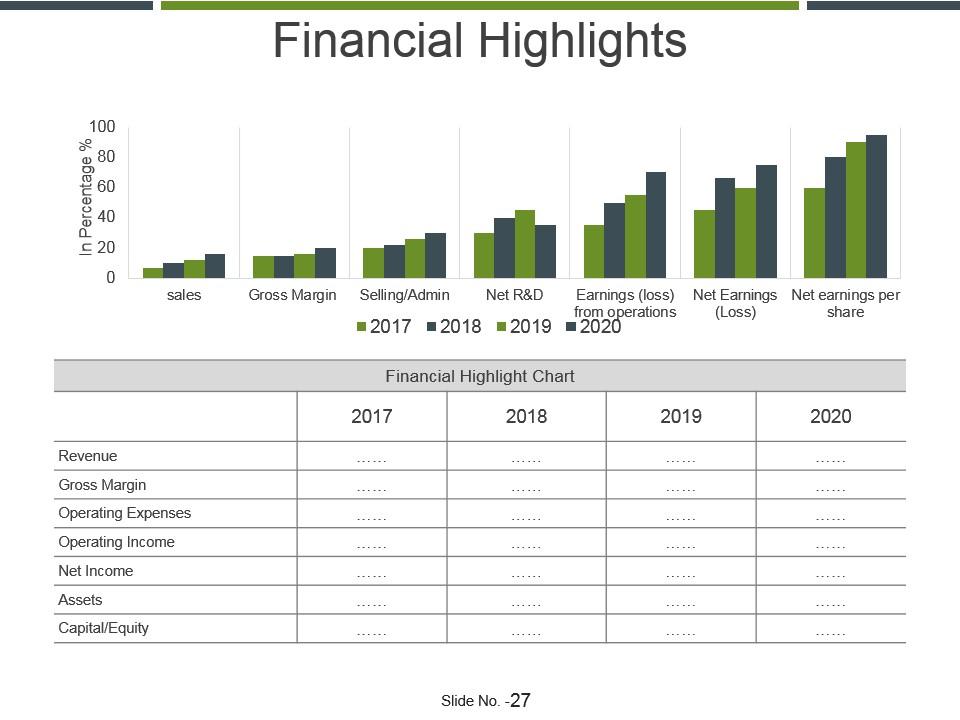
Slide 27: This slide presents Financial Highlights.
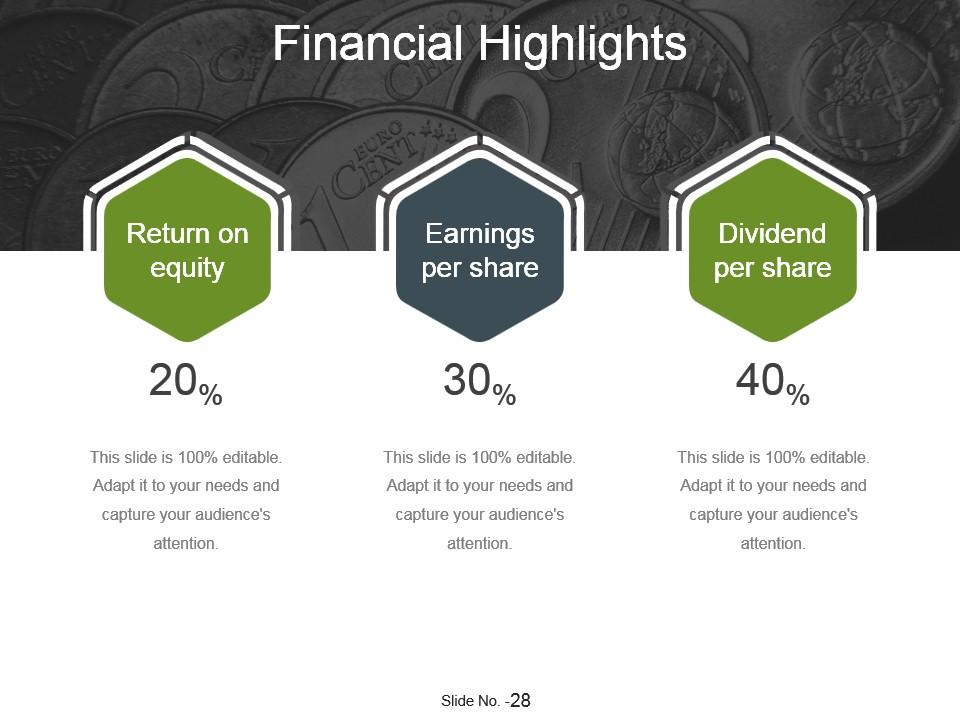
Slide 28: This slide showcases financial highlights with these three factors- Earnings per share, Dividend per share, Return on equity.
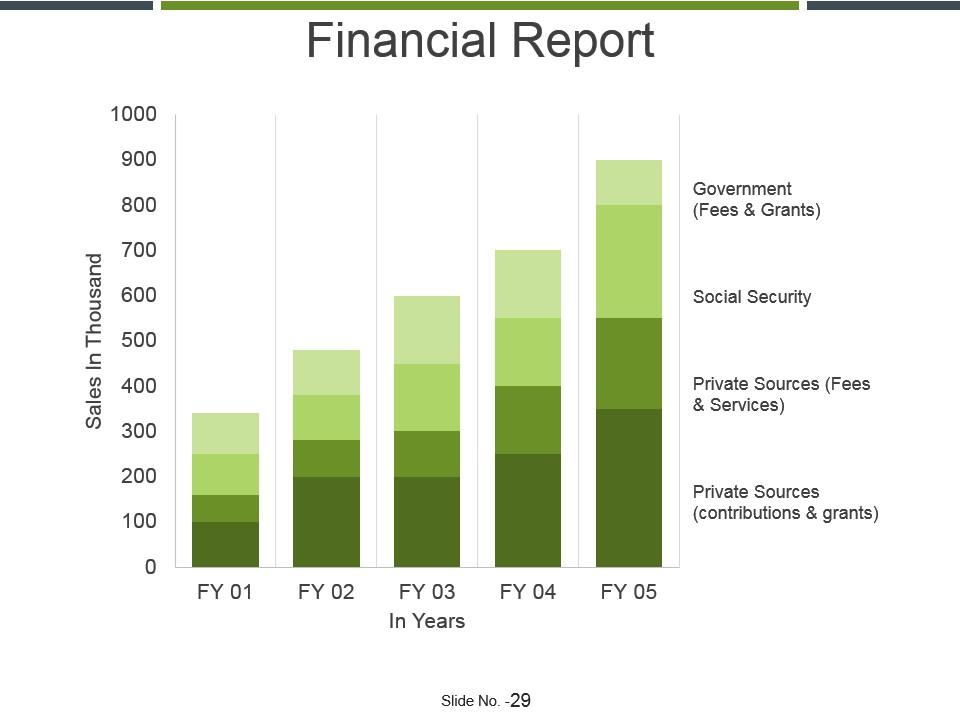
Slide 29: This slide showcases Financial Report with four of the parameters- Government (Fees & Grants), Social Security, Private Sources (contributions & grants), Private Sources (Fees & Services).
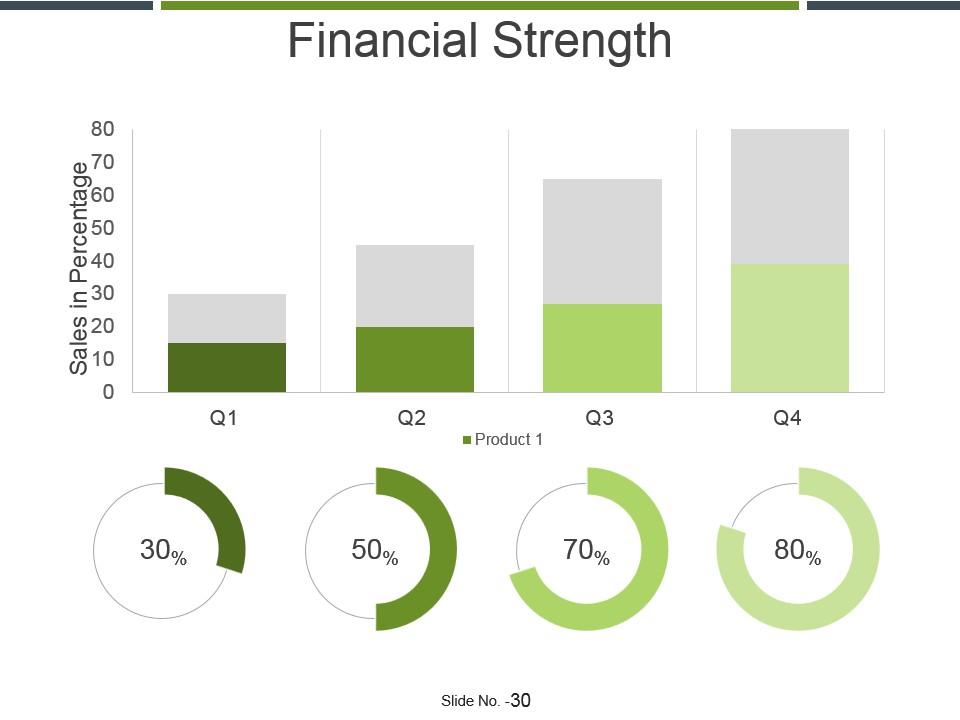
Slide 30: This slide presents Financial Strength graph and percentage difference.
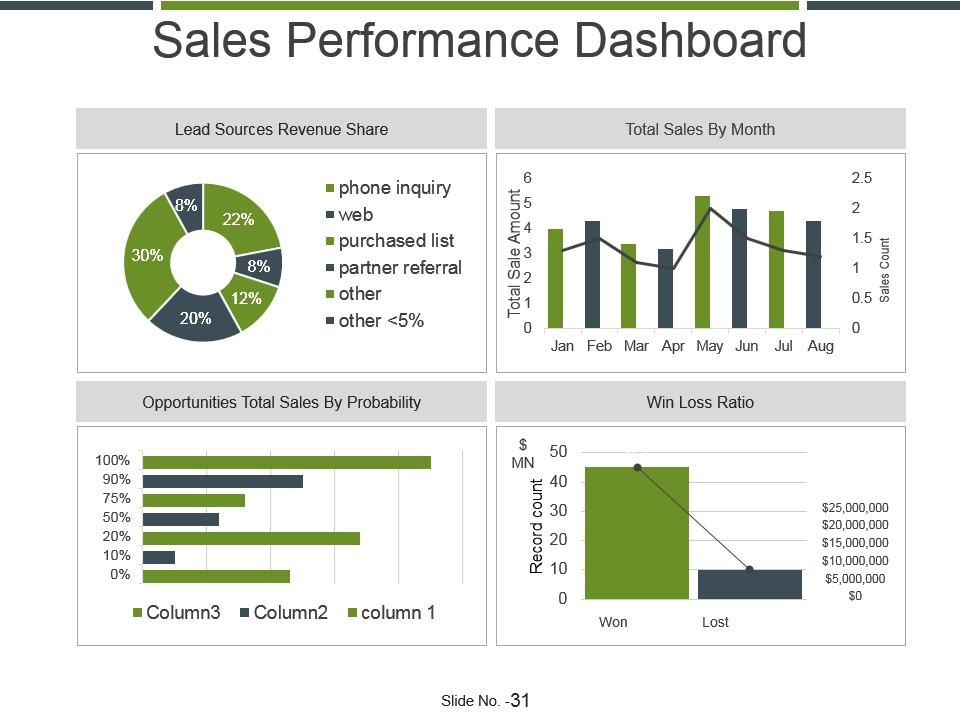
Slide 31: This slide shows Sales Performance Dashboard with pie chart and bar graph. You can add the data/information.
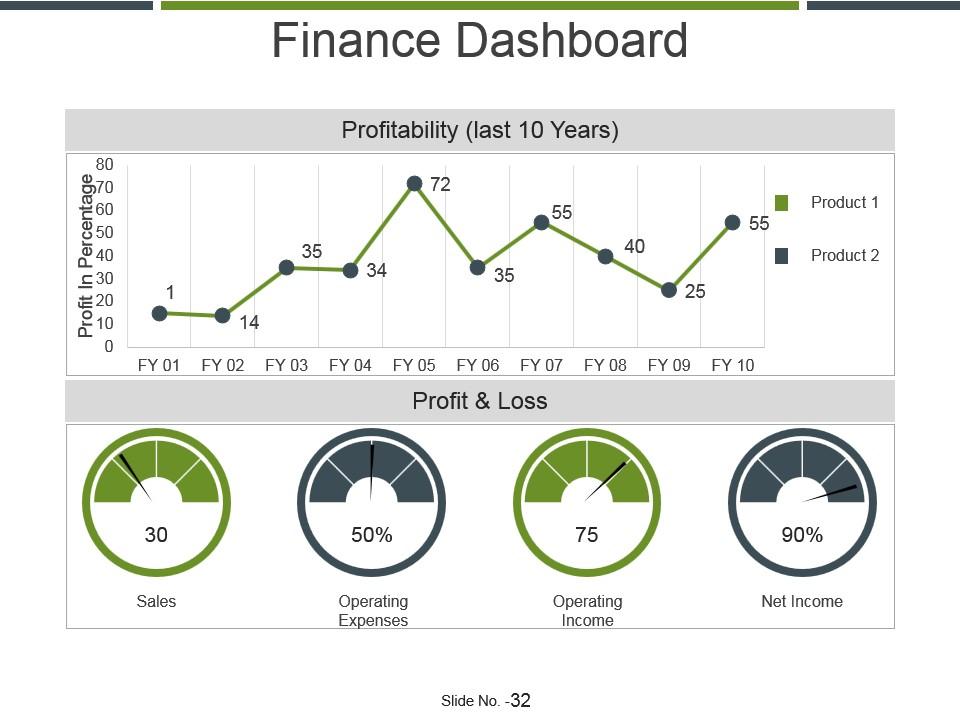
Slide 32: This slide presents Finance Dashboard with probability and profit and loss chart.
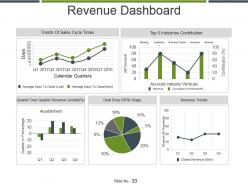
Slide 33: This slide showcases Revenue Dashboard with some of the parameters we have listed.
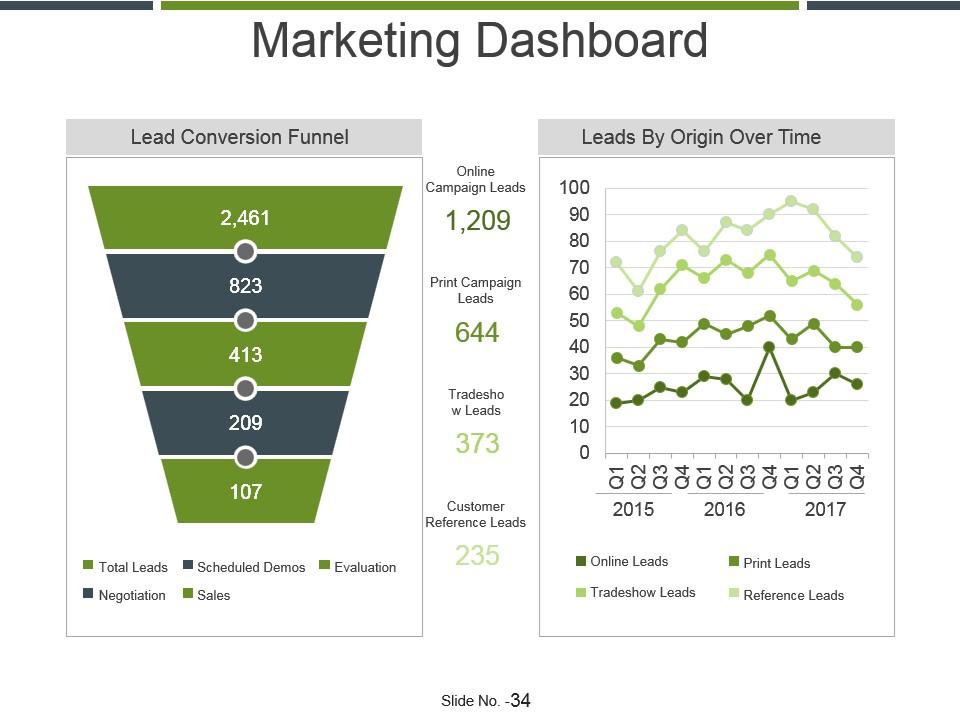
Slide 34: This slide shows Marketing Dashboard with lead conversion funnel and lead by origin time.
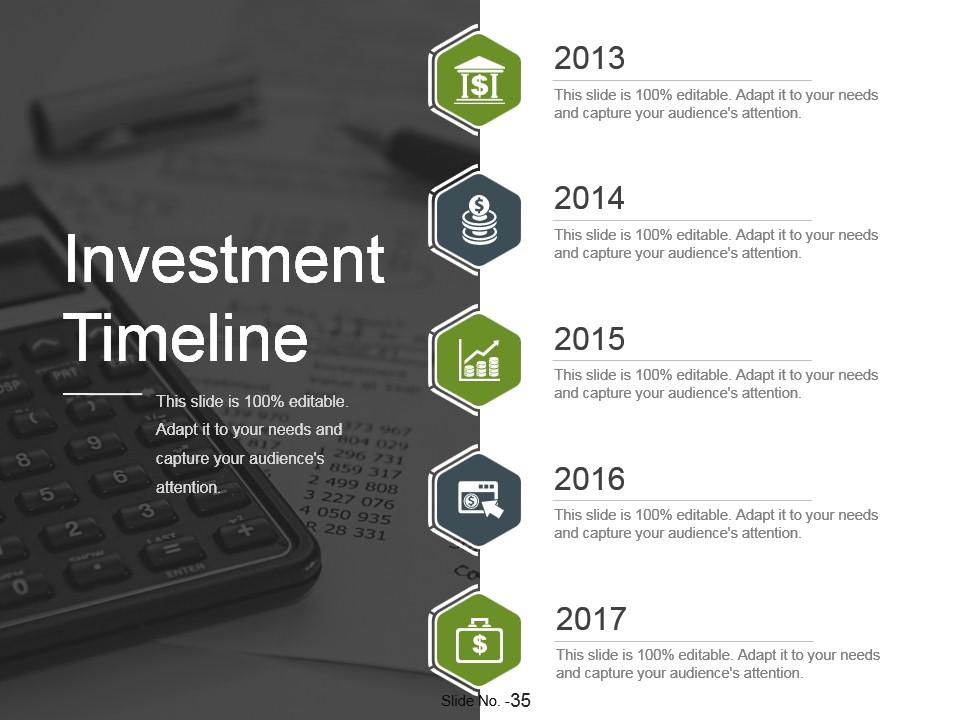
Slide 35: This is a Timelines slide to show- Plan, Budget, Schedule, Review. -
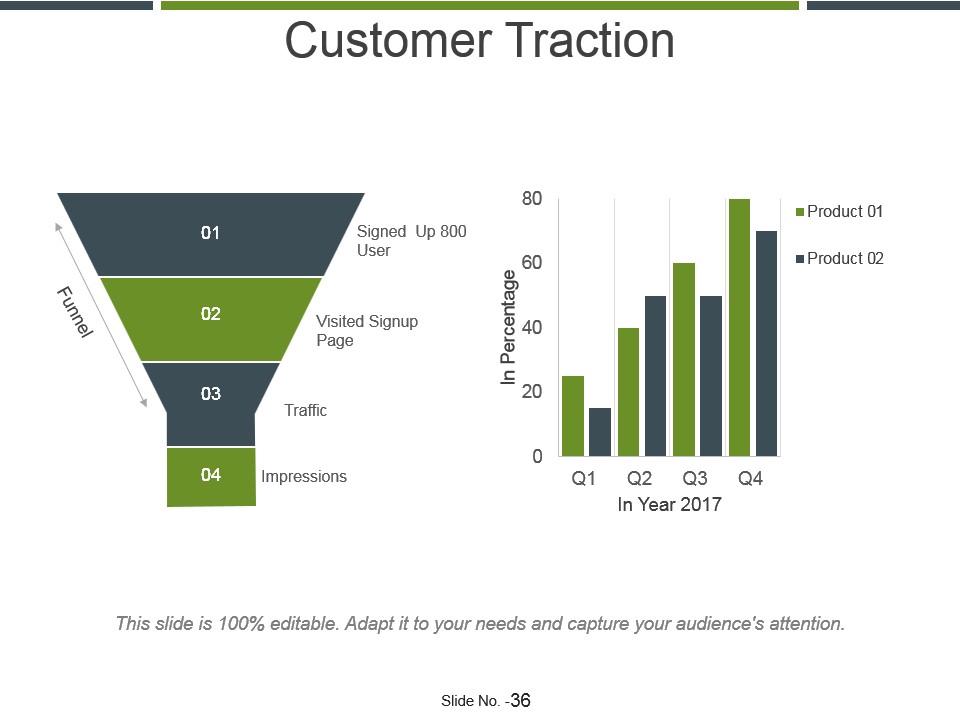
Slide 36: This slide presents Customer Traction with a funnel and a bar graph for comparison of the two product.
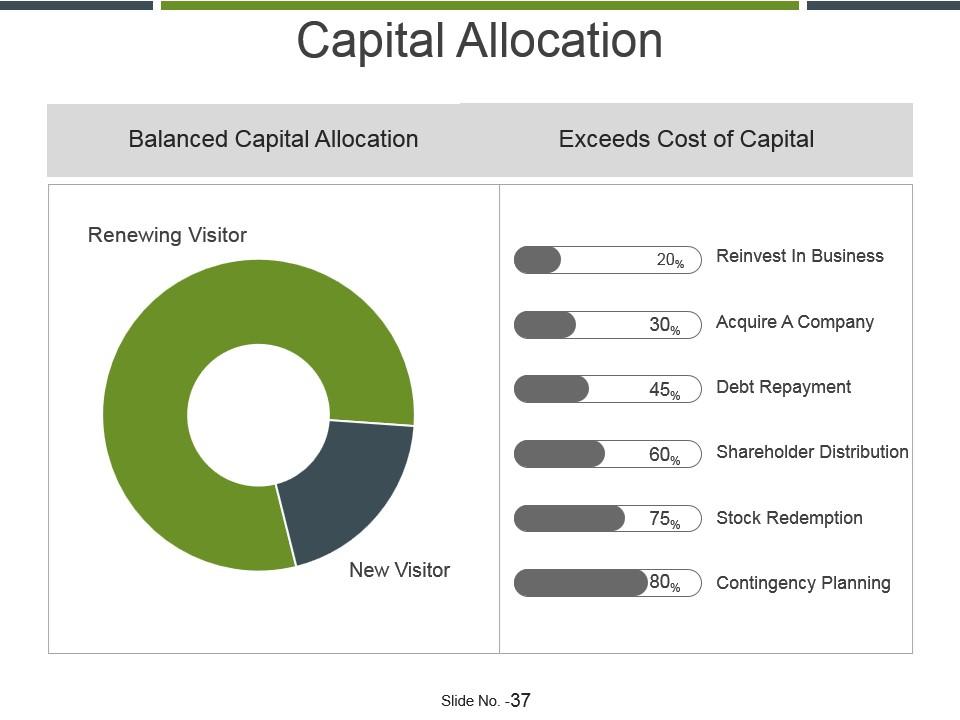
Slide 37: This slide showcases Capital Allocation with balanced capital allocation and exceeds cost of capital.
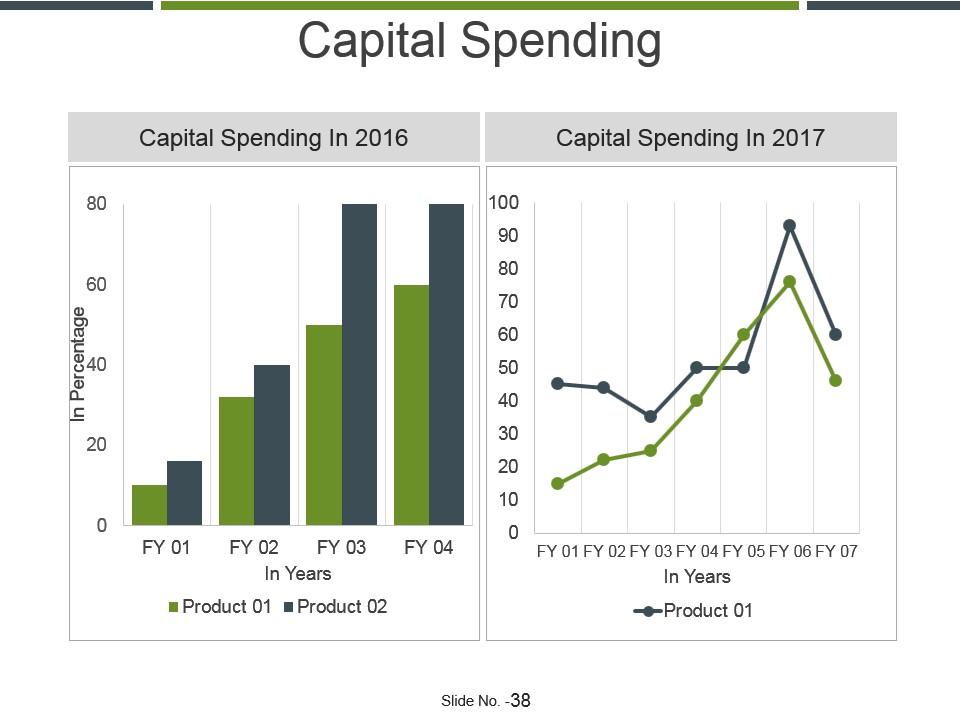
Slide 38: This slide presents Capital Spending which further includes- Capital Spending In 2017, Capital Spending In 2016.
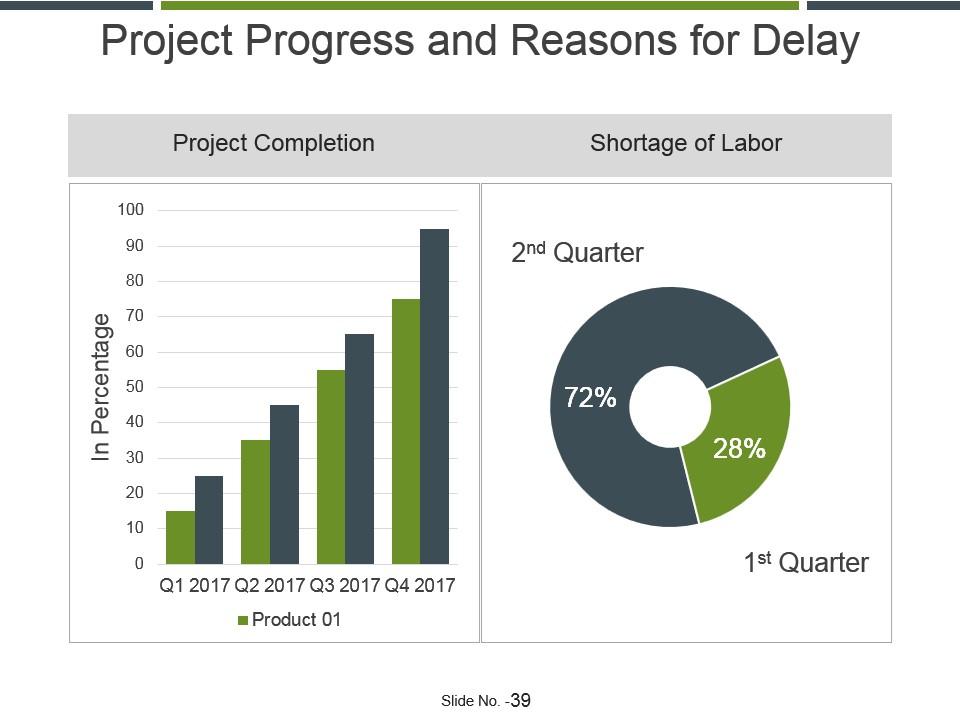
Slide 39: This slide shows Project Progress and Reasons for Delay with two parameter- Project Completion, Shortage of Labor.
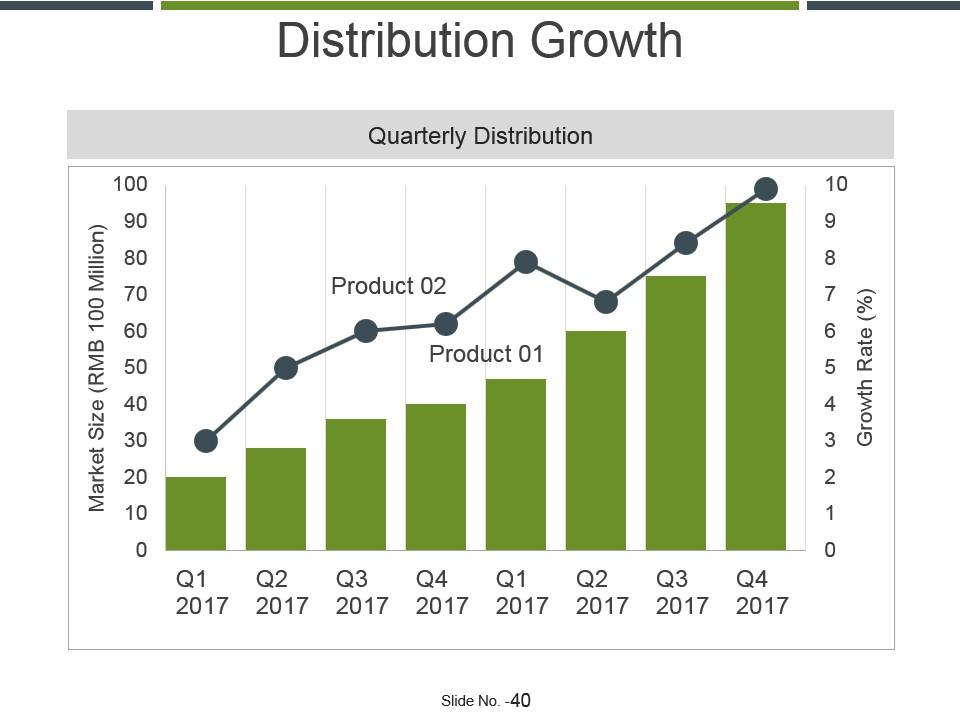
Slide 40: This slide presents Distribution Growth with Quarterly Distribution.
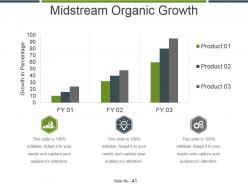
Slide 41: This slide shows Midstream Organic Growth with three financial year.
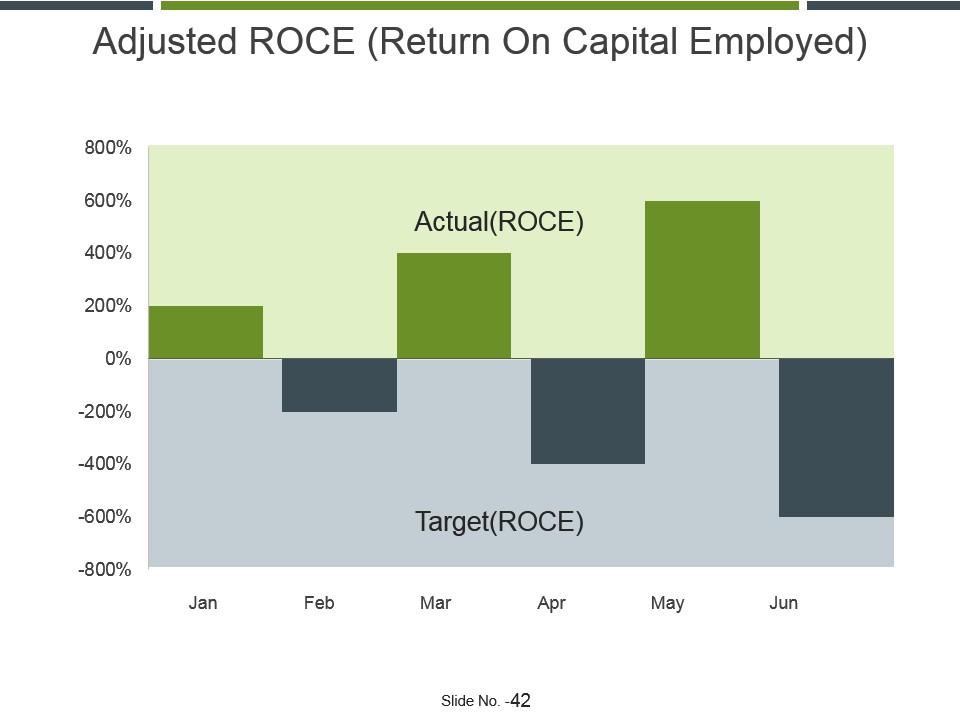
Slide 42: This slide presents Adjusted ROCE (Return On Capital Employed).
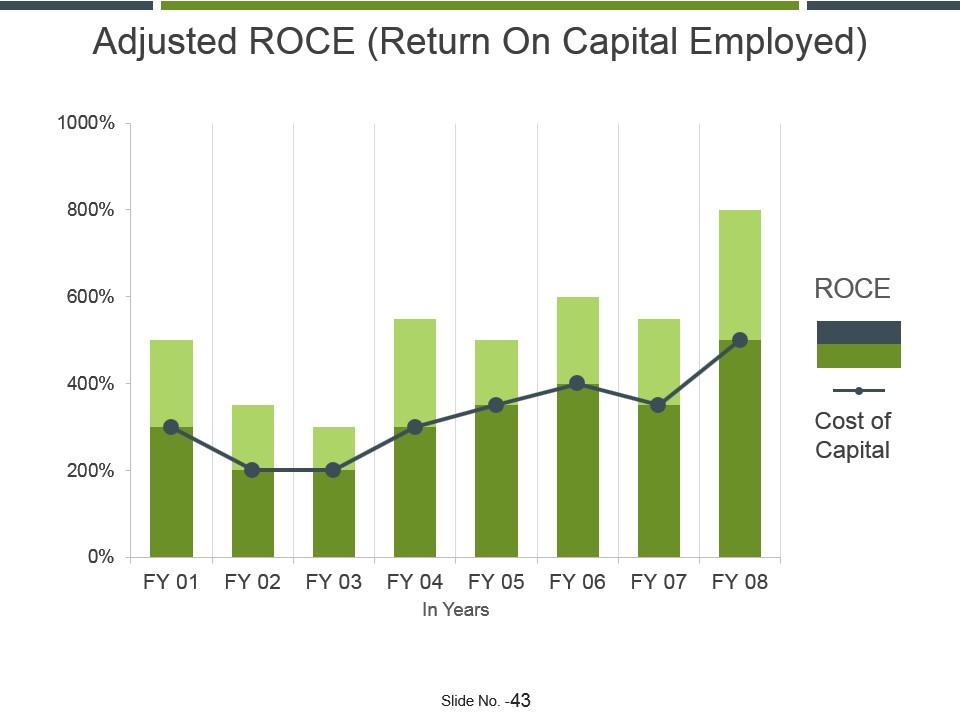
Slide 43: This slide showcases Adjusted ROCE (Return On Capital Employed).
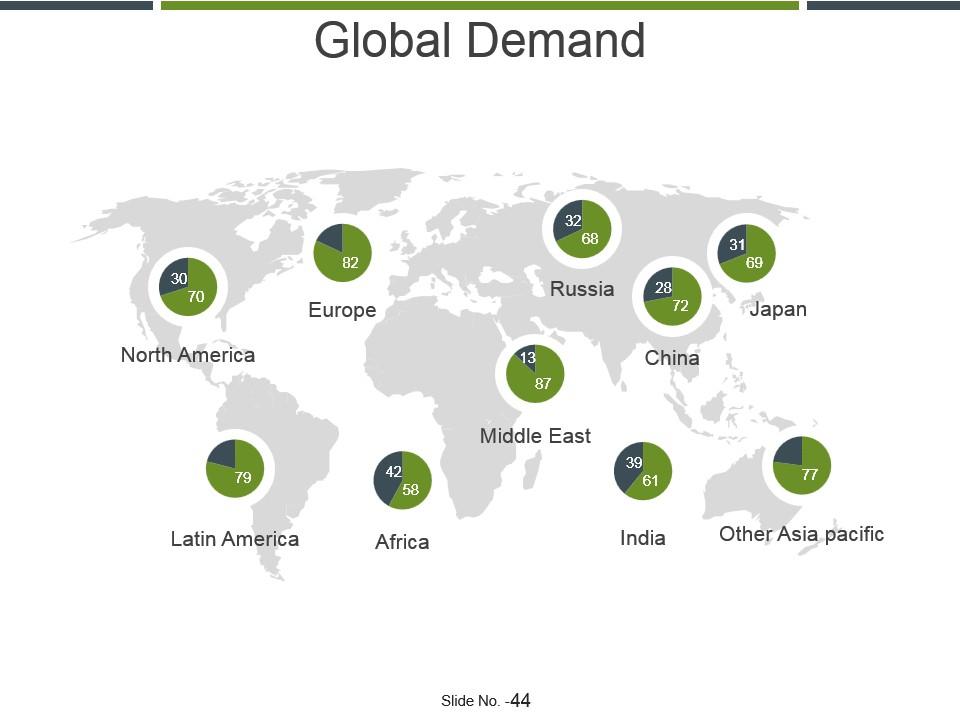
Slide 44: We have listed some of the countries Global Demand. You can pick and use it accordingly.
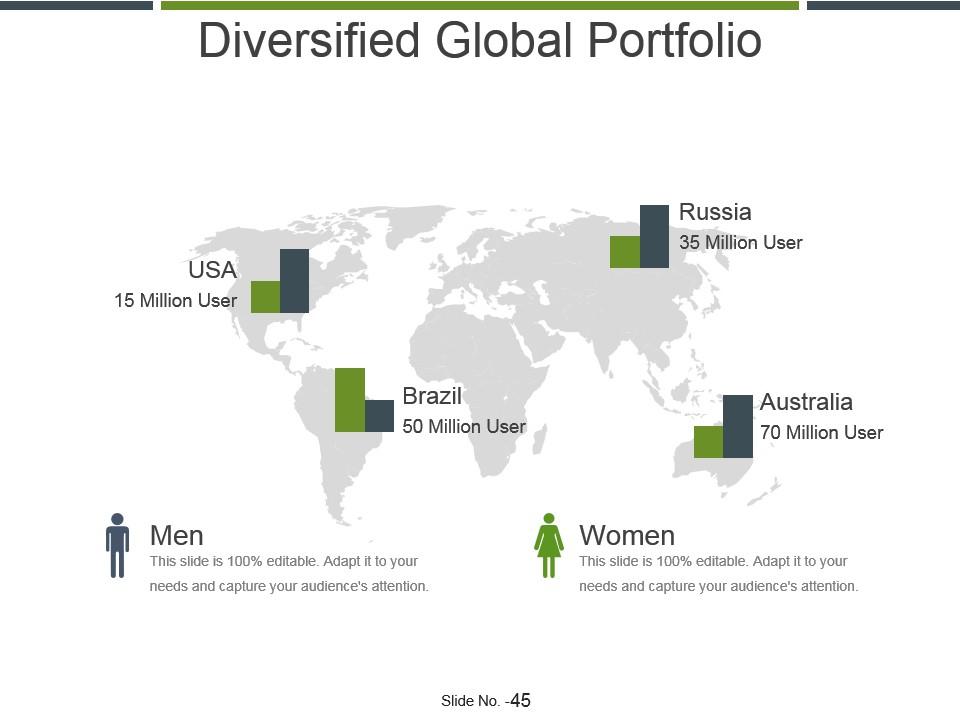
Slide 45: This slide presents diversified global portfolio.
Slide 46: This slide shows Investor Personality Profile Icons Set.
Slide 47: This slide is titled Additional slides.
Slide 48: This slide helps show- About Our Company. The sub headings include- Creative Design, Customer Care, Expand Company .
Slide 49: This is Our mission slide with imagery and text boxes to go with.
Slide 50: This is an Our Goal slide. State your important goals here.
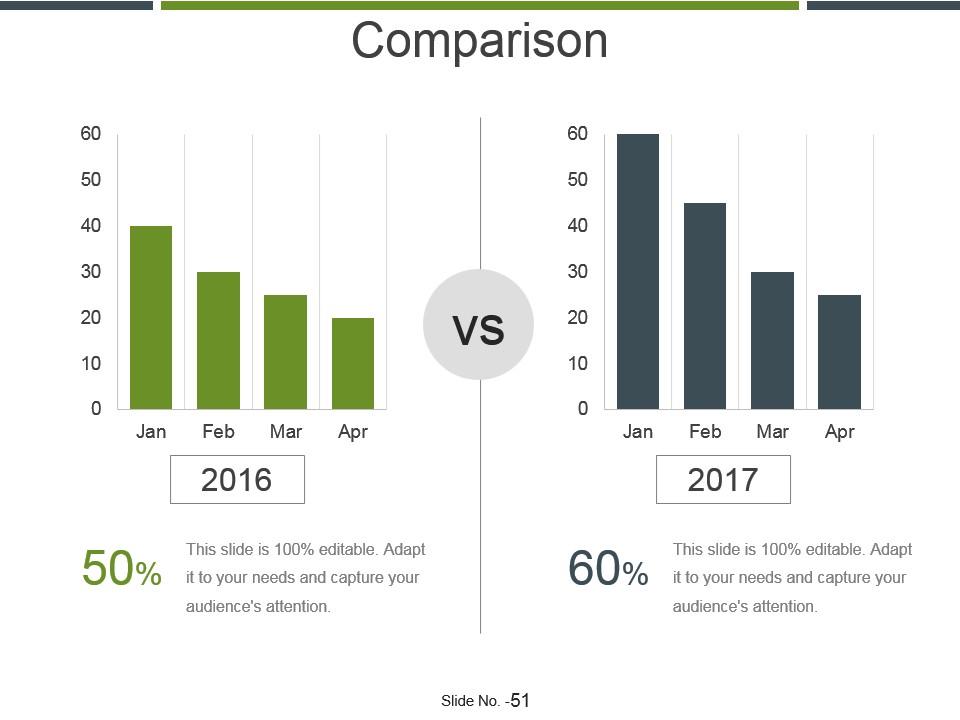
Slide 51: This slide shows Comparison of Positive Factors v/s Negative Factors with thumbsup and thumb down imagery.
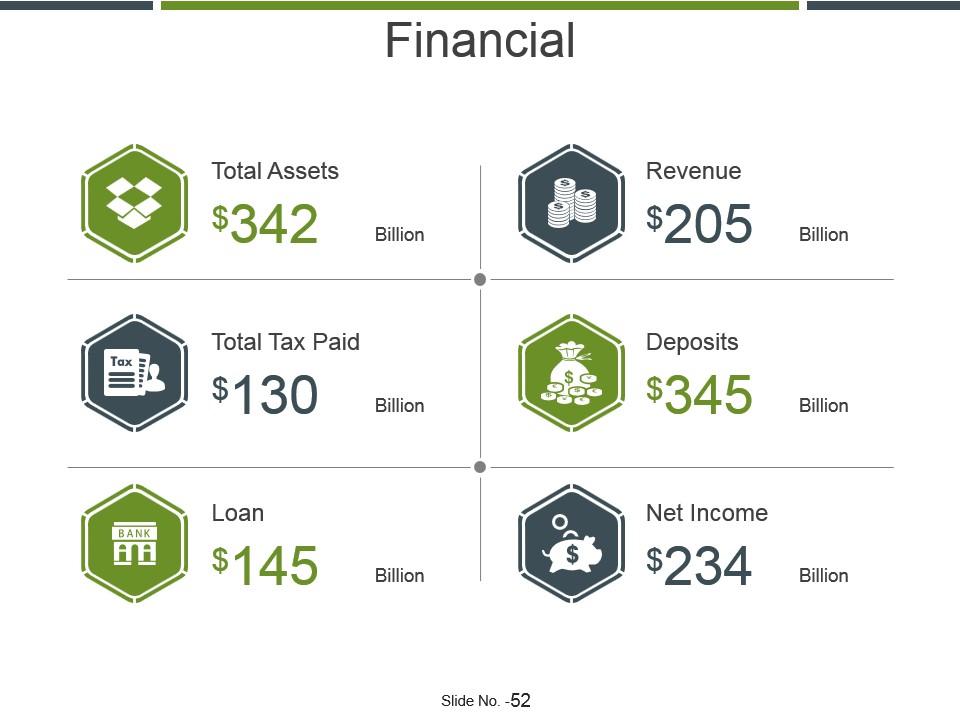
Slide 52: This is a Financial Score slide to show financial aspects here.
Slide 53: This is a Quotes slide to convey message, beliefs etc.
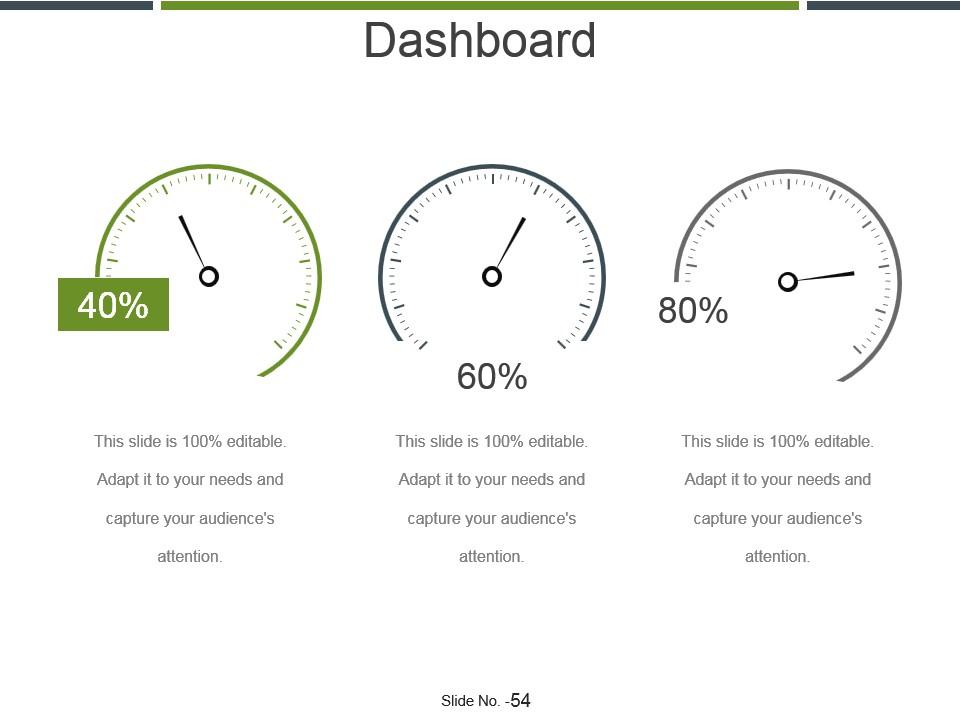
Slide 54: This is a Dashboard slide to show- Strategic System, Success, Goal Process, Sales Review, Communication Study.
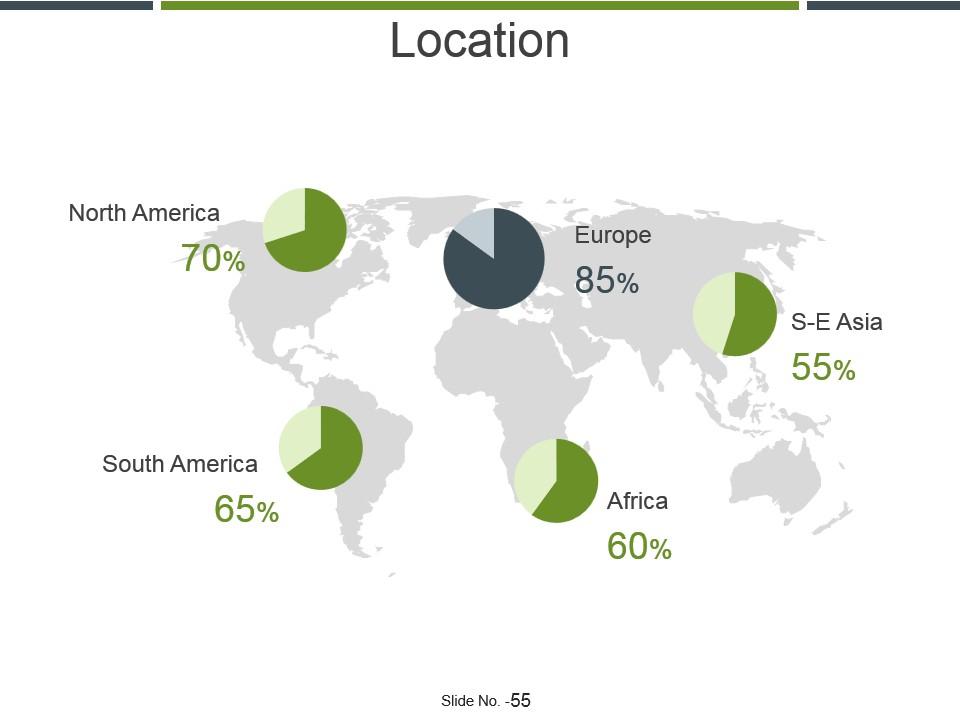
Slide 55: This is a Location slide to show global growth,presence etc. on world map.
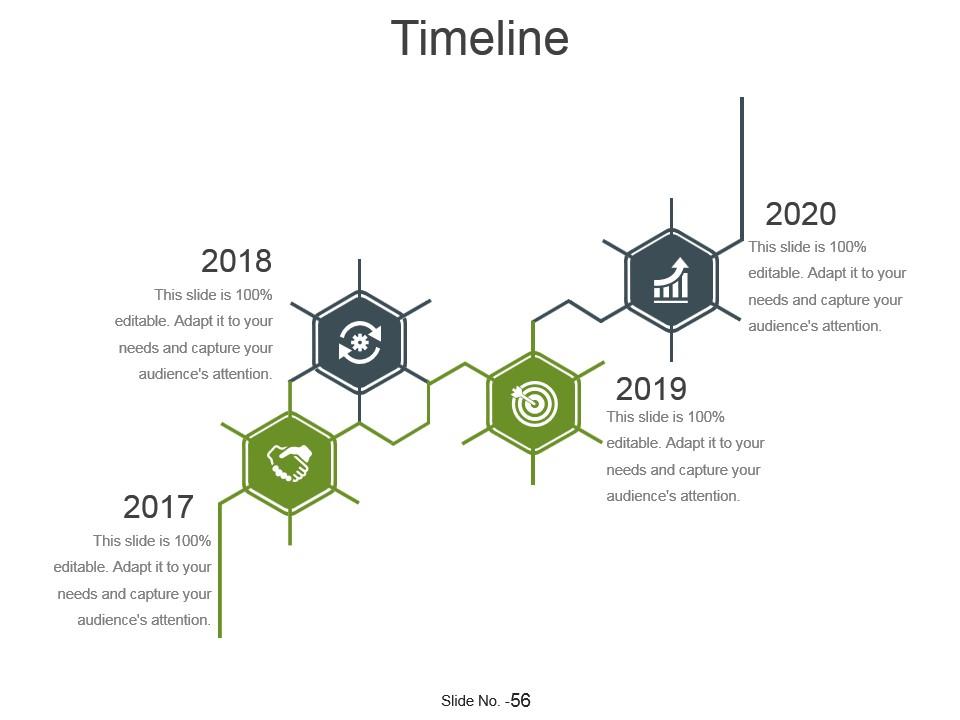
Slide 56: This is a Timelines slide to show- Plan, Budget, Schedule, Review.
Slide 57: This slide displays notes on Challenge, Positive Attitude, Balanced Lifestyle.
Slide 58: This is a Newspaper slide to highlight something or add memeorabilia.
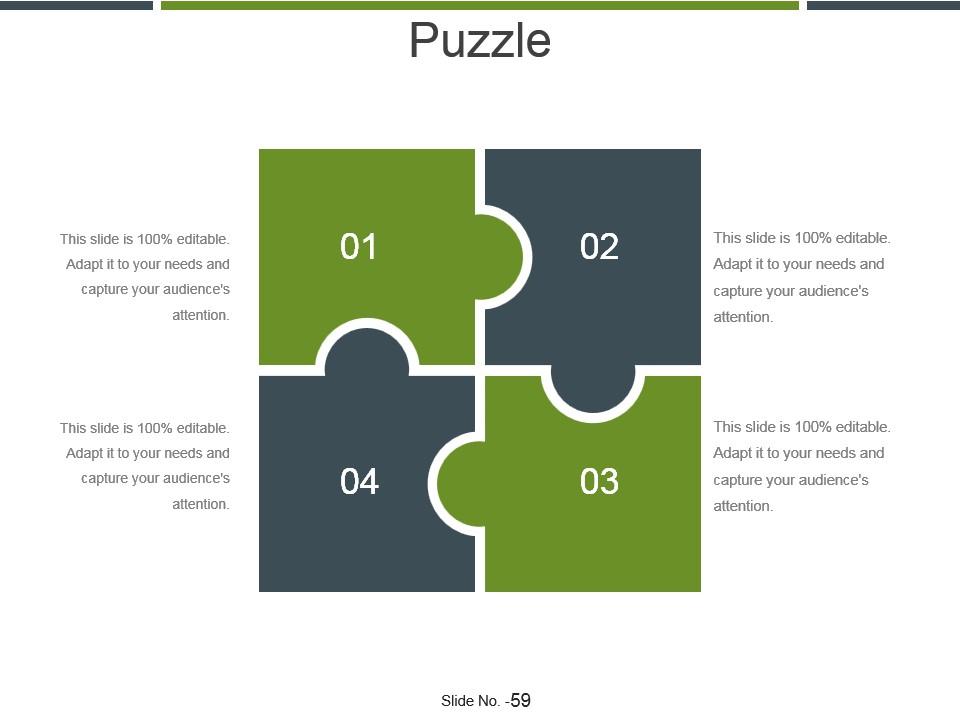
Slide 59: This slide presents a PUZZLE slide with the following subheadings- Integrity and Judgment, Critical and Decision Making, Leadership, Agility.
Slide 60: This is a Target slide. State your targets here.
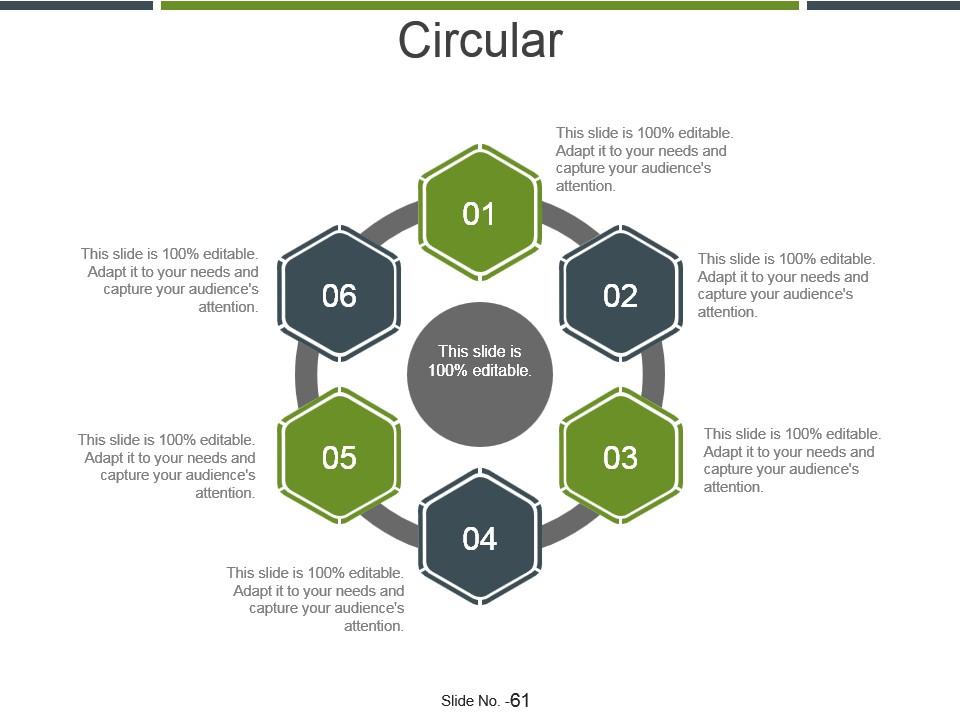
Slide 61: This is a Circular slide to show information, specification etc.
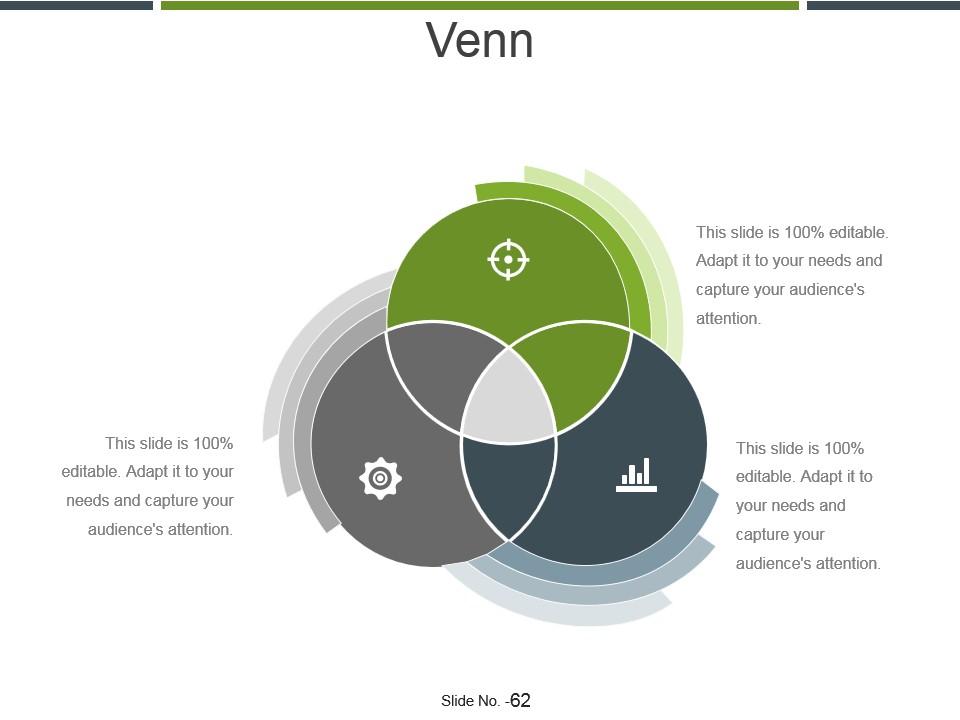
Slide 62: This is a Venn diagram image slide to show information, specifications etc.
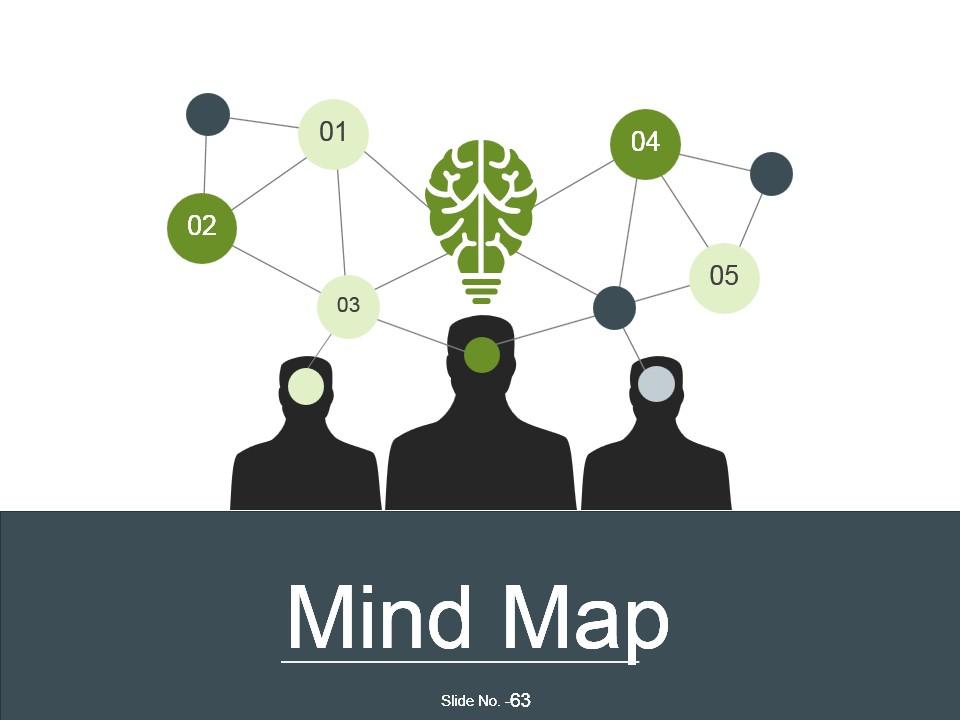
Slide 63: This slide shows a Mind map for representing entities.
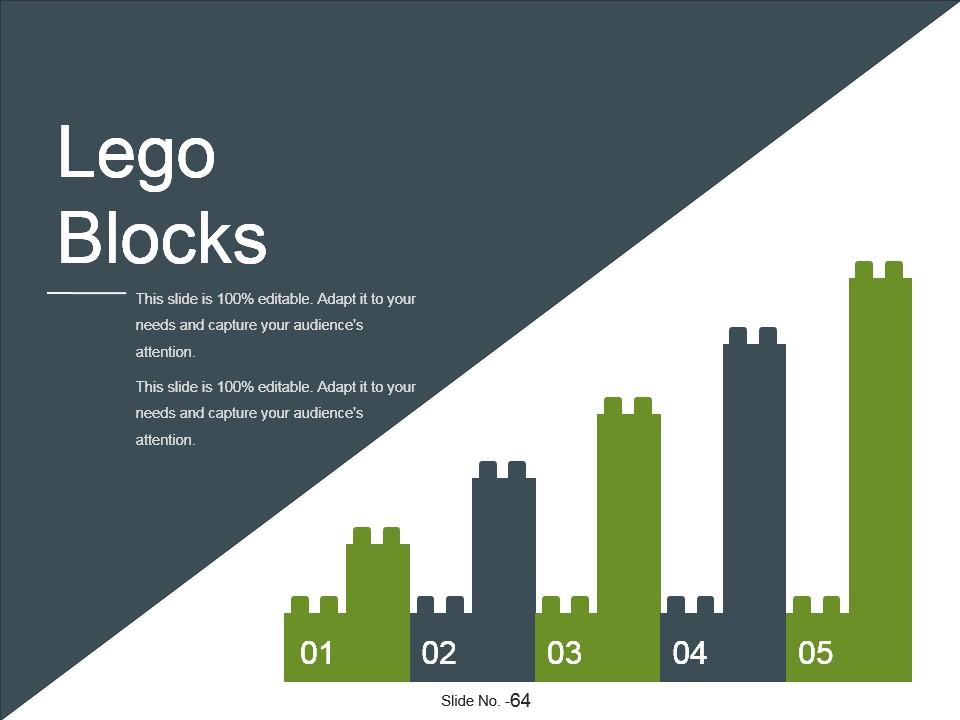
Slide 64: This is a LEGO slide with text boxes to show information.
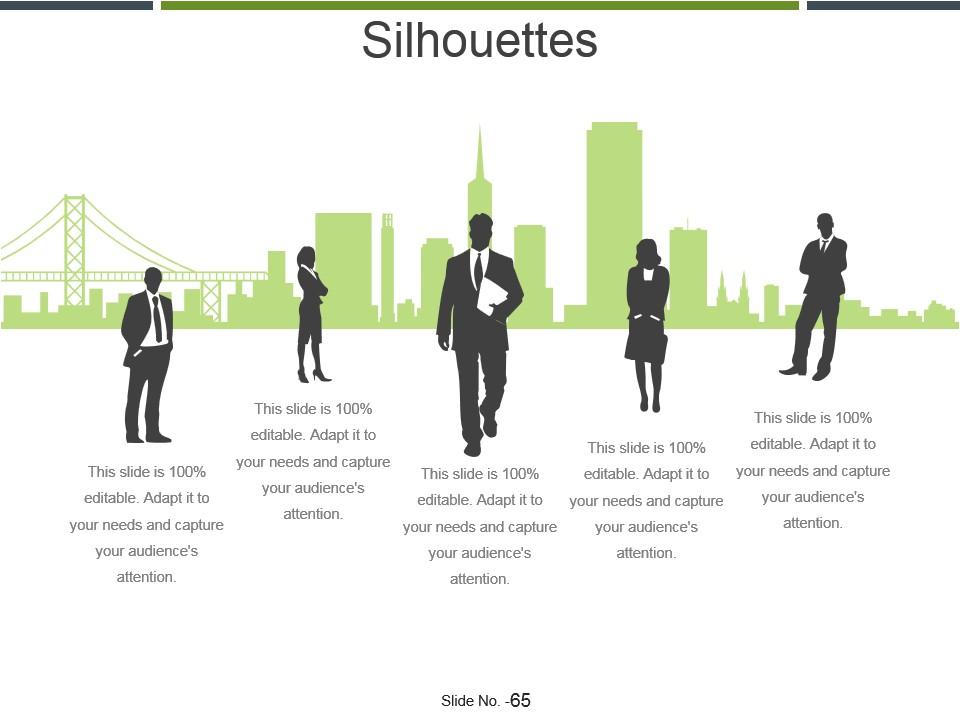
Slide 65: This is a People's silhouettes slide. Use it the way you want to show solutions etc.
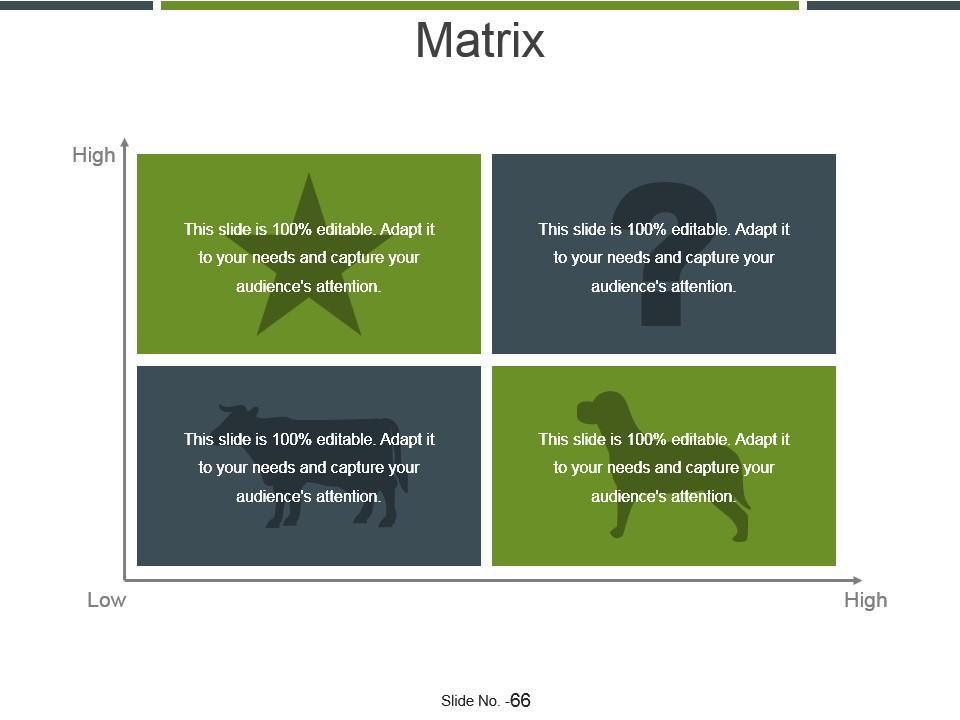
Slide 66: This slide presents a Customer Growth Matrix with- Grow Market share, Market Expansion, Customer Retention, Cross Selling in terms of CUSTOMERS & PRODUCTS.
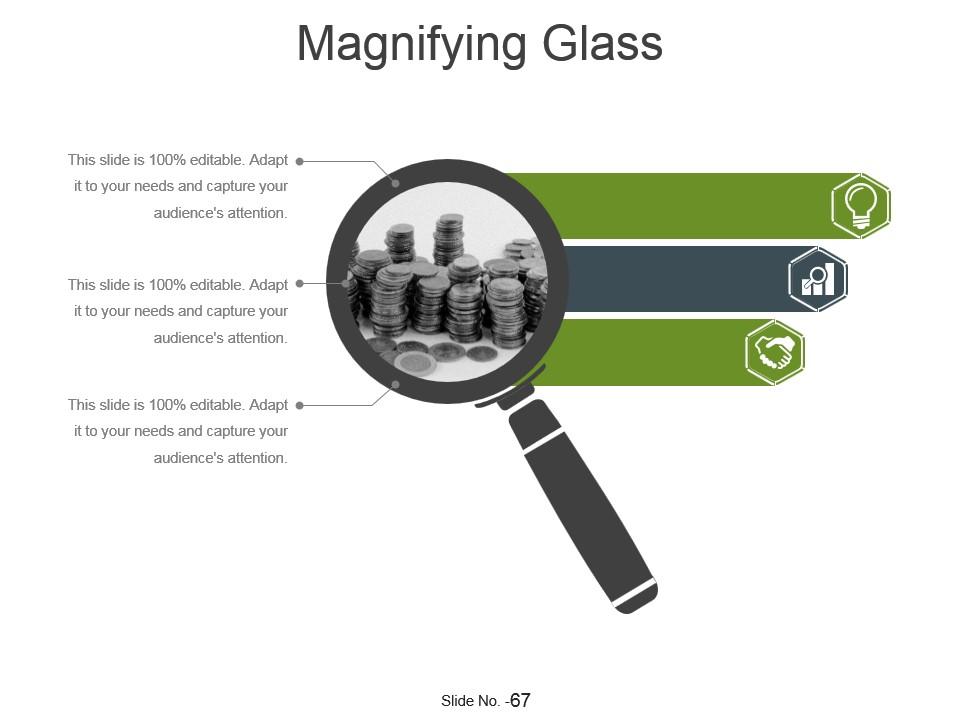
Slide 67: This is a Magnifying glass image slide to show information, specification etc.
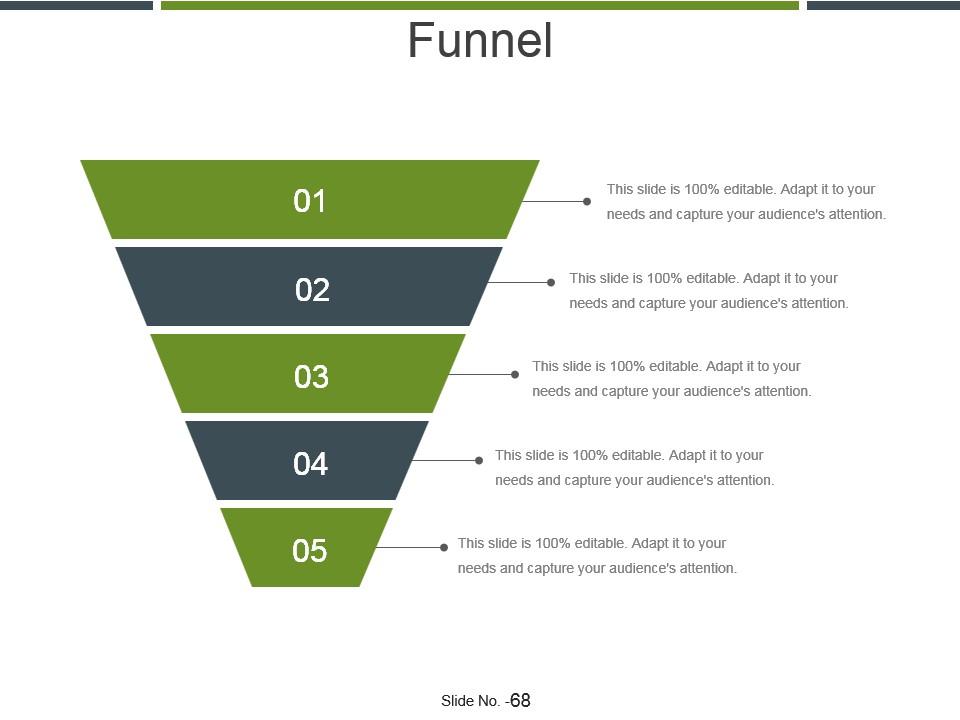
Slide 68: This is a Funnel image slide showing: Calls-to-action, Reachability, User Experience, Color Schemes, Engagement, Simplicity.
Slide 69: This slide displays the title Charts & Graphs.
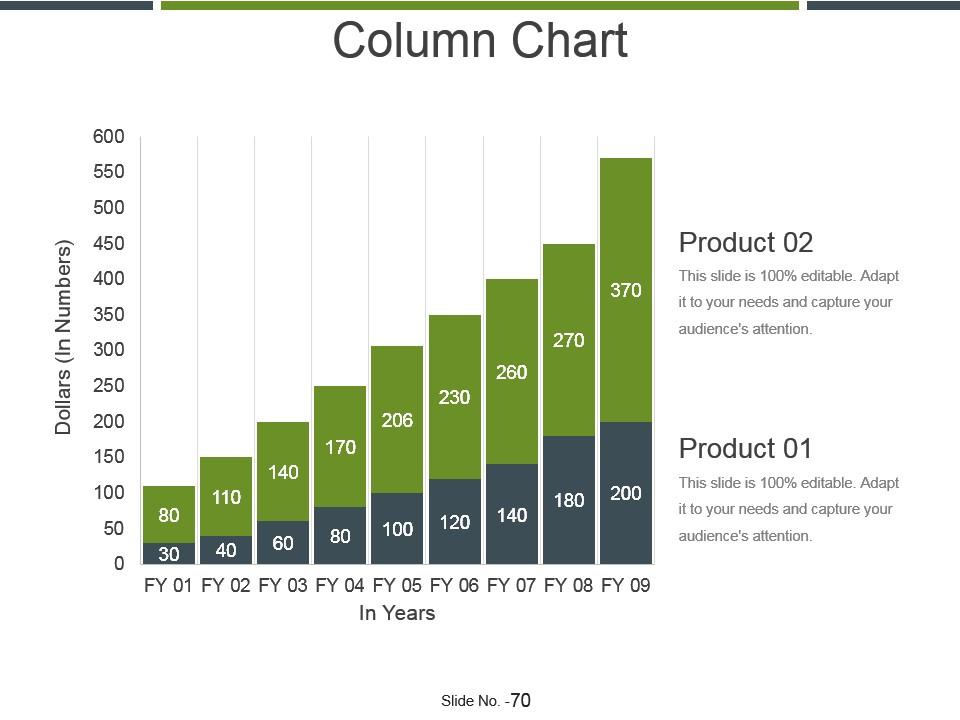
Slide 70: This slide shows a Line Chart for two product comparison.
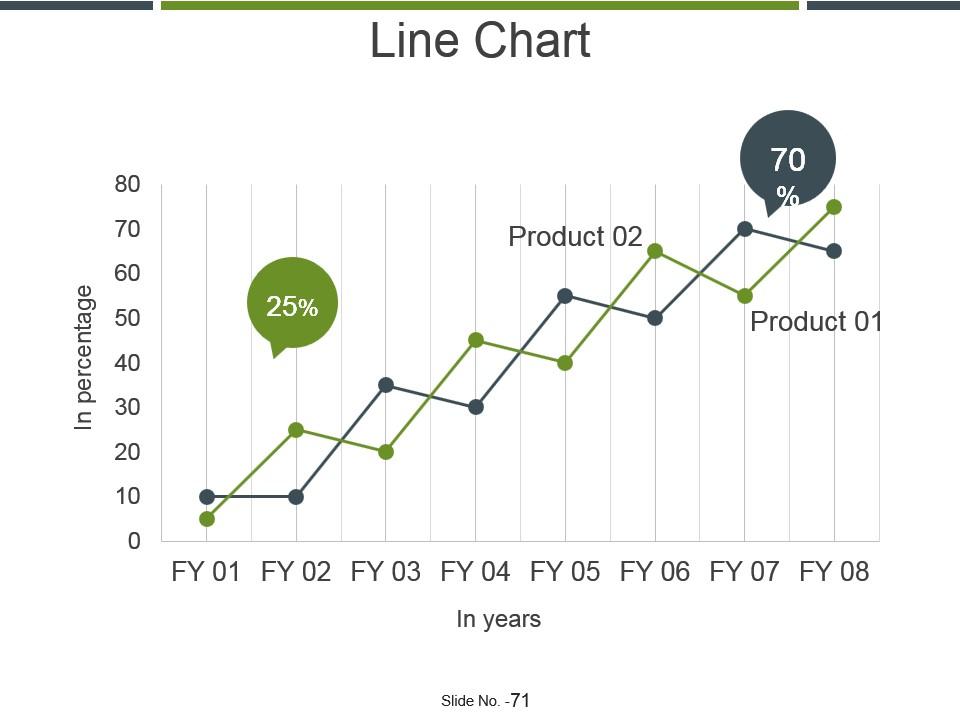
Slide 71: This slide contains a Line Chart. Product 01Product 02 can be shown in comparison.
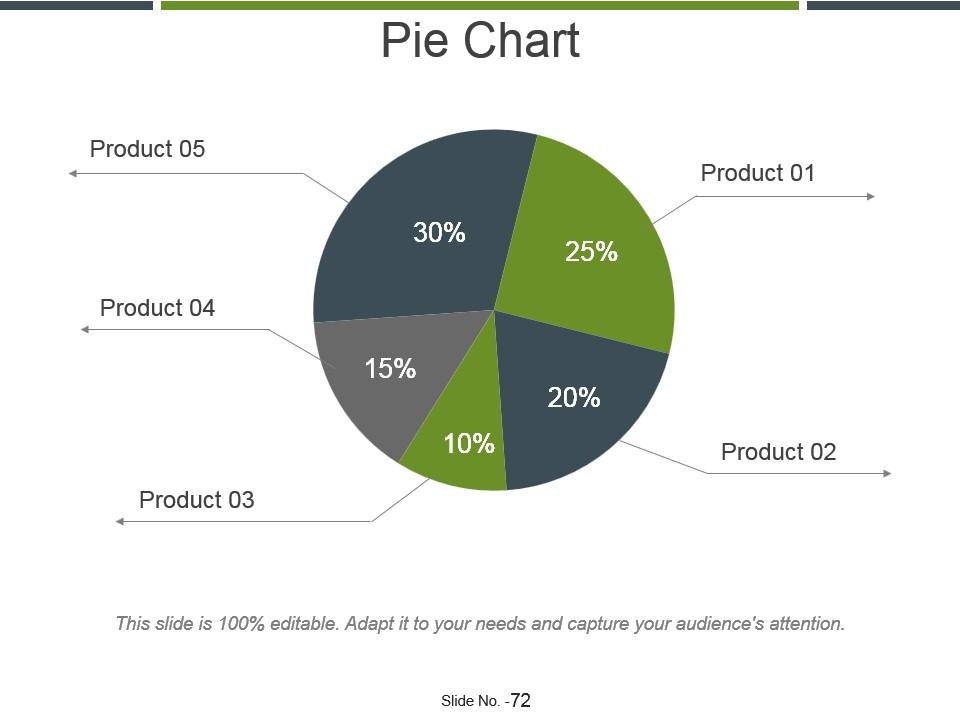
Slide 72: This slide showcases Pie Chart for the comparison of the five products.
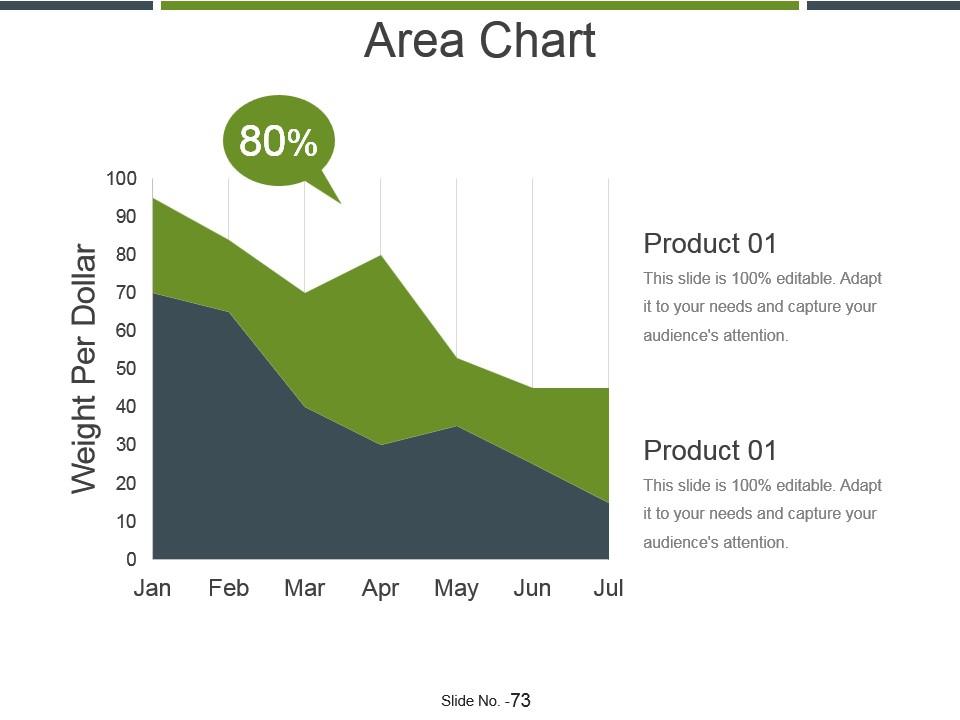
Slide 73: This slide presents Area Chart for the comparison of the two of the products.
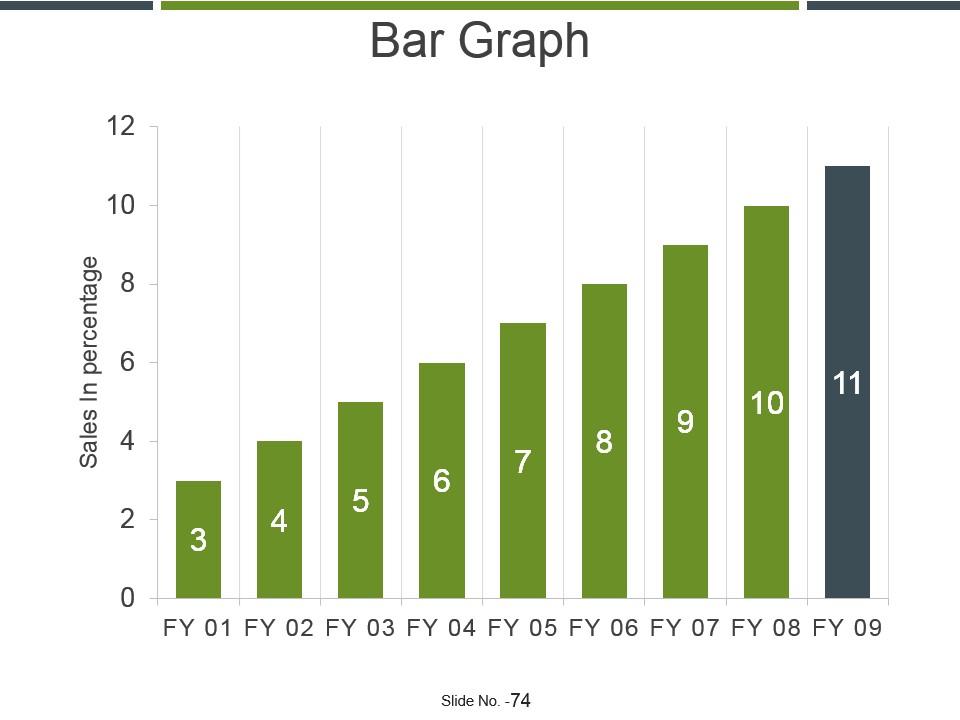
Slide 74: This slide presents a Bar graph in arrow form with text boxes.
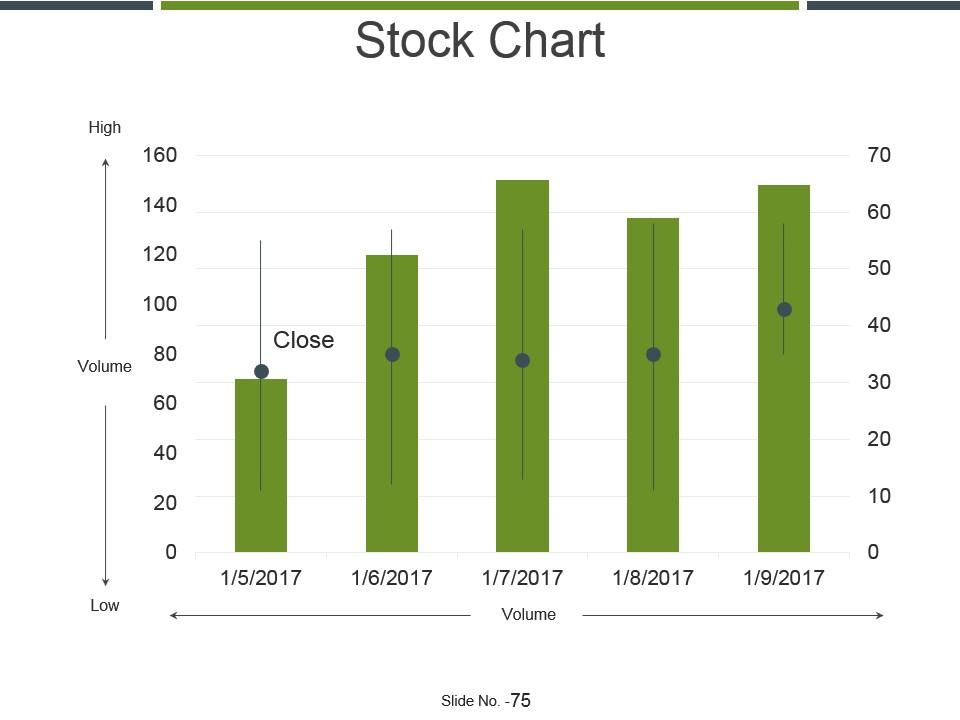
Slide 75: This slide displays a Stock Chart with volume as parameter in terms of high and low, open and close.
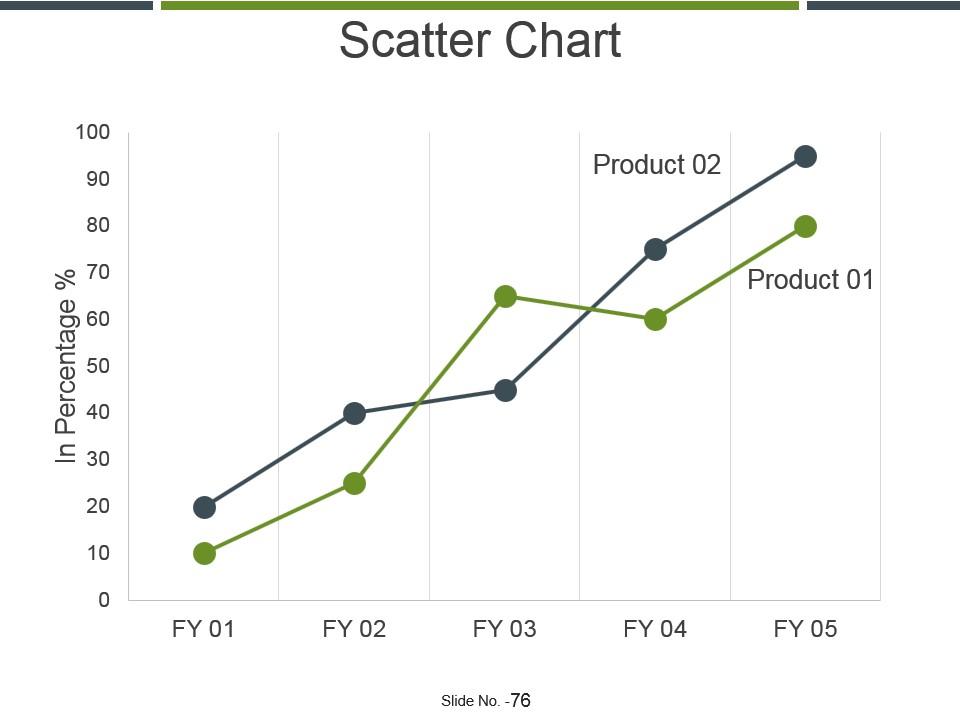
Slide 76: This slide shows a sactter Chart for two product comparison.
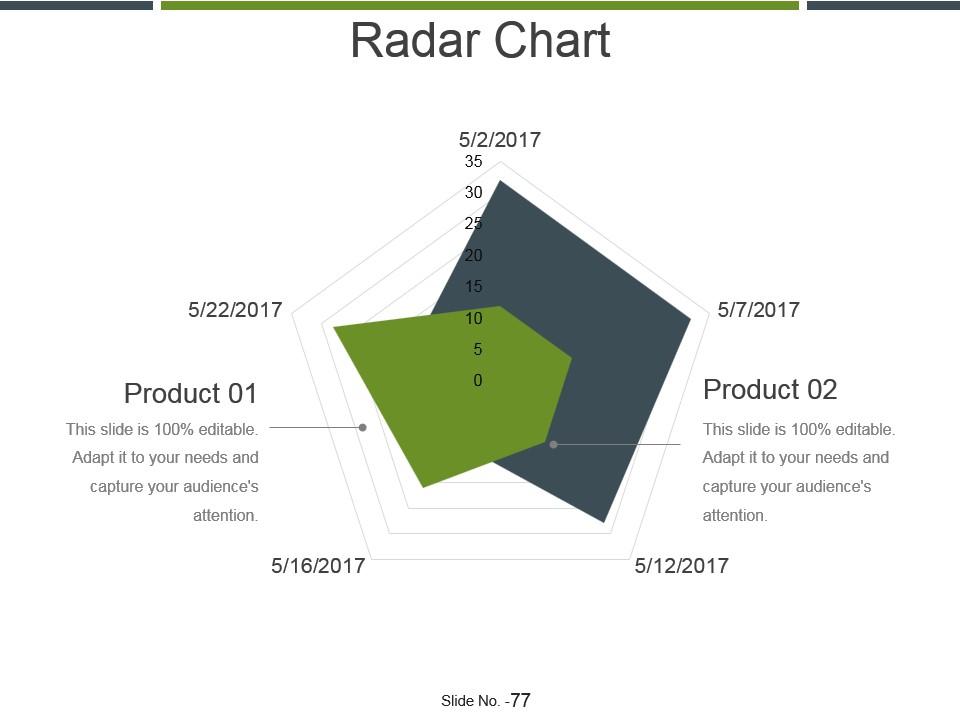
Slide 77: This slide shows a Radar Chart for two product comparison.
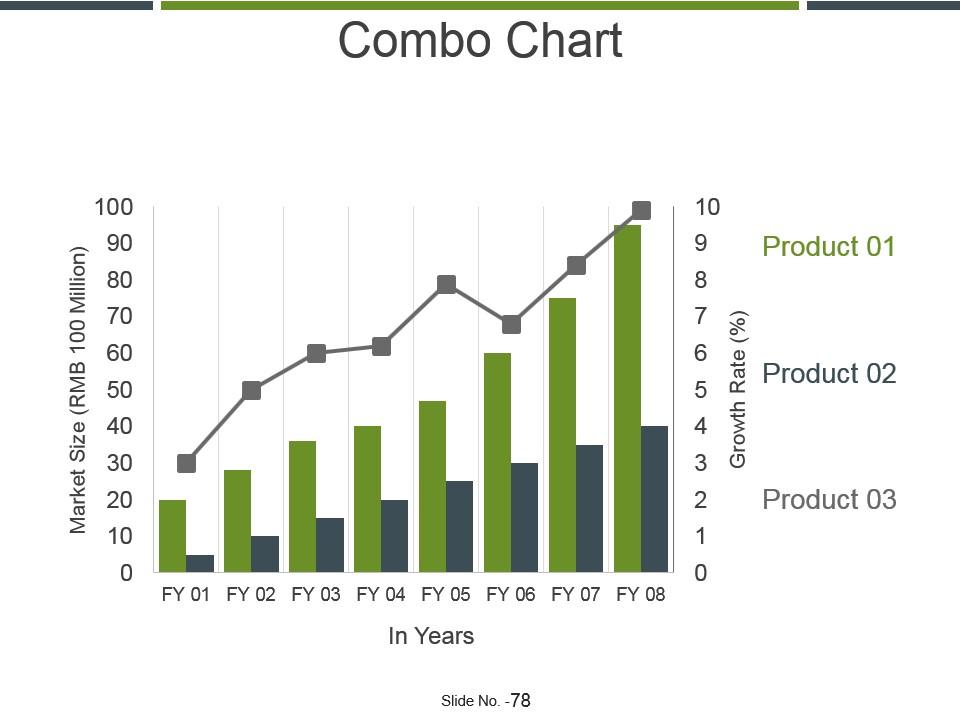
Slide 78: This slide shows a Combo Chart for two product comparison
Slide 79: This is a Thank You image slide with Address, Email and Contact number.
Investor personality profile powerpoint presentation slides with all 79 slides:
Carry out in depth investigation of individual inputs with our Investor Personality Profile Powerpoint Presentation Slides. You will avoid errors of judgement.
-
Much better than the original! Thanks for the quick turnaround.
-
Qualitative and comprehensive slides.


