Property development process flowchart powerpoint presentation slides
Want to demonstrate your property expansion process to potential investors? SlideTeam provides you predesigned and content ready property development process flowchart PowerPoint presentation slides for reference. Our complete presentation slides are the perfect combination of expert subject matter and fabulous designs. This real estate expansion PPT presentation covers wide range of topics like a market snapshot, executive summary, market activity, asset trends and demand, opportunities, market summary, mortgage loan, buying and selling land, short sale, investment, leaseholder etc. You can use the same landmark development PowerPoint graphics for topics like real estate development process, land expansion, housing development, real estate & property development flow chart etc. Clinch your business deal with our property development process flowchart PowerPoint presentation templates. Download our stunning PowerPoint presentations that will win over the clients and the audience!. Acquaint the forum with the current circumstances with our Property Development Process Flowchart Powerpoint Presentation Slides. Give them the information they ask for.
Want to demonstrate your property expansion process to potential investors? SlideTeam provides you predesigned and content ..
- Google Slides is a new FREE Presentation software from Google.
- All our content is 100% compatible with Google Slides.
- Just download our designs, and upload them to Google Slides and they will work automatically.
- Amaze your audience with SlideTeam and Google Slides.
-
Want Changes to This PPT Slide? Check out our Presentation Design Services
- WideScreen Aspect ratio is becoming a very popular format. When you download this product, the downloaded ZIP will contain this product in both standard and widescreen format.
-

- Some older products that we have may only be in standard format, but they can easily be converted to widescreen.
- To do this, please open the SlideTeam product in Powerpoint, and go to
- Design ( On the top bar) -> Page Setup -> and select "On-screen Show (16:9)” in the drop down for "Slides Sized for".
- The slide or theme will change to widescreen, and all graphics will adjust automatically. You can similarly convert our content to any other desired screen aspect ratio.
Compatible With Google Slides

Get This In WideScreen
You must be logged in to download this presentation.
PowerPoint presentation slides
The presentation has 58 slides. PowerPoint templates are 100% editable in PowerPoint. Pixels do not blur in standard as well as in widescreen. 100% risk-free downloads. This Presentation is mainly used by the real estate developer, property dealer etc. PPT templates are compatible with Google slides. Premium support for clients. This is a one stage process. The stages in this process are property development process flowchart, property, mortgage loan, buying and selling land, short sale, investment, leaseholder.
Content of this Powerpoint Presentation
Slide 1: This slide introduces Property Development Process Flowchart. State your company name and begin.
Slide 2: This slide presents Table Of Contents. You can add your content in table.
Slide 3: This slide displays Agenda. You can add your agenda in these boxes.
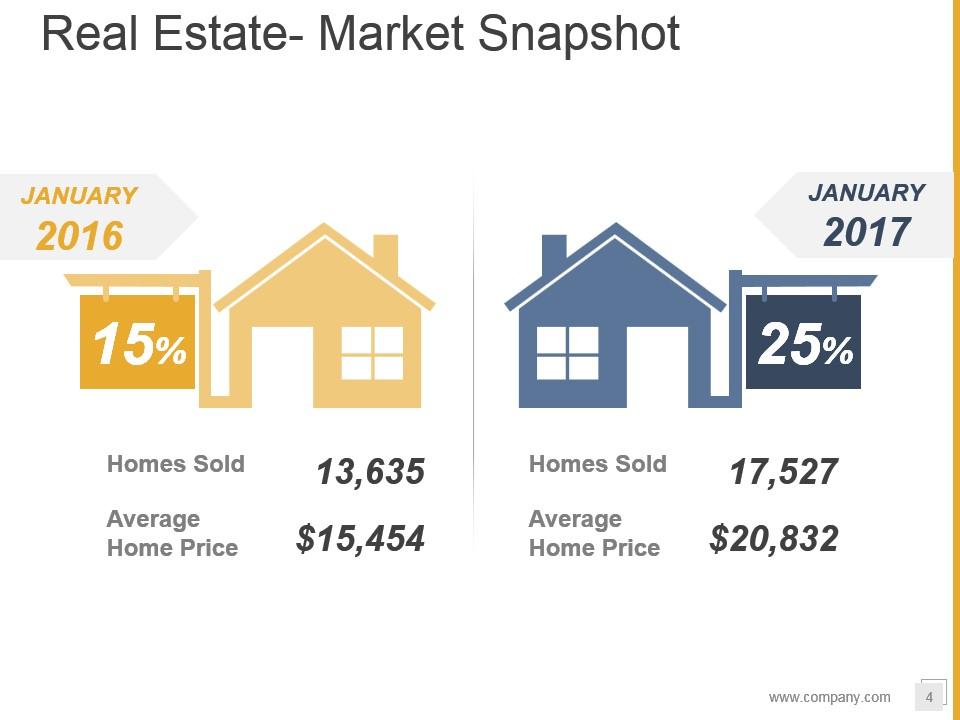
Slide 4: This slide presents Real Estate- Market Snapshot that also includes Average Home Price and Homes Sold.
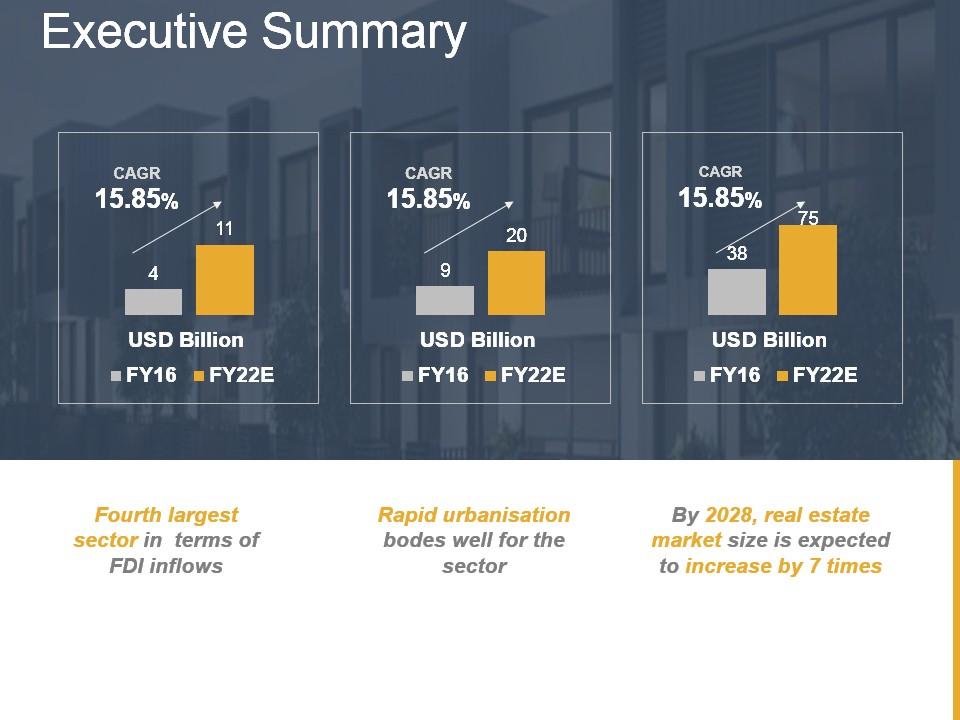
Slide 5: This slide shows Executive Summary that also includes three financial year which you can use for executive summary.
Slide 6: This slide shows How Big Is REAL ESTATE Market . You can add Annual Property Transactions Volume
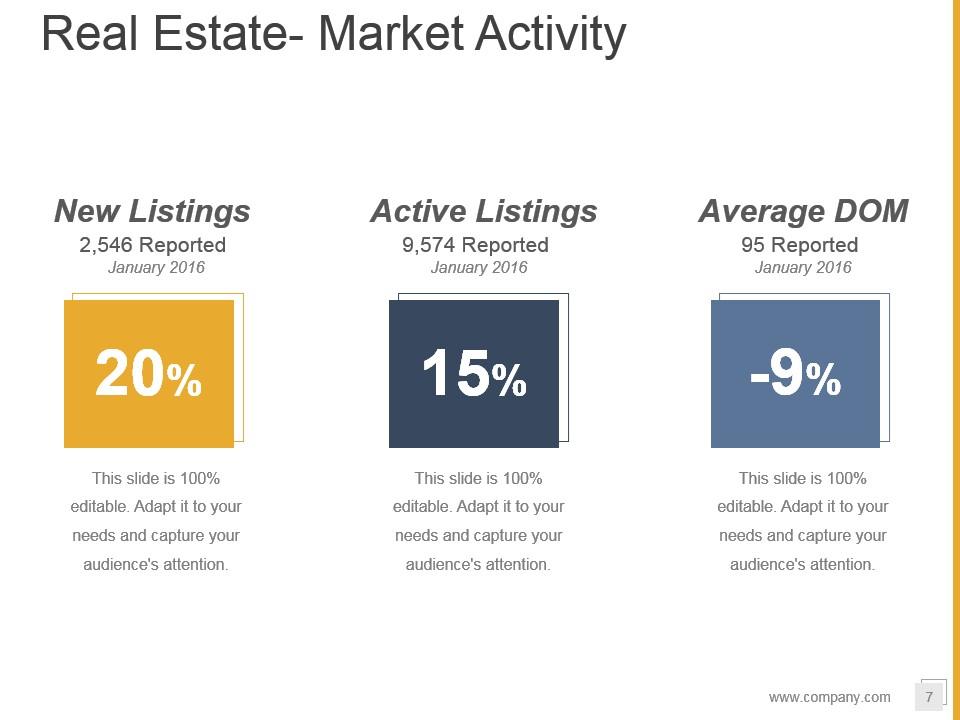
Slide 7: This slide showcases Real Estate- Market Activity. With this you can also add your New Listings, Active Listings, Average DOM.
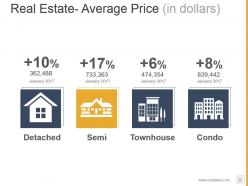
Slide 8: This slide shows Real Estate- Average Price. This also includes- Detached, Semi, Townhouse, Condo.
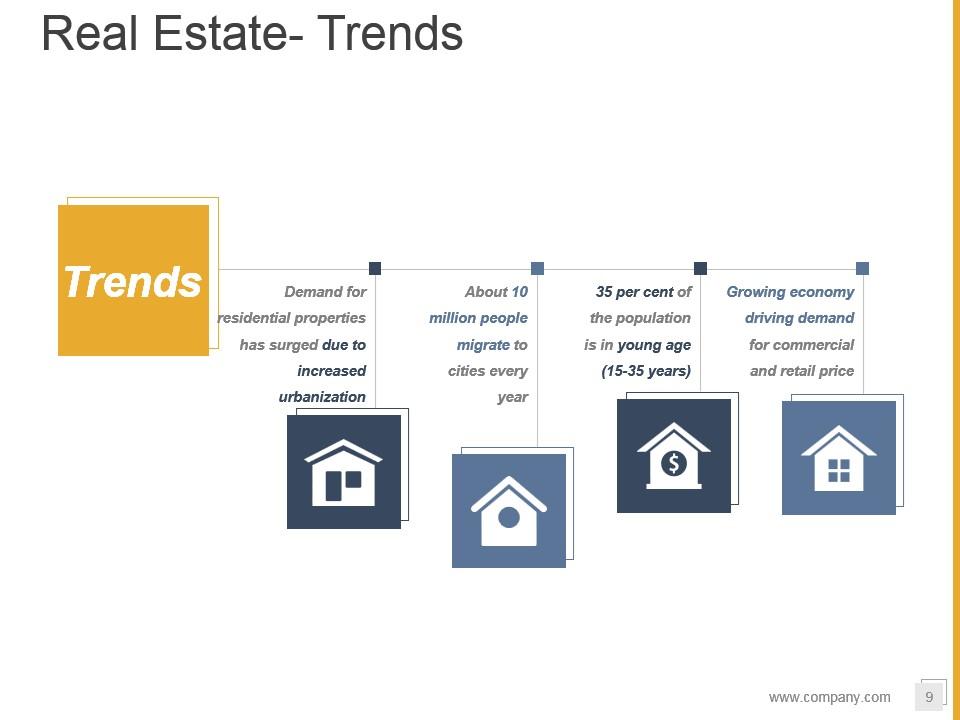
Slide 9: This slide showcases Real Estate- Trends. You can add your Trends accordingly as per your requirement.
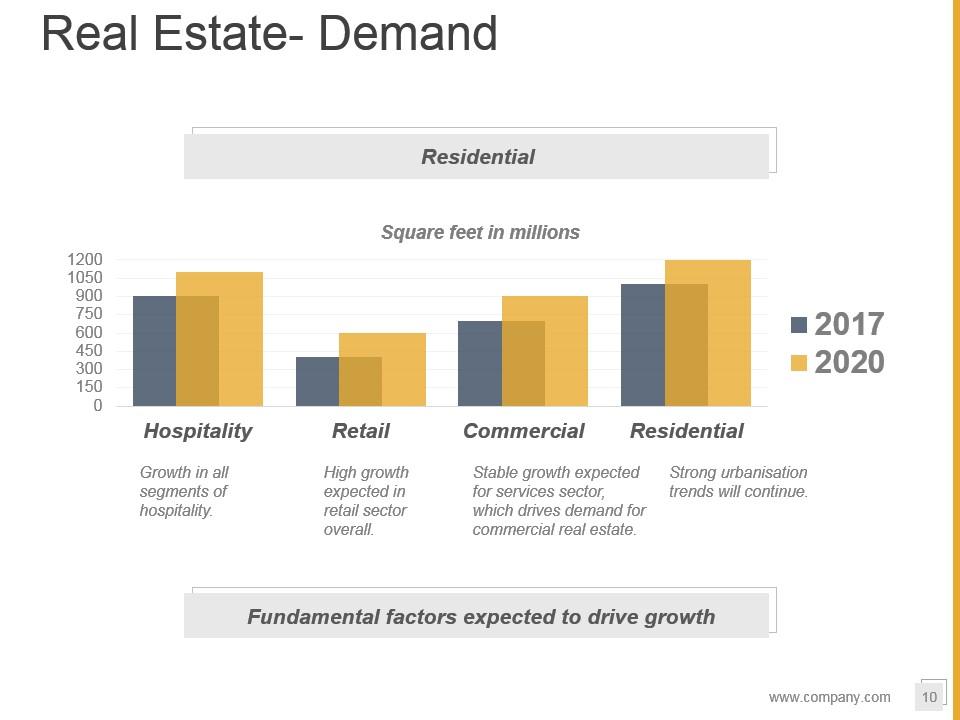
Slide 10: This slide showcases Real Estate- Demand. You can compare in this for two years and can use it for hospitality, retail, commercial, residential.
Slide 11: This slide presents Real Estate Opportunities. You can add your opportunities as per your requirement.
Slide 12: This slide shows Real Estate Major Investments. State major investment here.
Slide 13: This slide showcases Real Estate Policy Support. You can add as per your requirement.
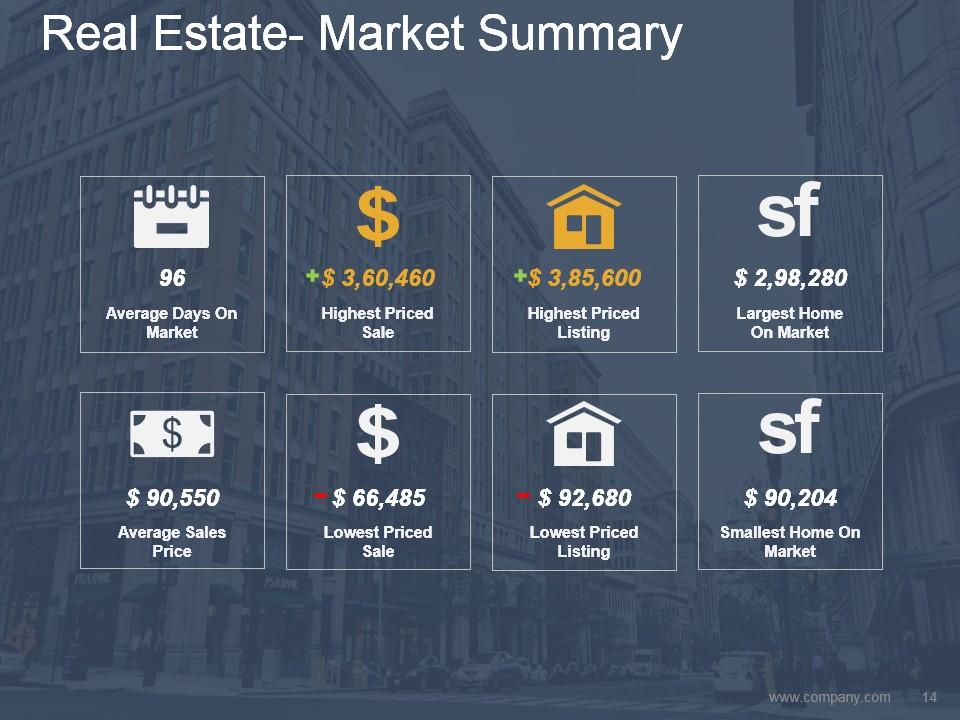
Slide 14: This slide presents Real Estate- Market Summary and you can add your summary by using this- Highest Priced Sale, Highest Priced Listing, Average Sales Price, Smallest Home On Market, Average Days On Market, Largest Home On Market, Lowest Priced Sale, Lowest Priced Listing.
Slide 15: This slide shows Real Estate Market Analysis Infographic with a background image.
Slide 16: This slide shows up Real Estate Market Outlook and you can utilises to add on your requirement.
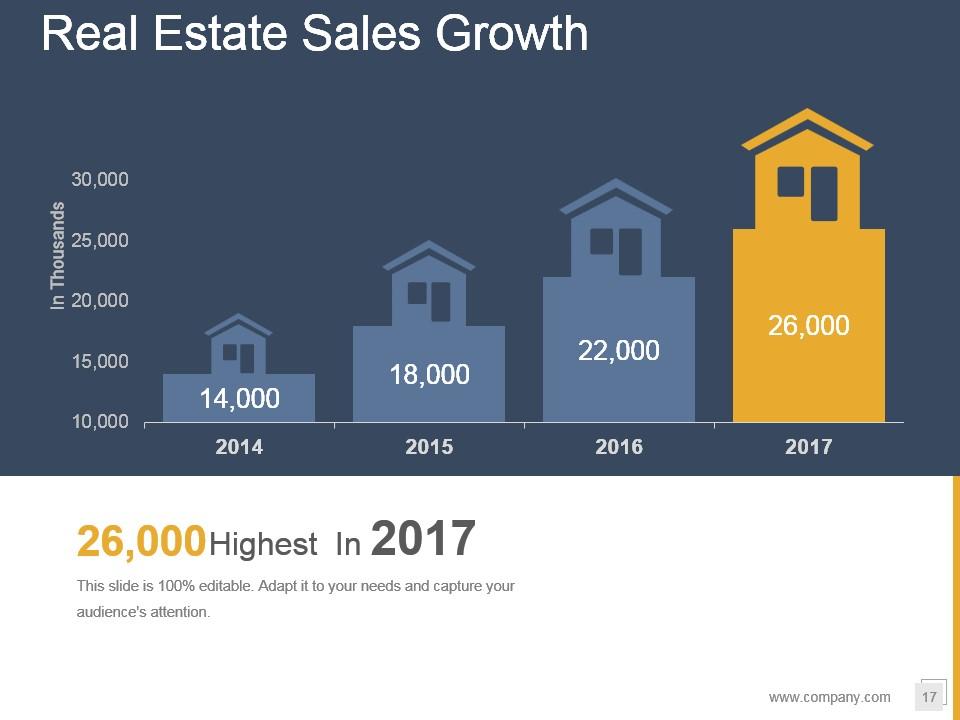
Slide 17: This slide showcases real estate sales growth with four four years of growth.
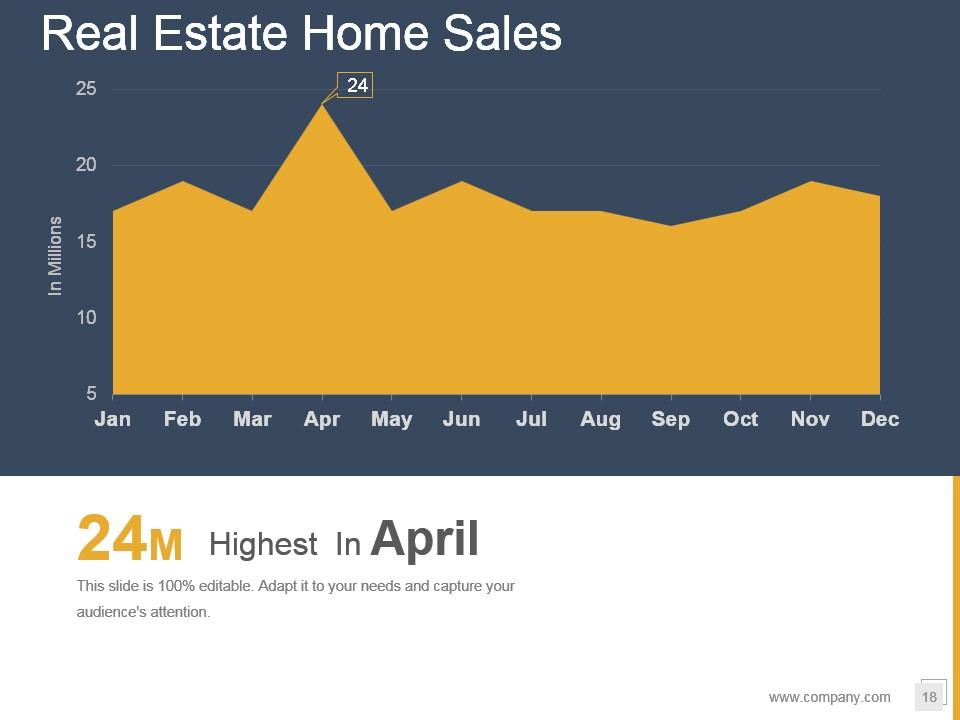
Slide 18: This slide displays Real Estate Sales Growth chart showing with respect to months.
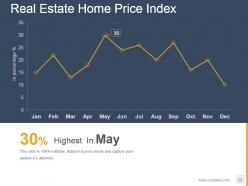
Slide 19: This slide displays Real Estate Home Price Index line chart. You can use for your price index showcase.
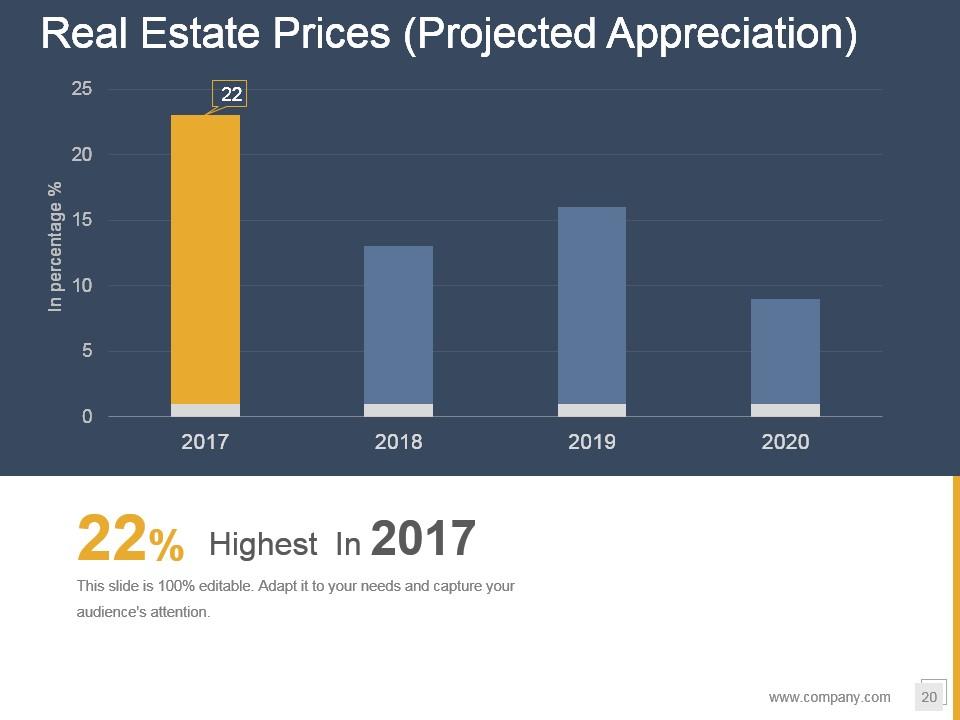
Slide 20: This slide showcase Real Estate Prices . You can project your prices with different financial year.
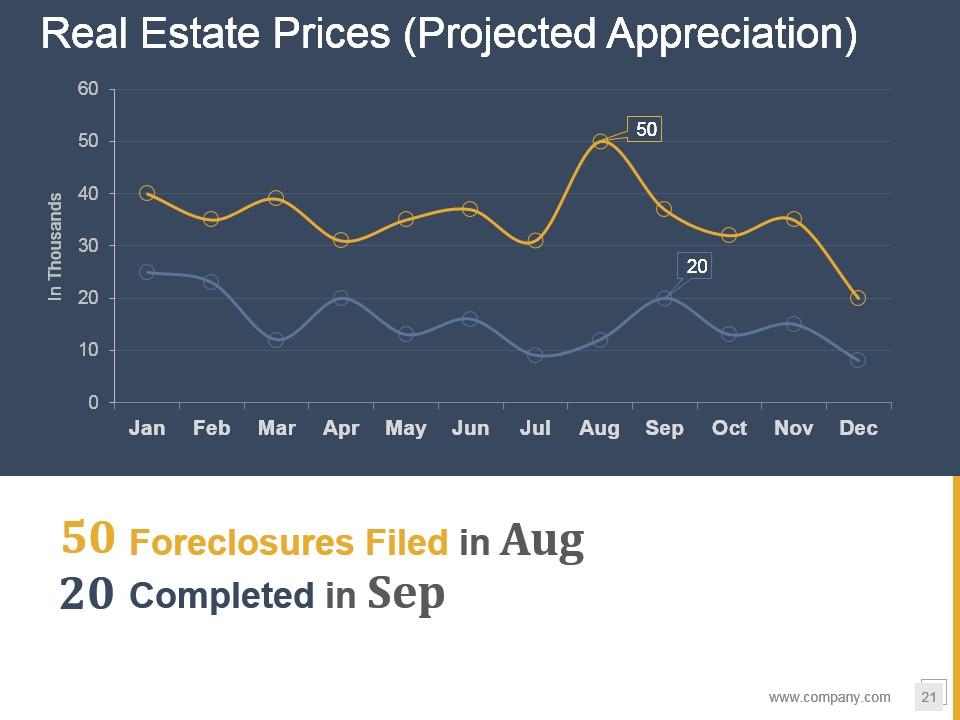
Slide 21: This slide Real Estate Foreclosures Filed VS Completed line chart. You can add as per your requirement.
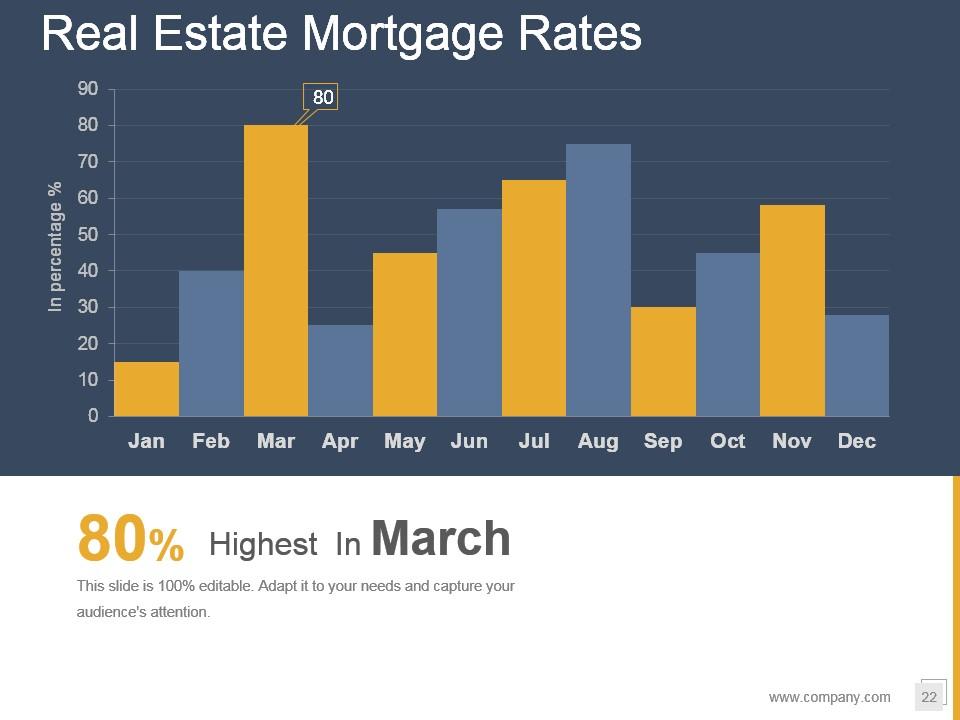
Slide 22: This slide shows Real Estate Mortgage Rates. You can create your own rate chart by using our editable slide.
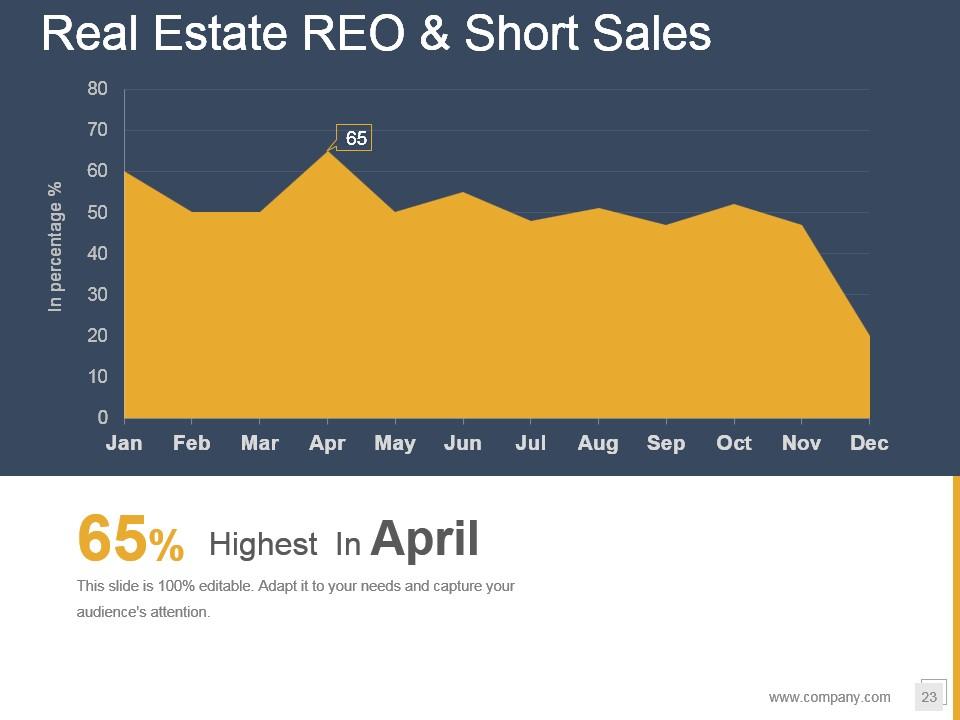
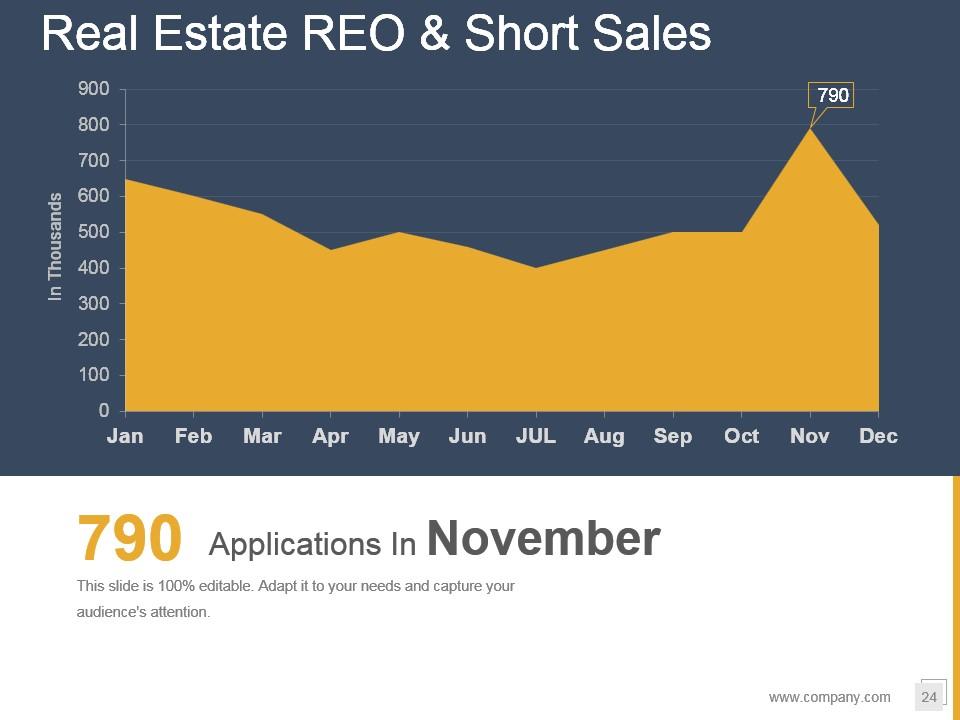
Slide 23: This slide showcase Real Estate REO & Short Sales line chart. You can add your sales data and make the best use of it.
Slide 24: This slide presents Real Estate New Home Loan Applications. You can modify and make it usable for you.
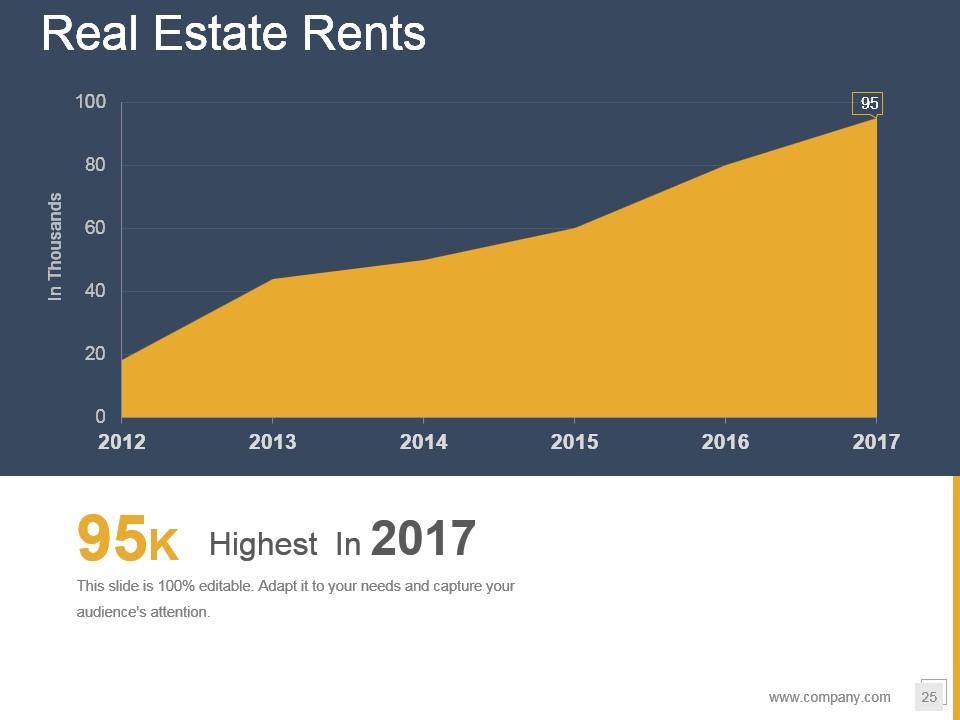
Slide 25: This slide displays Real Estate Rents graph. You can add your data or information as per your requirement.
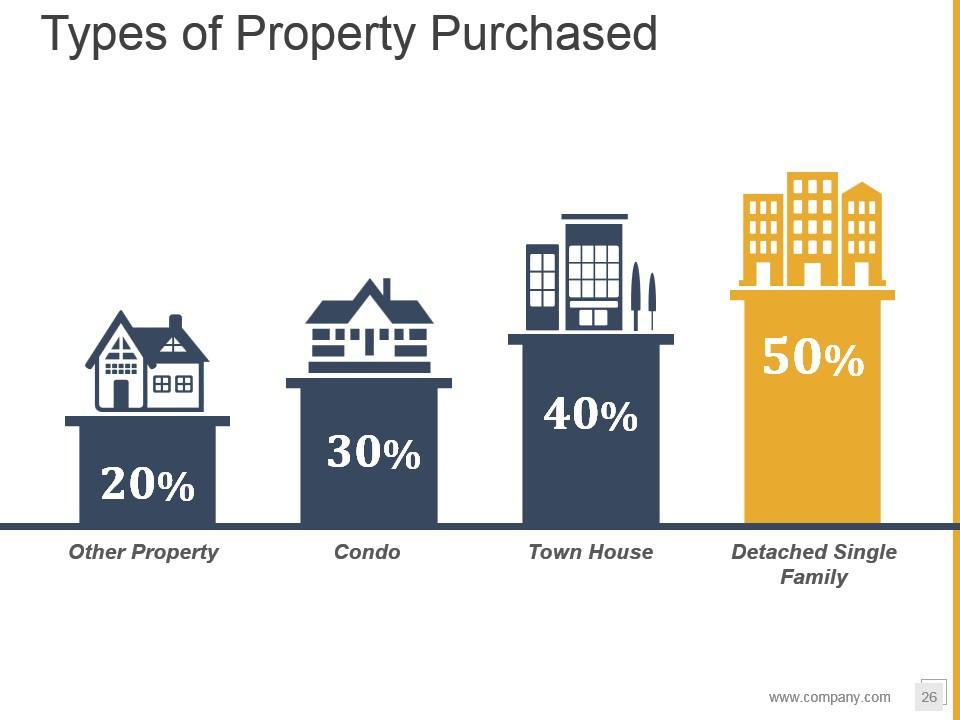
Slide 26: This slide is Types of Property Purchased and compare these properties like- Condo, Town House, Detached Single Family, Other Property.
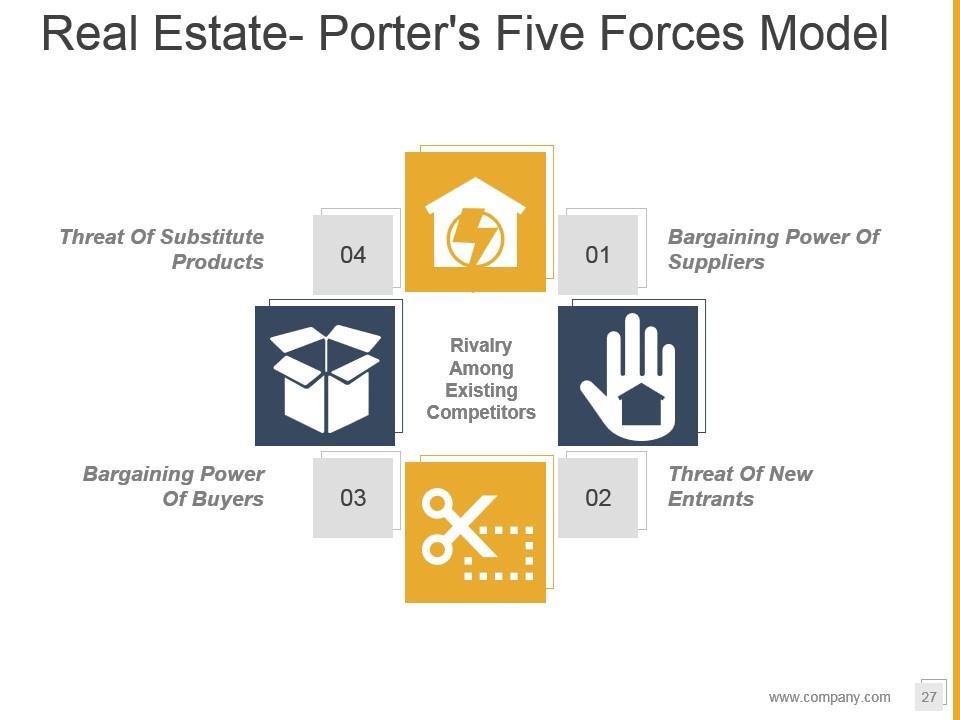
Slide 27: This slide showcases Real Estate- Porter's Five Forces Model which includes- Threat Of New Entrants, Bargaining Power Of Buyers, Bargaining Power Of Suppliers, Threat Of Substitute Products, Rivalry Among Existing Competitors.
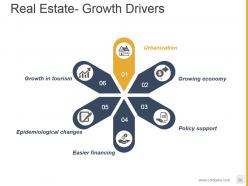
Slide 28: This slide shows Real Estate- Growth Drivers with six drivers as follows- Growth in tourism, Epidemiological changes, Easier financing, Policy support, Growing economy, Urbanization.
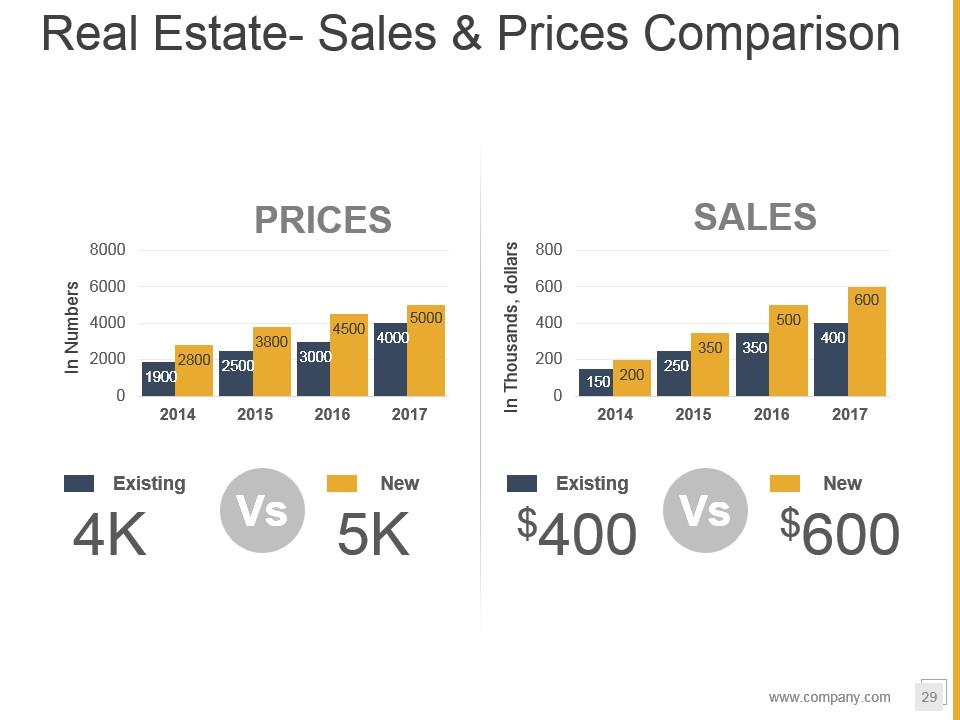
Slide 29: This slide showcase Real Estate- Sales & Prices Comparison. You can show your comparision between sales and prices.
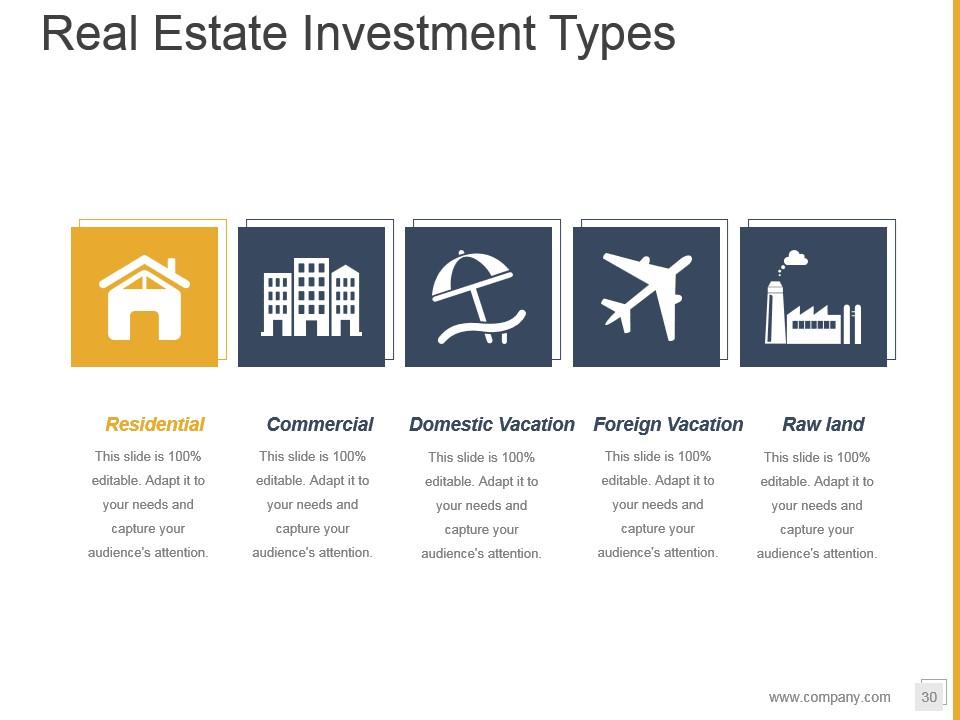
Slide 30: This slide shows Real Estate Investment Types And these are as follows- Residential, Commercial, Domestic Vacation, Foreign Vacation, Raw land. You can add your data and make it usable for you.
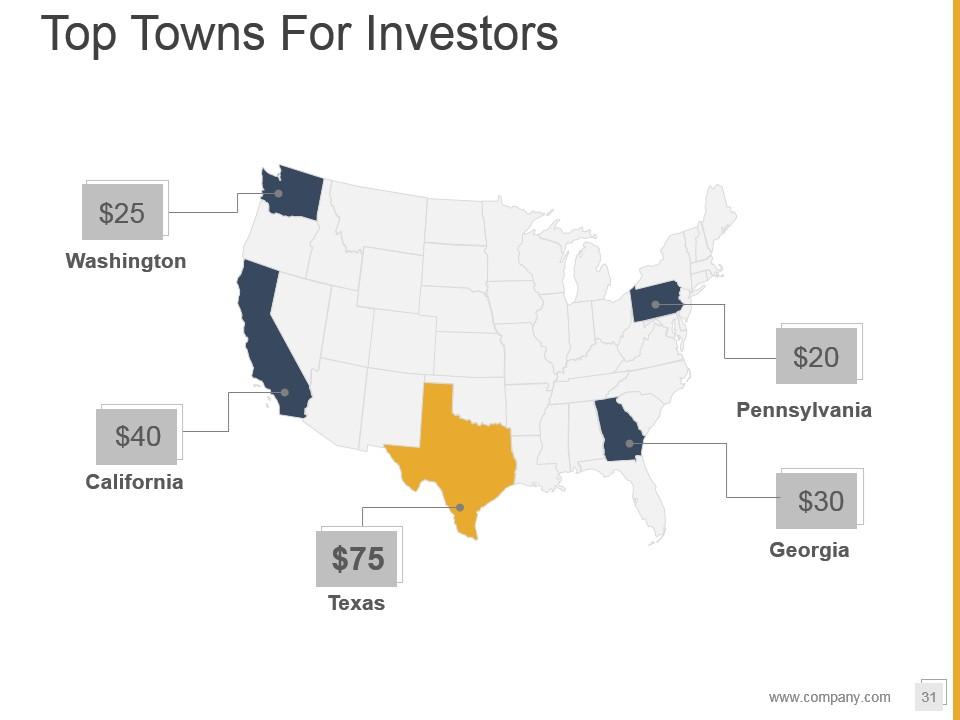
Slide 31: This slide presents Top Towns For Investors showing globally. You can use it for your business requirements.
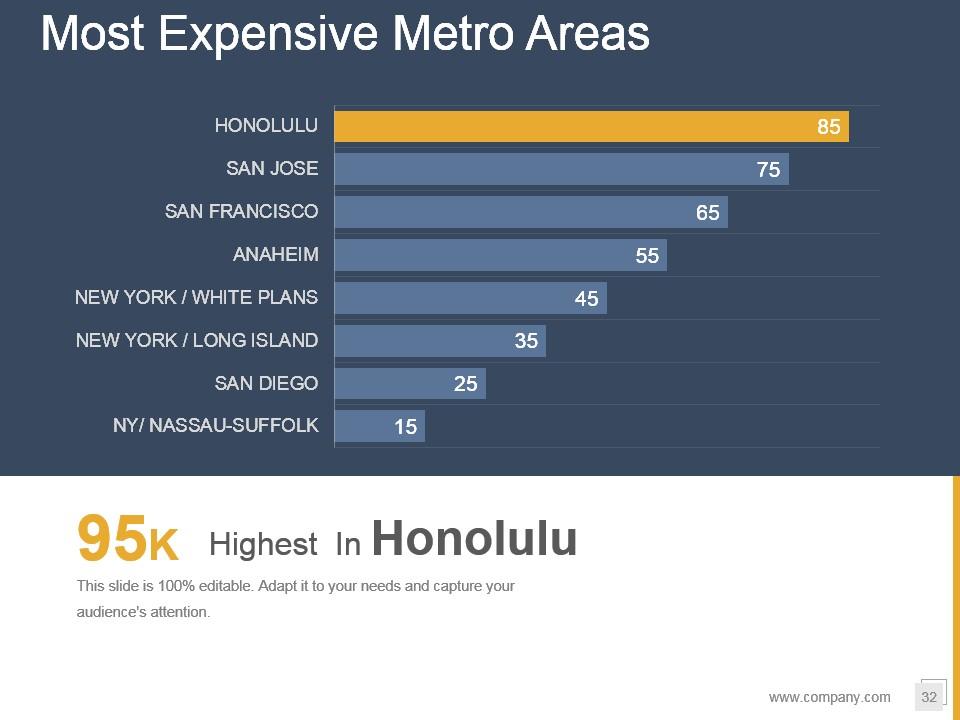
Slide 32: This slide showcase Most Expensive Metro Areas showing a bar chart with various companies.
Slide 33: This slide represent Real Estate Infographic Layout. You can make it usable as per your requirement.
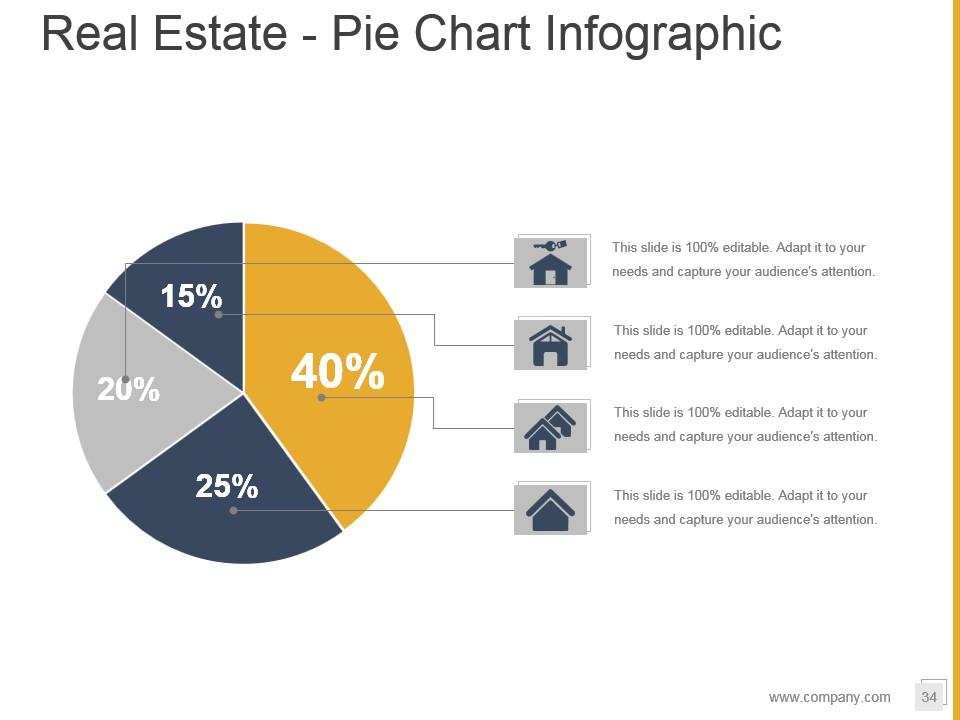
Slide 34: This slide shows Real Estate - Pie Chart Infographic. You can use according to your need.
Slide 35: This slide showcase Estate Icon Set. Use as per your need.
Slide 36: This slide is titled Additional Slides to move forward.
Slide 37: This is Our Mission slide with Vision, Mission, Goal and respective imagery.
Slide 38: This is Meet Our team slide with backgraound image.
Slide 39: This is an About Us showing Values Client, Preferred By Many and Target Audiences.
Slide 40: This is an Our Goal slide. State your goals here.
Slide 41: This slide showcase Financial comparison. You can add and compare your company growth.
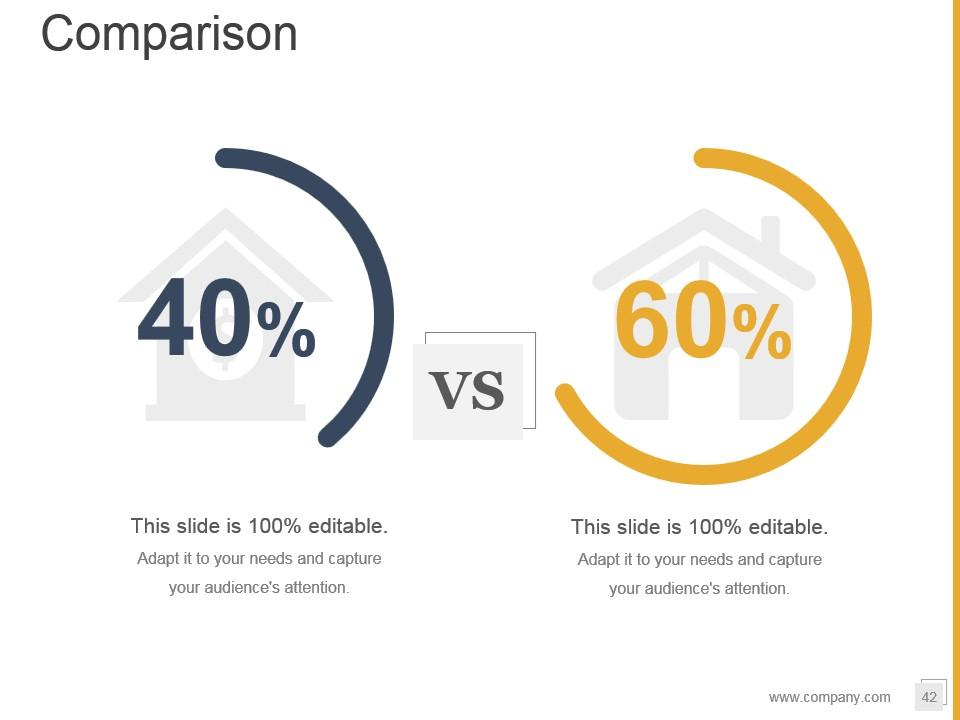
Slide 42: This slide displays Comparison with percentage.
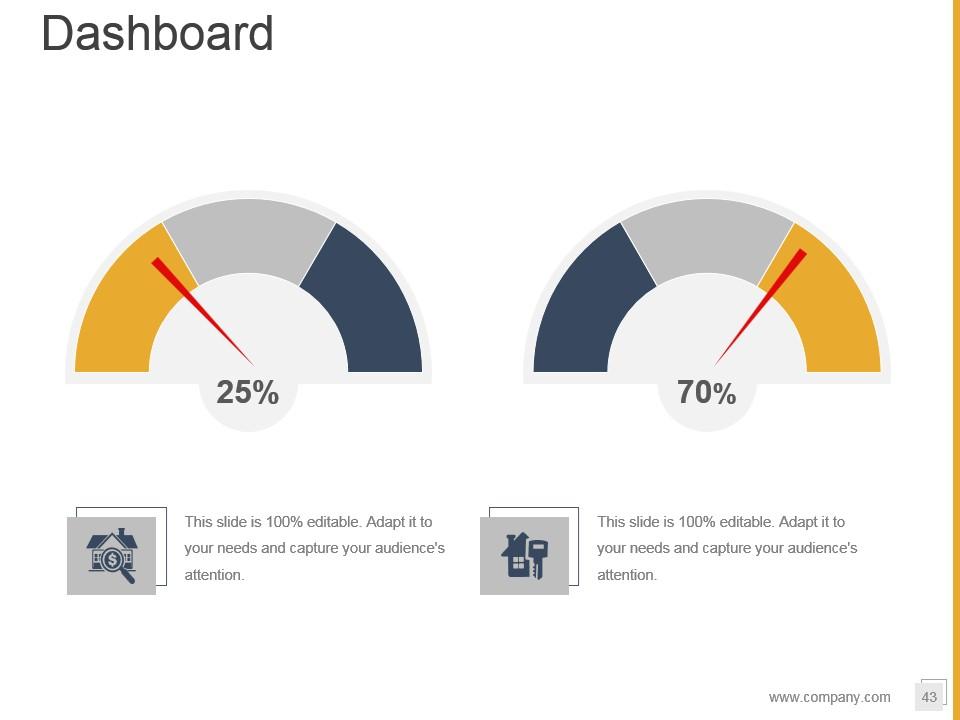
Slide 43: This slide Dashboard with comparison of two. You can modify and make it usable.
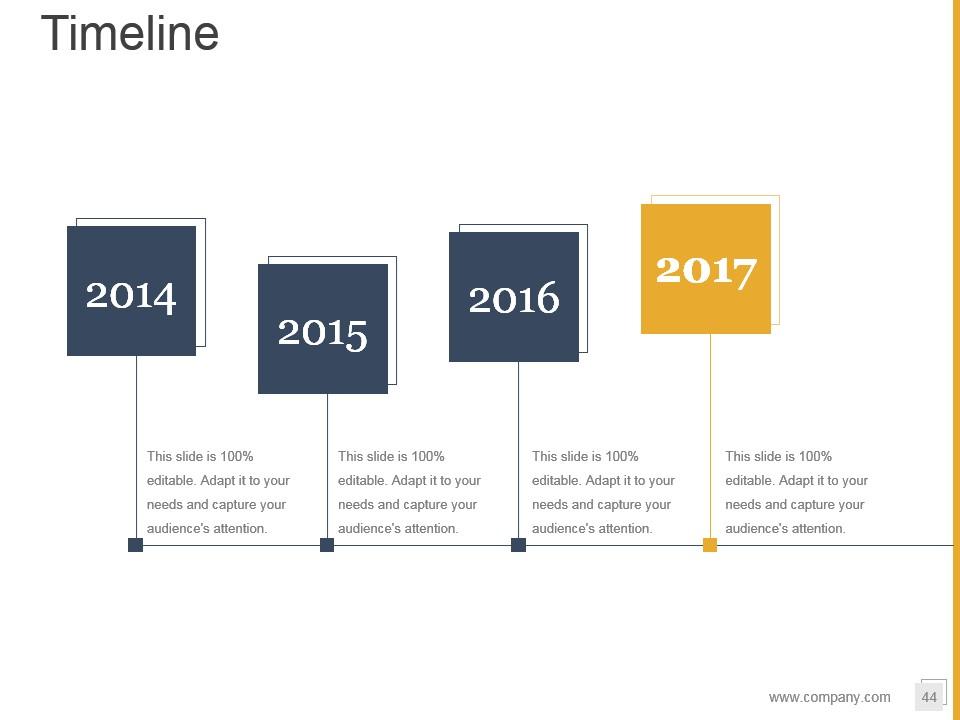
Slide 44: This slide showcase Timeline with four financial years.
Slide 45: This slide presents Post it. You can add Your posted notes.
Slide 46: This slide displays Newspaper. You can add as per your requirement.
Slide 47: This slide showcases a Puzzle with imagery.
Slide 48: This slide shows circular imagenry.
Slide 49: This slide displays a Venn diagram image.
Slide 50: This slide shows a Mindmap for representing entities.
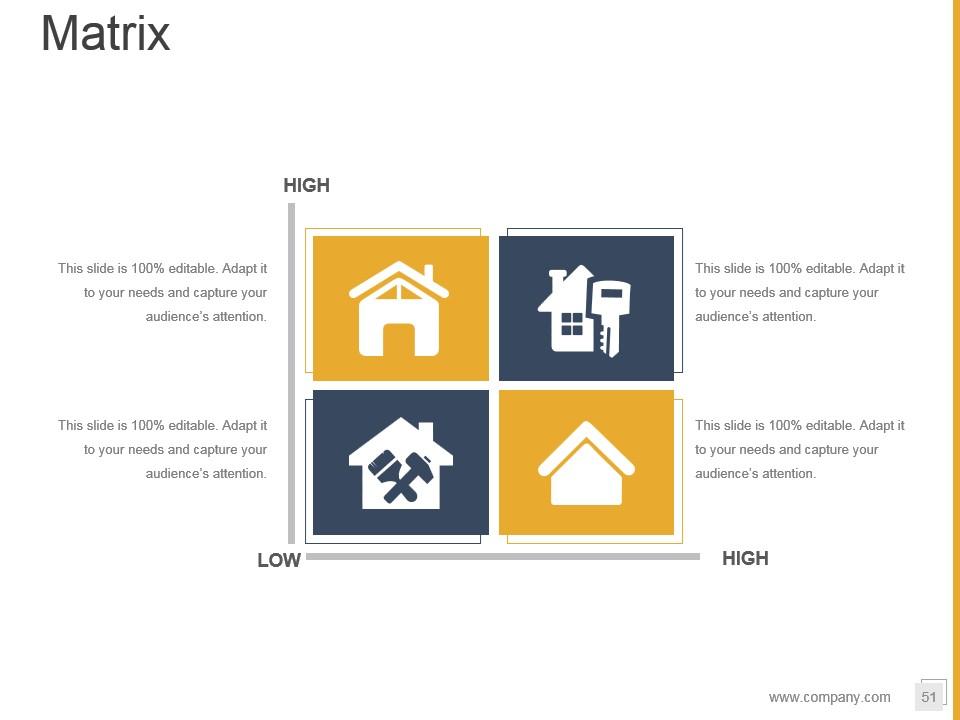
Slide 51: This slide present a matrix from high to low and vice versa.
Slide 52: This slide displays Lego. You can make the best use of it.
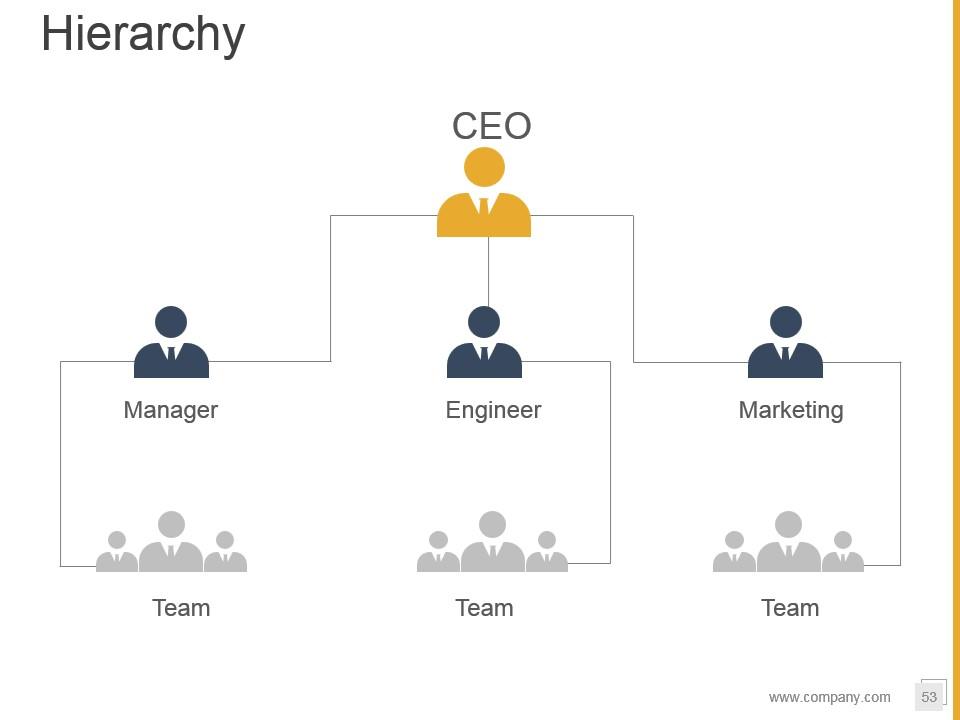
Slide 53: This slide shows Hierarchy chart . You can provide your chart and edit it accordingly.
Slide 54: This slide displays a Bulb or idea image.
Slide 55: This is a Magnifying Glass slide. You can edit as per Your requirement.
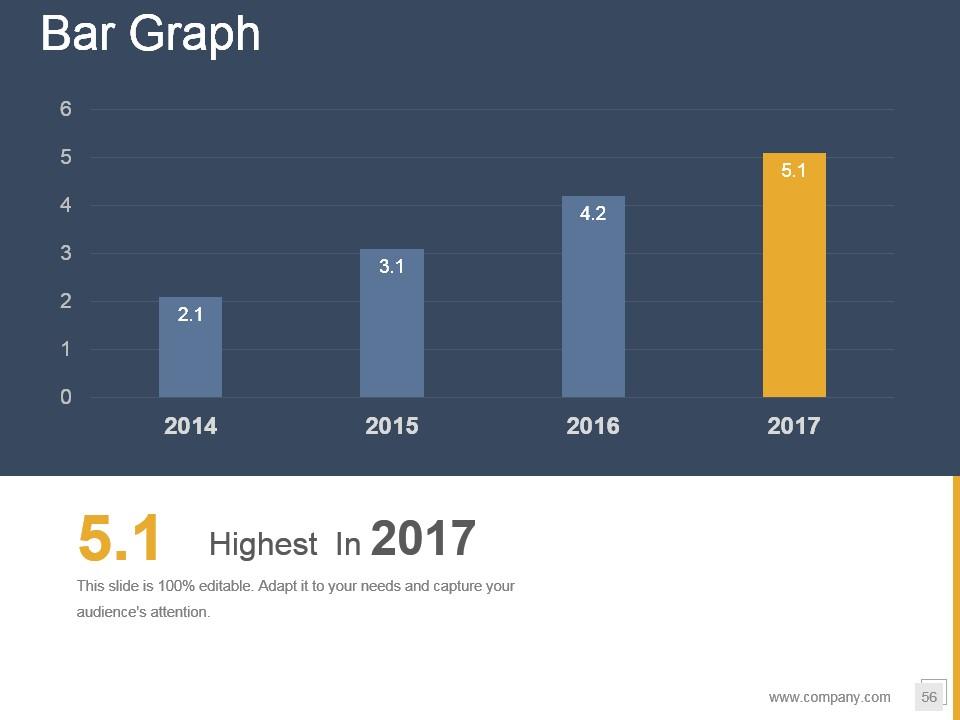
Slide 56: This slide displays the title Bar Graph.
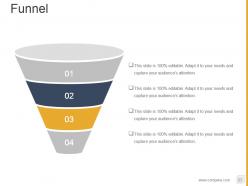
Slide 57: This slide presents Funnel with four steps.
Slide 58: This is a Thank You image slide with Address, Email and Contact number.
Property development process flowchart powerpoint presentation slides with all 58 slides:
Build a fabulous career with our Property Development Process Flowchart Powerpoint Presentation Slides. Get ahead as fast as you can.
-
Great product with highly impressive and engaging designs.
-
Wonderful templates design to use in business meetings.


