71603958 style essentials 2 compare 6 piece powerpoint presentation diagram infographic slide
Introduce the code of conduct with our Calculation Of Servqual Scores Powerpoint Slide Inspiration. Acquaint folks with the behavior expected.
- Google Slides is a new FREE Presentation software from Google.
- All our content is 100% compatible with Google Slides.
- Just download our designs, and upload them to Google Slides and they will work automatically.
- Amaze your audience with SlideTeam and Google Slides.
-
Want Changes to This PPT Slide? Check out our Presentation Design Services
- WideScreen Aspect ratio is becoming a very popular format. When you download this product, the downloaded ZIP will contain this product in both standard and widescreen format.
-

- Some older products that we have may only be in standard format, but they can easily be converted to widescreen.
- To do this, please open the SlideTeam product in Powerpoint, and go to
- Design ( On the top bar) -> Page Setup -> and select "On-screen Show (16:9)” in the drop down for "Slides Sized for".
- The slide or theme will change to widescreen, and all graphics will adjust automatically. You can similarly convert our content to any other desired screen aspect ratio.
Compatible With Google Slides

Get This In WideScreen
You must be logged in to download this presentation.
PowerPoint presentation slides
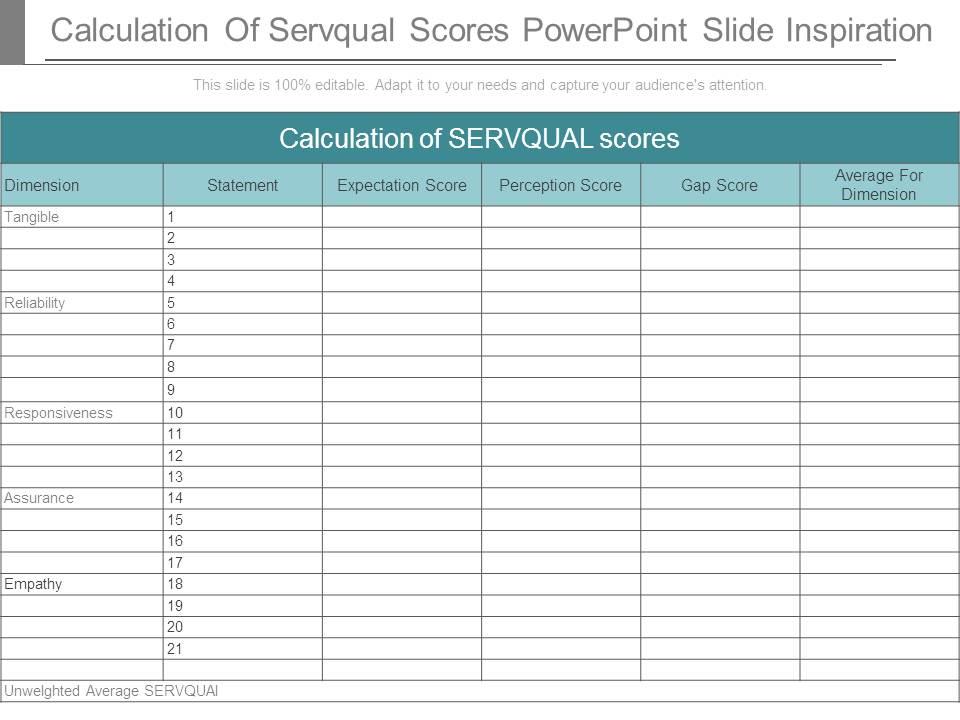
Presenting calculation of servqual scores powerpoint slide inspiration. This is a calculation of servqual scores powerpoint slide inspiration. This is a six stage process. The stages in this process are calculation of servqual scores, dimension, statement, expectation score, perception score, gap score, average for dimension, tangible, reliability, responsiveness, assurance, empathy, unwelghted average servqual score.
71603958 style essentials 2 compare 6 piece powerpoint presentation diagram infographic slide with all 7 slides:
Cherish the idea of friendship with our Calculation Of Servqual Scores Powerpoint Slide Inspiration. Convince folks to exist in harmony.
-
Unique research projects to present in meeting.
-
Very well designed and informative templates.


