Extensive collection of 7 Step All Essential Financial PPT Templates
-
 94738173 style essentials 2 financials 7 piece powerpoint presentation diagram infographic slide
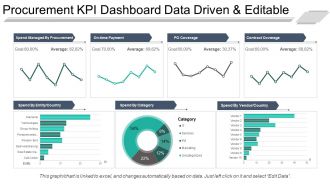
Presenting procurement kpi dashboard snapshot data driven and editable ppt sample file. This is a procurement kpi dashboard data driven and editable ppt sample file. This is a seven stage process. The stages in this process are business, strategy, growth, finance, chart and graph.
-
 40186317 style essentials 2 financials 7 piece powerpoint presentation diagram infographic slide
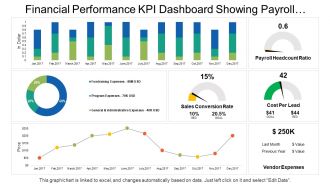
Presenting this set of slides with name - Financial Performance Kpi Dashboard Showing Payroll Headcount Ratio Cost Per Lead. This is a seven stage process. The stages in this process are Financial Performance, Financial Report, Financial Review.
-
 96914002 style essentials 2 financials 7 piece powerpoint presentation diagram infographic slide
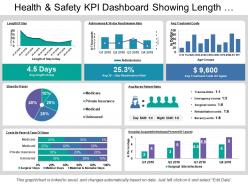
Presenting this set of slides with name - Health And Safety Kpi Dashboard Showing Length Of Stay And Treatment Costs. This is a seven stage process. The stages in this process are Health And Safety, Health And Security, Health And Protection.
-
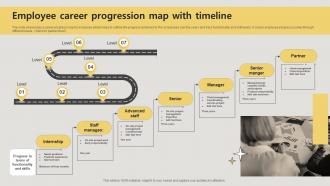 Employee Career Progression Map With Timeline
The slide showcases a career progress map for employee which helps to outline the progress achieved by the employees over the years and track functionality and skill levels. It covers employee progress journey through different levels intern to partner level. Introducing our premium set of slides with Employee Career Progression Map With Timeline Ellicudate the seven stages and present information using this PPT slide. This is a completely adaptable PowerPoint template design that can be used to interpret topics like Internship, Advanced Staff, Manager, Senior Manger . So download instantly and tailor it with your information.
-
 21655484 style essentials 2 financials 7 piece powerpoint presentation diagram infographic slide
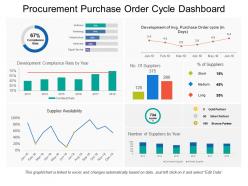
Presenting this set of slides with name - Procurement Purchase Order Cycle Dashboard. This is a seven stage process. The stages in this process are Purchase, Procurement, Buy.
-
 16157216 style essentials 2 financials 7 piece powerpoint presentation diagram infographic slide
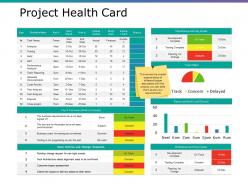
Presenting this set of slides with name - Project Health Card Ppt Samples Download. This is a seven stage process. The stages in this process are Business, Open Actions And Change Requests, Milestones And Key Dates, Marketing.
-
 56004162 style essentials 2 financials 7 piece powerpoint presentation diagram infographic slide
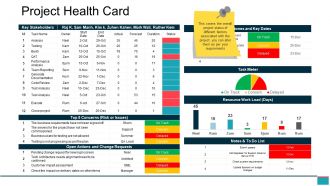
Presenting this set of slides with name - Project Health Card Ppt Example File. This is a seven stage process. The stages in this process are Open Actions And Change Requests, Notes And To Do List, Milestones And Key Dates, Key Stakeholders.
-
 12724240 style essentials 2 financials 7 piece powerpoint presentation diagram infographic slide
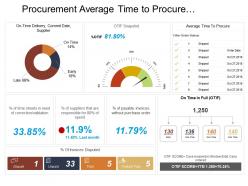
Presenting this set of slides with name - Procurement Average Time To Procure Dashboard. This is a seven stage process. The stages in this process are Purchase, Procurement, Buy.
-
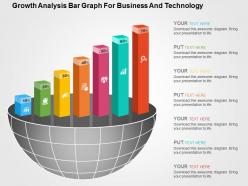 2989873 style concepts 1 growth 7 piece powerpoint presentation diagram template slide
High resolution Presentation slide comes with great picture quality. Download is fast which saves time as well as effort. Customize it by inserting corporation name and logo. Display in both Standard and Widescreen format. Totally responsive and works well with Google slides. Download PPT design to insert text and share. PowerPoint template comes with creative and professional approach. Presentation graphic comes with great pixel quality which ensures better experience for the audience.
-
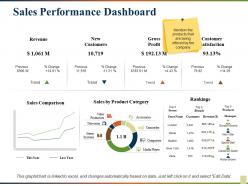 54959374 style division donut 7 piece powerpoint presentation diagram infographic slide
Presenting this set of slides with name - Sales Performance Dashboard. This is a seven stage process. The stages in this process are Revenue, New Customers, Gross Profit, Customer Satisfaction, Rankings .
-
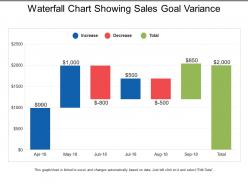 54040547 style essentials 2 financials 7 piece powerpoint presentation diagram infographic slide
Presenting this set of slides with name - Waterfall Chart Showing Sales Goal Variance. This is a seven stage process. The stages in this process are Agile, Waterfall, Scrum, Sprint.
-
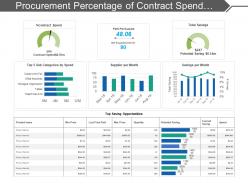 9313846 style essentials 2 financials 7 piece powerpoint presentation diagram infographic slide
Presenting this set of slides with name - Procurement Percentage Of Contract Spend Dashboard. This is a seven stage process. The stages in this process are Purchase, Procurement, Buy.
-
 56692215 style essentials 2 financials 7 piece powerpoint presentation diagram infographic slide
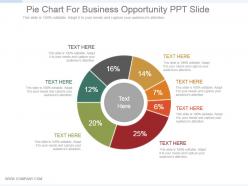
Presenting pie chart for business opportunity ppt slide. This is a pie chart for business opportunity ppt slide. This is a seven stage process. The stages in this process are pie, chart, percentage, financials, process.
-
 92027336 style essentials 1 agenda 7 piece powerpoint presentation diagram infographic slide
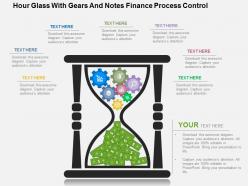
Spectacular presentation of designs and colors. Excellent quality pictures which do not pixelate when projected on wide screen. Compatibility with multiple format options like JPEG and JPG. Harmonious with numerous online and offline software options. 100 percent editable. Ease of swipe out and/or inclusion of content as per individual choice. Freedom to personalize the presentation with company name, logo and or trademark. Used by marketing professionals, financiers, strategists, students and educators.
-
 52869044 style essentials 2 financials 7 piece powerpoint presentation diagram infographic slide
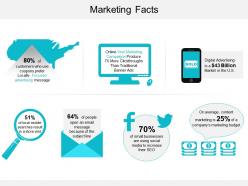
Presenting a PPT slide on Marketing Facts PowerPoint Show. A ready-made, completely editable slide is easy to use. You can add the desired content easily in the slide. You can even customize the font style, font color and font size according to the requirement. Enhancement of the appearance of the slide is possible with the array of editable icons available. The template is compatible with Google Slides .You can convert and save the slide to PDF and JPG formats. Download this PPT slide to make your business presentation effective, with least efforts.
-
 3572746 style essentials 2 financials 7 piece powerpoint presentation diagram infographic slide
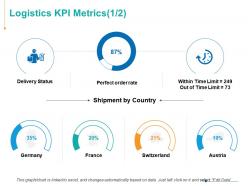
Presenting this set of slides with name - Logistics KPI Metrics Ppt Powerpoint Presentation Model. This is a seven stage process. The stages in this process are Delivery Status, Finance, Analysis, Business, Investment.
-
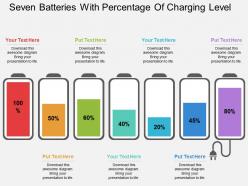 35971750 style essentials 2 financials 7 piece powerpoint presentation diagram infographic slide
The presentation slides emit a luminous display. The templates are loaded with customization features of colour, size, and orientation. Use the facility of playing templates in Google slides for a convenient showcase. The file format of template extends to JPEG, JPG, and PDF. Use the ample space to insert desired content. Remove the watermark of Slide Team post downloading.
-
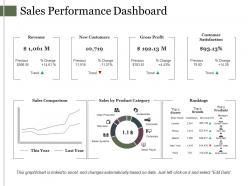 61912835 style essentials 2 financials 7 piece powerpoint presentation diagram infographic slide
Presenting this set of slides with name - Sales Performance Dashboard Presentation Diagrams. This is a seven stage process. The stages in this process are Slide Bar, Marketing, Finance, Growth, Strategy.
-
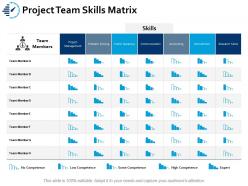 61862592 style essentials 2 financials 7 piece powerpoint presentation diagram infographic slide
Presenting this set of slides with name - Project Team Skills Matrix Ppt Portfolio Gridlines. This is a seven stage process. The stages in this process are Business, Management, Strategy, Sales, Marketing.
-
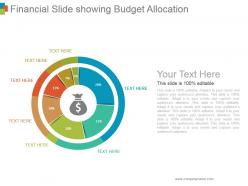 60453361 style division donut 7 piece powerpoint presentation diagram infographic slide
Presenting financial slide showing budget allocation ppt background. This is a financial slide showing budget allocation ppt background. This is a seven stage process. The stages in this process are circular, process, percentage, financial, budget.
-
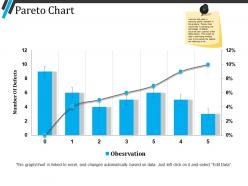 57399992 style essentials 2 financials 7 piece powerpoint presentation diagram infographic slide
Presenting pareto chart powerpoint templates. This is a pareto chart powerpoint templates. This is a seven stage process. The stages in this process are pareto chart, business, growth, finance, analysis.
-
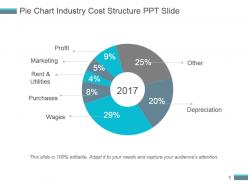 11243198 style division donut 7 piece powerpoint presentation diagram infographic slide
Presenting pie chart industry cost structure ppt slide. This is a pie chart industry cost structure ppt slide. This is a seven stage process. The stages in this process are profit, marketing, rent and utilities, purchases, wages, other, depreciation.
-
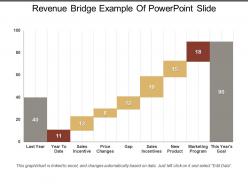 74457551 style essentials 2 financials 7 piece powerpoint presentation diagram infographic slide
Presenting this set of slides with name - Revenue Bridge Example Of Powerpoint Slide. This is a seven stage process. The stages in this process are Revenue Bridge, Income Bridge, Earnings Bridge.
-
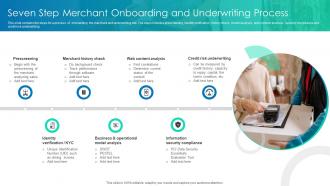 Seven Step Merchant Onboarding And Underwriting Process
This slide contains the steps for a process of onboarding the merchant and underwriting risk. The steps includes prescreening, identity verification, history check, model analysis, web content analysis, security compliance and credit risk underwriting. Introducing our premium set of slides with Seven Step Merchant Onboarding And Underwriting Process. Ellicudate the seven stages and present information using this PPT slide. This is a completely adaptable PowerPoint template design that can be used to interpret topics like Prescreening, Merchant History Check, Web Content Analysis. So download instantly and tailor it with your information.
-
 41453541 style essentials 2 financials 7 piece powerpoint presentation diagram infographic slide
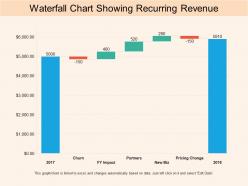
Presenting this set of slides with name - Waterfall Chart Showing Recurring Revenue. This is a seven stage process. The stages in this process are Agile, Waterfall, Scrum, Sprint.
-
 45021029 style essentials 2 financials 7 piece powerpoint presentation diagram infographic slide
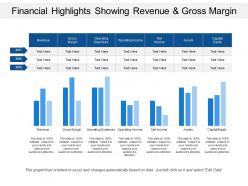
Presenting this set of slides with name - Financial Highlights Showing Revenue And Gross Margin. This is a seven stage process. The stages in this process are Highlights, High Point, High Spot.
-
 98560201 style essentials 2 financials 7 piece powerpoint presentation diagram infographic slide
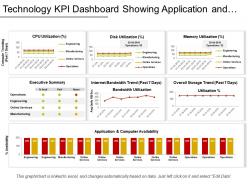
Presenting this set of slides with name - Technology Kpi Dashboard Showing Application And Compute Availability. This is a seven stage process. The stages in this process are Technology, IT, IOT.
-
 67270048 style essentials 2 financials 7 piece powerpoint presentation diagram infographic slide
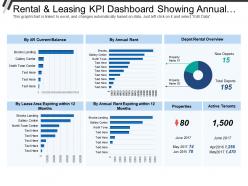
Presenting this set of slides with name - Rental And Leasing Kpi Dashboard Showing Annual Rent Depot Rental Overview. This is a seven stage process. The stages in this process are Rental And Leasing, Dealing And Leasing, Rental And Engage.
-
 92578159 style essentials 2 financials 7 piece powerpoint presentation diagram infographic slide
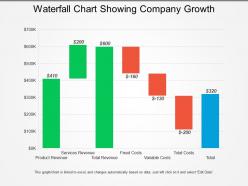
Presenting Waterfall Chart showing Company Growth PPT slide. This presentation diagram is fully editable in PowerPoint and adaptable with Google slides. You can customize the font type, font size, colors of the diagram, and background color as per your requirement. Also, you can incorporate your company name and logo in the slide. Replace the dummy content in text placeholders with your presentation content. Fast download at click of a button.
-
 6686810 style division donut 7 piece powerpoint presentation diagram infographic slide
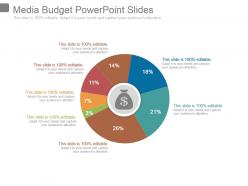
Presenting media budget powerpoint slides. This is a media budget powerpoint slides. This is a seven stage process. The stages in this process are donut, strategy, management, finance, business.
-
 12113157 style essentials 2 financials 7 piece powerpoint presentation diagram infographic slide
Presenting this set of slides with name - Healthcare Dashboard With Admission By Division And Overall Patient Satisfaction. This is a seven stage process. The stages in this process are Healthcare, Health Improvement, Medical Care.
-
 Brand tracking infographics ppt powerpoint presentation infographic template
Presenting this set of slides with name Brand Tracking Infographics Ppt Powerpoint Presentation Infographic Template. This is a seven stage process. The stages in this process are Brand Tracking Infographics, Online Reviews, Consumers Trust. This is a completely editable PowerPoint presentation and is available for immediate download. Download now and impress your audience.
-
 91101281 style essentials 2 financials 7 piece powerpoint presentation diagram infographic slide
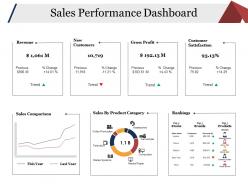
Presenting this set of slides with name - Sales Performance Dashboard Ppt Slide Examples. This is a seven stage process. The stages in this process are Revenue, New Customers, Gross Profit, Customer Satisfaction, Sales Comparison.
-
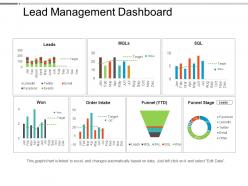 14475730 style essentials 2 financials 7 piece powerpoint presentation diagram infographic slide
This PPT includes 1 dashboard template which can be easily edited as per your preference. The infographic slide can be instantly downloaded just with a click. It is excel linked and data-driven. It can be used by any business organization and management. The image quality does not degrade even if viewed in any size of the screen. Compatible with Google Slides. Available in two slide size designs- Standard and widescreen.
-
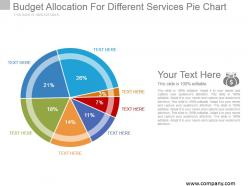 30672143 style division pie 7 piece powerpoint presentation diagram template slide
Presenting budget allocation for different services pie chart example of ppt. This is a budget allocation for different services pie chart example of ppt. This is a seven stage process. The stages in this process are pie chart, finance, marketing, strategy, business, success, percentage.
-
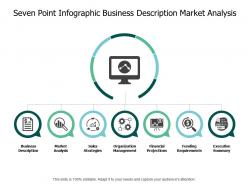 46590165 style essentials 2 financials 7 piece powerpoint presentation diagram infographic slide
Showcasing seven point infographic business description market analysis presentation template. PowerPoint slide is easy to present among large set of audience as comes with great pixel quality. Easy to convert into PDF or JPG formats and works well with Google Slides. PPT layout can be downloaded with different nodes and stages. Adjust the presentation design by adding trade name, logo, icon and tagline. Fully editable design as fonts, text, colors can be edited.
-
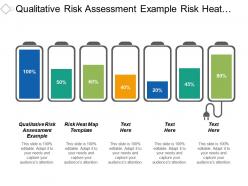 66610548 style essentials 2 financials 7 piece powerpoint presentation diagram infographic slide
Presenting this set of slides with name - Qualitative Risk Assessment Example Risk Heat Map Template Cpb. This is an editable seven graphic that deals with topics like Qualitative Risk Assessment Example, Risk Heat Map Template to help convey your message better graphically. This product is a premium product available for immediate download, and is 100 percent editable in Powerpoint. Download this now and use it in your presentations to impress your audience.
-
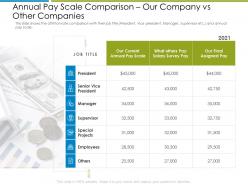 Annual pay scale comparison increase employee churn rate it industry ppt gallery sample
This slide shows the attrition rate comparison with their job title President, Vice president, Manager, Supervisor etc. and annual pay scale. Introducing Annual Pay Scale Comparison Increase Employee Churn Rate It Industry Ppt Gallery Sample to increase your presentation threshold. Encompassed with seven stages, this template is a great option to educate and entice your audience. Dispence information on Salary Survey Pay, Annual Pay Scale, Assigned Pay, Special Projects, using this template. Grab it now to reap its full benefits.
-
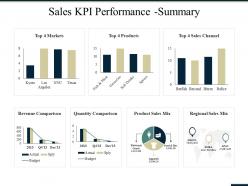 77339893 style essentials 2 financials 7 piece powerpoint presentation diagram infographic slide
Presenting this set of slides with name - Sales Kpi Performance Summary Ppt Summary Gridlines. This is a seven stage process. The stages in this process are Markets, Sales Channel, Regional Sales Mix, Product Sales Mix, Quantity Comparison.
-
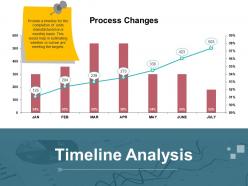 20420627 style essentials 2 financials 7 piece powerpoint presentation diagram infographic slide
Presenting this set of slides with name - Timeline Analysis Powerpoint Guide. This is a seven stage process. The stages in this Presenting timeline analysis PowerPoint guide PPT slide. The timeline analysis graph presentation slide designed by the professionals of SlideTeam to illustrate a variety of purposes. The event timeline analysis presentation slide is completely editable in PowerPoint. The timeline data analysis PPT template is also compatible with Google Slide and a user can share with others as well. A user can make changes in the font size, font type, color as well as dimensions of the graphs in analysis timeline PowerPoint slide as per his requirement and the slide get linked with Excel sheet.
-
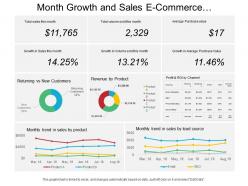 74234962 style essentials 2 financials 7 piece powerpoint presentation diagram infographic slide
Presenting this set of slides with name - Month Growth And Sales E Commerce Dashboard. This is a seven stage process. The stages in this process are Mercantilism, Commercialism, Ecommerce.
-
 74781745 style essentials 2 financials 7 piece powerpoint presentation diagram template slide
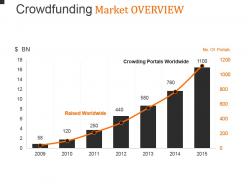
Presenting crowdfunding market overview powerpoint guide. This is a crowdfunding market overview powerpoint guide. This is a seven stage process. The stages in this process are raised worldwide, crowding portals worldwide.
-
 42339012 style essentials 2 financials 7 piece powerpoint presentation diagram infographic slide
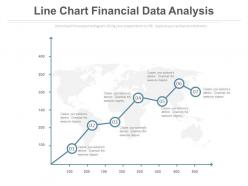
Perfect PPT slide for marketing and sales people, business analysts, market researchers. Completely editable content including fonts, text, colors, etc. Useful illustration of numerical figures using editable excel linked chart. Compatible with number of software options. Personalize the presentation with individual company name and logo. Excellence in picture quality even on wide screen output. Easy and quick downloading process. Flexible option for conversion in PDF or JPG formats. Compatible with Google slides.
-
 62501793 style essentials 2 financials 7 piece powerpoint presentation diagram infographic slide
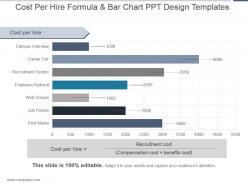
Presenting cost per hire formula and bar chart ppt design templates. This is a cost per hire formula and bar chart ppt design templates. This is a seven stage process. The stages in this process are cost per hire, campus interview, career fair, requirement vendor, employee referral, web groups, job portals, print media, cost per hire, recruitment cost, compensation cost benefits cost.
-
 89876605 style concepts 1 growth 7 piece powerpoint presentation diagram template slide
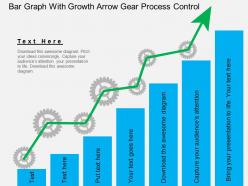
Presenting ga bar graph with growth arrow gear process control flat powerpoint design. This Power Point template diagram has been crafted with graphic of bar graph and growth arrow. This PPT diagram contains the concept of process control and growth indication. Use this PPT diagram and build a quality presentation.
-
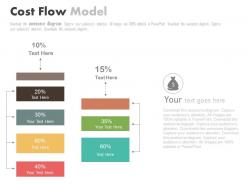 44846921 style essentials 2 financials 7 piece powerpoint presentation diagram infographic slide
Presenting seven staged cost flow model powerpoint slides. This Power Point template slide has been crafted with graphic of seven staged cost flow model. This PPT slide contains the concept of financial analysis. Use this PPT slide for business and finance related presentations.
-
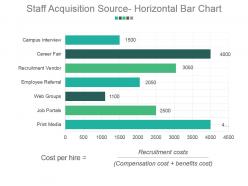 62456964 style essentials 2 financials 7 piece powerpoint presentation diagram infographic slide
Presenting staff acquisition source horizontal bar chart powerpoint slide backgrounds. This is a staff acquisition source horizontal bar chart powerpoint slide backgrounds. This is a seven stage process. The stages in this process are campus interview, career fair, recruitment vendor, employee referral, web groups, job portals, print media.
-
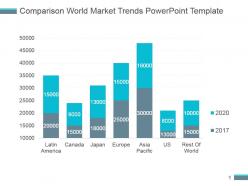 6985833 style essentials 2 financials 7 piece powerpoint presentation diagram template slide
Presenting comparison world market trends powerpoint template. This is a comparison world market trends powerpoint template. This is a seven stage process. The stages in this process are latin america, canada, japan, europe, asia pacific, us, rest of world.
-
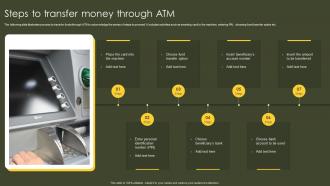 Steps To Transfer Money Through ATM
The following slide illustrates process to transfer funds through ATM to acknowledge the series of steps to proceed. It includes activities such as inserting card to the machine, entering PIN, choosing fund transfer option etc. Introducing our premium set of slides with Steps To Transfer Money Through ATM. Elucidate the seven stages and present information using this PPT slide. This is a completely adaptable PowerPoint template design that can be used to interpret topics like Steps, Transfer Money Through, ATM. So download instantly and tailor it with your information.
-
 85983081 style concepts 1 growth 7 piece powerpoint presentation diagram infographic slide
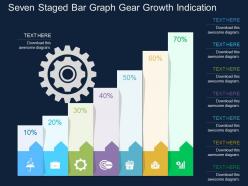
We are proud to present our seven staged bar graph gear growth indication flat powerpoint design. Seven staged bar graph and gear has been used to design this power point template diagram. This PPT diagram contains the concept of growth indication. Use this PPT diagram for business and finance related presentations.
-
 41341538 style essentials 2 financials 7 piece powerpoint presentation diagram infographic slide
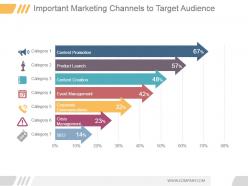
Presenting important marketing channels to target audience ppt example. This is a important marketing channels to target audience ppt example. This is a seven stage process. The stages in this process are content promotion, product launch, content creation, event management, corporate communications, crisis management, seo, category.
-
 89036683 style essentials 2 financials 7 piece powerpoint presentation diagram infographic slide
Presenting this set of slides with name - 7 Steps Incentive Plan Icon. This is a seven stage process. The stages in this process are Incentive Plan, Reward Plan, Bonus Strategies.
-
 Facts And Figures Data Analytics Company Profile CPSSV
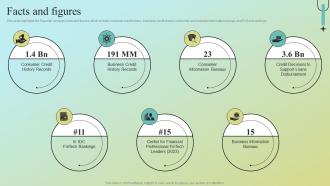
This slide highlights the Experian company facts and figures which include consumer credit history, business credit history, consumer and business information bureau, and FinTech rankings. Increase audience engagement and knowledge by dispensing information using Facts And Figures Data Analytics Company Profile CPSSV. This template helps you present information on seven stages. You can also present information on Consumer, Records, Decisions using this PPT design. This layout is completely editable so personaize it now to meet your audiences expectations.
-
 46934181 style essentials 2 financials 7 piece powerpoint presentation diagram infographic slide
Presenting this set of slides with name - 7 Factors Incentive Plan Icon. This is a seven stage process. The stages in this process are Incentive Plan, Reward Plan, Bonus Strategies.
-
 26428087 style essentials 2 financials 7 piece powerpoint presentation diagram infographic slide
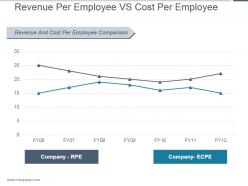
Presenting revenue per employee vs cost per employee ppt templates. This is a revenue per employee vs cost per employee ppt templates. This is a seven stage process. The stages in this process are revenue and cost per employee comparison, company rpe, company ecpe, fy.
-
 33486709 style essentials 2 financials 7 piece powerpoint presentation diagram infographic slide
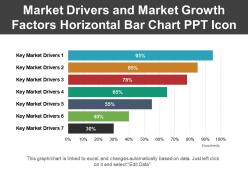
Presenting market drivers and market growth factors PPT slide. This is professionally organized PPT template quite constructive for management professionals. Amendable shapes, patterns and subject matters. Authentic and relevant PPT Images with pliable options to insert caption or sub caption. Smooth Downloads. Runs smoothly with all available software’s. High quality Picture Presentation graphics which remain unaffected when projected on wide screen or google Slides.
-
 Major Key Account Management Strategies Key Account Management Assessment
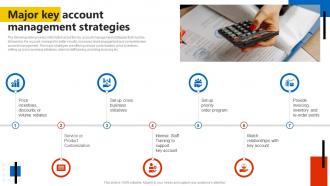
The following slide provides information about the key account management strategies that must be followed by the account manager for better results, increased client engagement and comprehensive account management. The major strategies are offering service customization, price incentives, setting up cross business initiatives, internal staff training, providing invoicing etc. Increase audience engagement and knowledge by dispensing information using Major Key Account Management Strategies Key Account Management Assessment. This template helps you present information on seven stages. You can also present information on Product Customization, Business Initiatives, Order Program using this PPT design. This layout is completely editable so personaize it now to meet your audiences expectations.
-
 31513745 style essentials 2 financials 7 piece powerpoint presentation diagram infographic slide
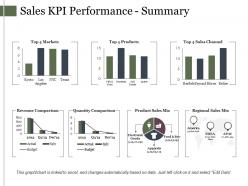
Presenting this set of slides with name - Sales Kpi Performance Summary Ppt Sample Presentations. This is a seven stage process. The stages in this process are Bar, Marketing, Finance, Growth, Strategy.
-
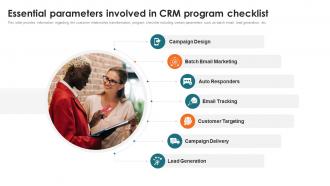 Customer Relationship Management Toolkit Essential Parameters Involved In CRM Program
This slide provides information regarding the customer relationship transformation program checklist including certain parameters such as batch email, lead generation, etc. Introducing Customer Relationship Management Toolkit Essential Parameters Involved In CRM Program to increase your presentation threshold. Encompassed with seven stages, this template is a great option to educate and entice your audience. Dispence information on Lead Generation, Campaign Delivery, Customer Targeting, Email Tracking, using this template. Grab it now to reap its full benefits.
-
 88140759 style essentials 2 financials 7 piece powerpoint presentation diagram infographic slide
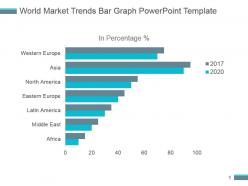
Presenting world market trends bar graph powerpoint template. This is a world market trends bar graph powerpoint template. This is a seven stage process. The stages in this process are in percentage, western europe, asia, north america, eastern europe, latin america, middle east, africa.


