63695259 style hierarchy matrix 3 piece powerpoint presentation diagram infographic slide
Watch our product value proposition mapping showing benefits and value price PowerPoint template designed to meet your business requirements. Our presentation slide comes with a beautiful design with movable shapes as boxes for highlighting your business information in a unique way. Every company struggles to create the products and services that the customers really want. This product mapping PPT slideshow allows you to portray the description and features of your product by making meaningful comparisons and for the proper execution of your business plans. This PPT slide shows the relation between the price and benefits of your products i.e. higher the price more will be the benefits derived from that particular product. Apart from this, the product analysis presentation design is completely editable and your team can modify it time to time as per the need of your business strategies. You can browse through our library of tables and pick the one which suits your requirements. Connectivity is no constraint with our Product Value Proposition Mapping Showing Benefits And Value Price. Get across clearly to all around.
- Google Slides is a new FREE Presentation software from Google.
- All our content is 100% compatible with Google Slides.
- Just download our designs, and upload them to Google Slides and they will work automatically.
- Amaze your audience with SlideTeam and Google Slides.
-
Want Changes to This PPT Slide? Check out our Presentation Design Services
- WideScreen Aspect ratio is becoming a very popular format. When you download this product, the downloaded ZIP will contain this product in both standard and widescreen format.
-

- Some older products that we have may only be in standard format, but they can easily be converted to widescreen.
- To do this, please open the SlideTeam product in Powerpoint, and go to
- Design ( On the top bar) -> Page Setup -> and select "On-screen Show (16:9)” in the drop down for "Slides Sized for".
- The slide or theme will change to widescreen, and all graphics will adjust automatically. You can similarly convert our content to any other desired screen aspect ratio.
Compatible With Google Slides

Get This In WideScreen
You must be logged in to download this presentation.
PowerPoint presentation slides
Presenting product value proposition mapping showing benefits and value price PPT slideshow. PowerPoint graphic can be viewed in Standard and Widescreen view. Presentation slides are well-matched with Google slides. PPT image can be transformed into JPEG and PDF. High quality images and graphics are used in the presentation design. Useful for marketing industry leaders and professionals. Fast download and effortlessly inclusion in your presentation. Possess time saving qualities. Will live up to your and viewer’s expectations. Flexible PPT slide as can be used whenever required.
Content of this Powerpoint Presentation
Description:
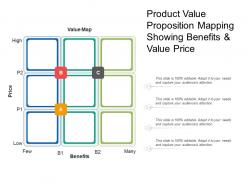
The image showcases a PowerPoint slide titled "Product Value Proposition Mapping Showing Benefits & Value Price". The slide features a value map, which is a two-dimensional diagram used to illustrate a product's value proposition based on two variables: price and benefits.
1. The vertical axis represents "Price", with "High" at the top and "Low" at the bottom, split into two levels marked as P1 and P2.
2. The horizontal axis represents "Benefits", ranging from "Few" to "Many", also split into two levels marked as B1 and B2.
There are three boxes, each representing a product (labeled A, B, and C) positioned within this matrix:
1. Product A (Yellow Box):
Positioned at the intersection of P1 and B1, suggesting that this product is priced at a lower tier (P1) and offers fewer benefits (B1).
2. Product B (Red Box):
Located at the cross-section of P2 and B1, indicating a higher price (P2) but fewer benefits (B1).
3. Product C (Grey Box):
Placed at P2 and B2, implying that this product is at a higher price point (P2) and offers many benefits (B2).
Use Cases:
This slide is highly adaptable and can be used in various industries to analyze and present product positioning:
1. Consumer Electronics:
Use: Comparing features and pricing of gadgets.
Presenter: Product Strategist
Audience: Marketing Team, Product Developers
2. Pharmaceuticals:
Use: Positioning drugs based on efficacy and cost.
Presenter: Brand Manager
Audience: Healthcare Professionals, Sales Representatives
3. Automotive:
Use: Differentiating car models based on features and price.
Presenter: Marketing Executive
Audience: Dealers, Sales Teams
4. Software:
Use: Analyzing software products by functionality and subscription price.
Presenter: Product Manager
Audience: Potential Clients, Sales Force
5. Retail:
Use: Positioning retail products based on value for money.
Presenter: Category Manager
Audience: Buyers, Merchandising Staff
6. Food and Beverage:
Use: Mapping out food products by nutritional benefits and price.
Presenter: Brand Developer
Audience: Retail Partners, Nutritionists
7. Financial Services:
Use: Showcasing financial products by benefits like interest or returns and cost.
Presenter: Financial Advisor
Audience: Customers, Client Investors
63695259 style hierarchy matrix 3 piece powerpoint presentation diagram infographic slide with all 5 slides:
Broadcast your impeccable credentials with our Product Value Proposition Mapping Showing Benefits And Value Price. Convince folks you can do a brilliant job.
-
Informative design.
-
Colors used are bright and distinctive.


