Revenue budget powerpoint presentation slides
Introducing Revenue Budget PowerPoint Presentation Slides that contains content ready professional designs. Revenue is the income that businesses generate from sales of their goods and services. By using this income plan PowerPoint complete deck, you can present how-to calculate long term business profitability. This money management PowerPoint design contains professional slides on budgeting templates, channel marketing budget, planned/actual cost comparison, product launch budget plan, company budget, event budget, product launch marketing budget, social media budget etc. Our researchers thoroughly study the topics and covered every aspect of capital budgeting. Financial report PPT layout helps to portray various related terms such as cost analysis, capital structure, financial management, cash flow, budget planning, revenue forecast, profitability index, capital management, financial plan, funding sources etc. Download our customized cash allocation PowerPoint template to present financial factors in an impressive manner. Analyse conflicting inputs with our Budget Presentation Slides. Ensure inferences drawn are accurate.
- Google Slides is a new FREE Presentation software from Google.
- All our content is 100% compatible with Google Slides.
- Just download our designs, and upload them to Google Slides and they will work automatically.
- Amaze your audience with SlideTeam and Google Slides.
-
Want Changes to This PPT Slide? Check out our Presentation Design Services
- WideScreen Aspect ratio is becoming a very popular format. When you download this product, the downloaded ZIP will contain this product in both standard and widescreen format.
-

- Some older products that we have may only be in standard format, but they can easily be converted to widescreen.
- To do this, please open the SlideTeam product in Powerpoint, and go to
- Design ( On the top bar) -> Page Setup -> and select "On-screen Show (16:9)” in the drop down for "Slides Sized for".
- The slide or theme will change to widescreen, and all graphics will adjust automatically. You can similarly convert our content to any other desired screen aspect ratio.
Compatible With Google Slides

Get This In WideScreen
You must be logged in to download this presentation.
PowerPoint presentation slides
Showcasing Revenue Budget PowerPoint Presentation Slides. The PPT deck includes a set of 40 PowerPoint slides and professional layouts. The presentation is 100% editable in PowerPoint. Change the fonts, text, and color as per your requirements., you can download the PPT in both widescreen (16:9) and standard (4:3) aspect ratio. The PPT presentation contains editable charts and graphs, timelines, roadmaps, and other professional PowerPoint templates as well as icons.
Content of this Powerpoint Presentation
Slide 1: This slide presents Revenue Budget. State your company name here and begin.
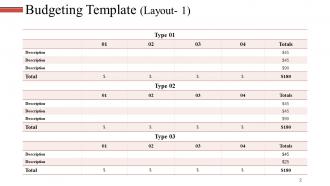
Slide 2: This is Budgeting Template slide. Use it to showcase your budget.
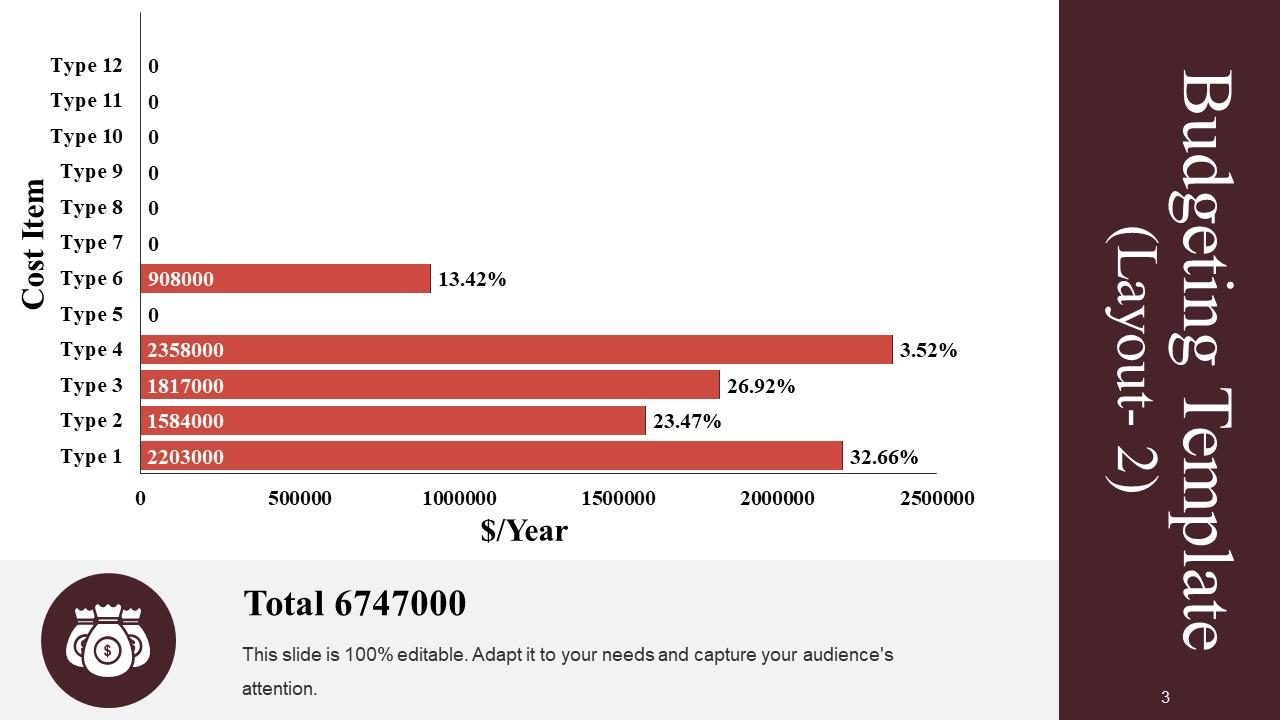
Slide 3: This slide also shows Budgeting Template in a bar graph/ chart form.
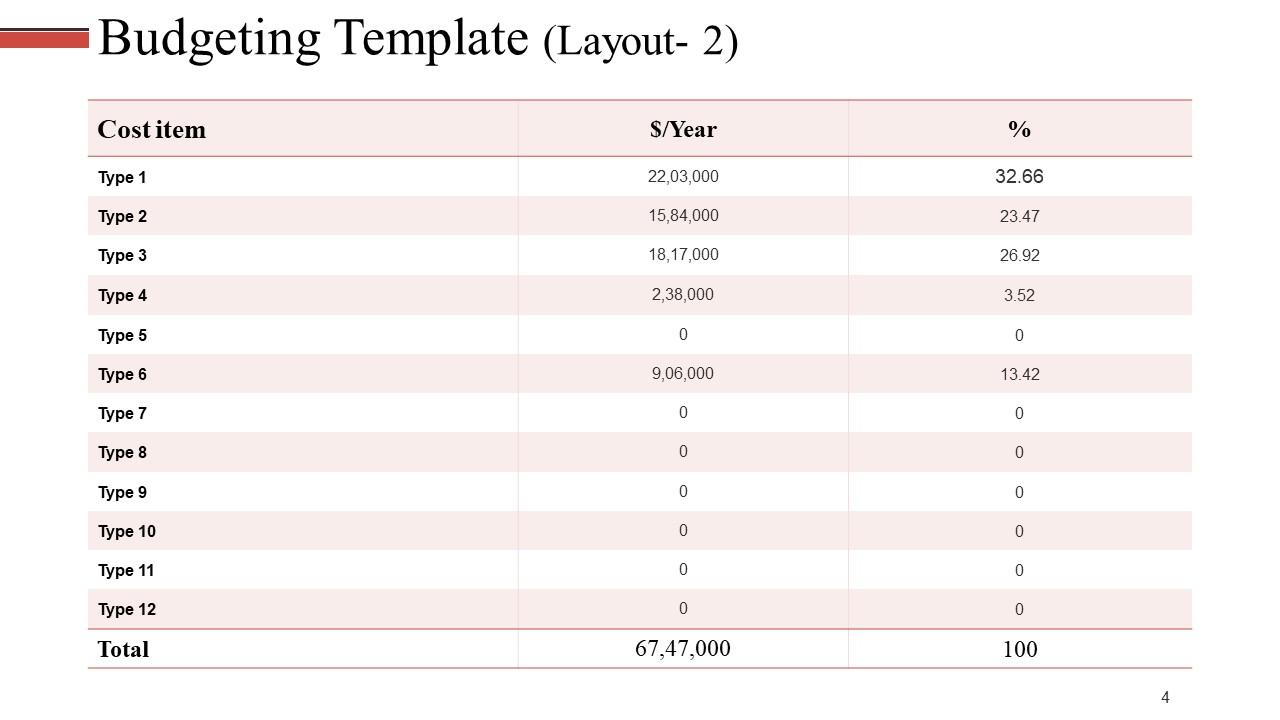
Slide 4: This is another slide showing Budgeting Template in a tabular form.
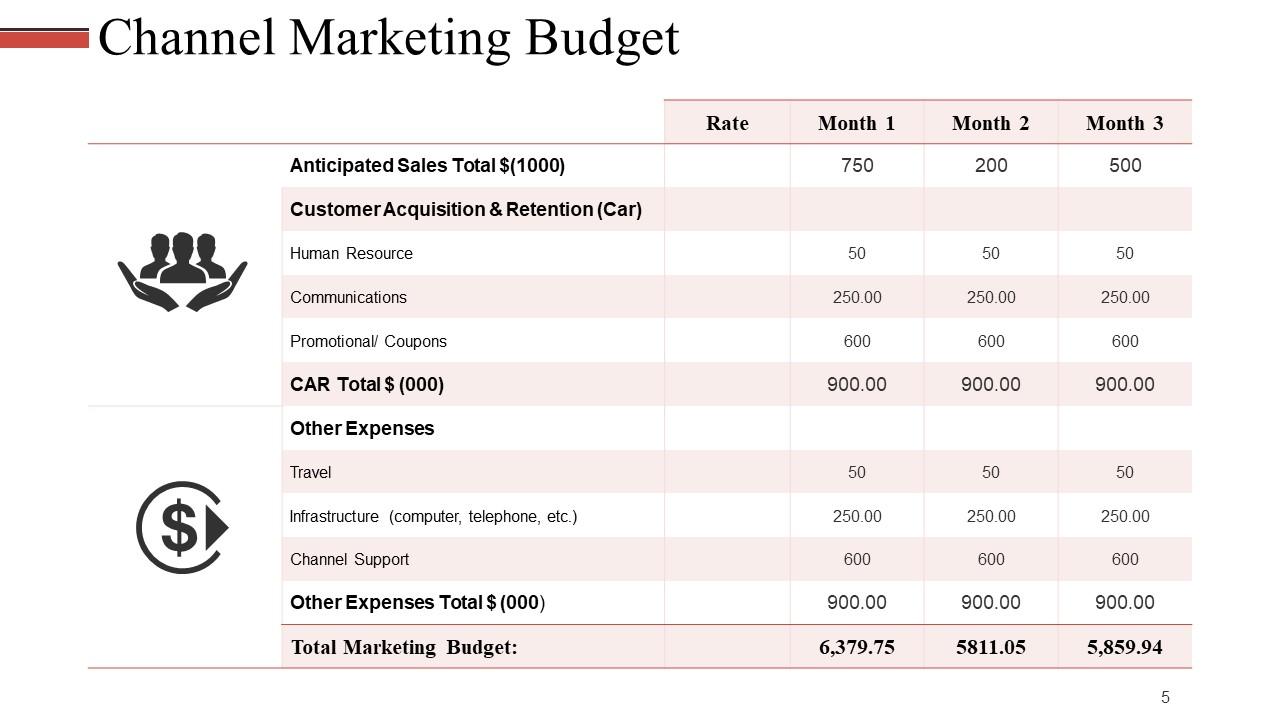
Slide 5: This slide showcases Channel Marketing Budget in a tabular form.
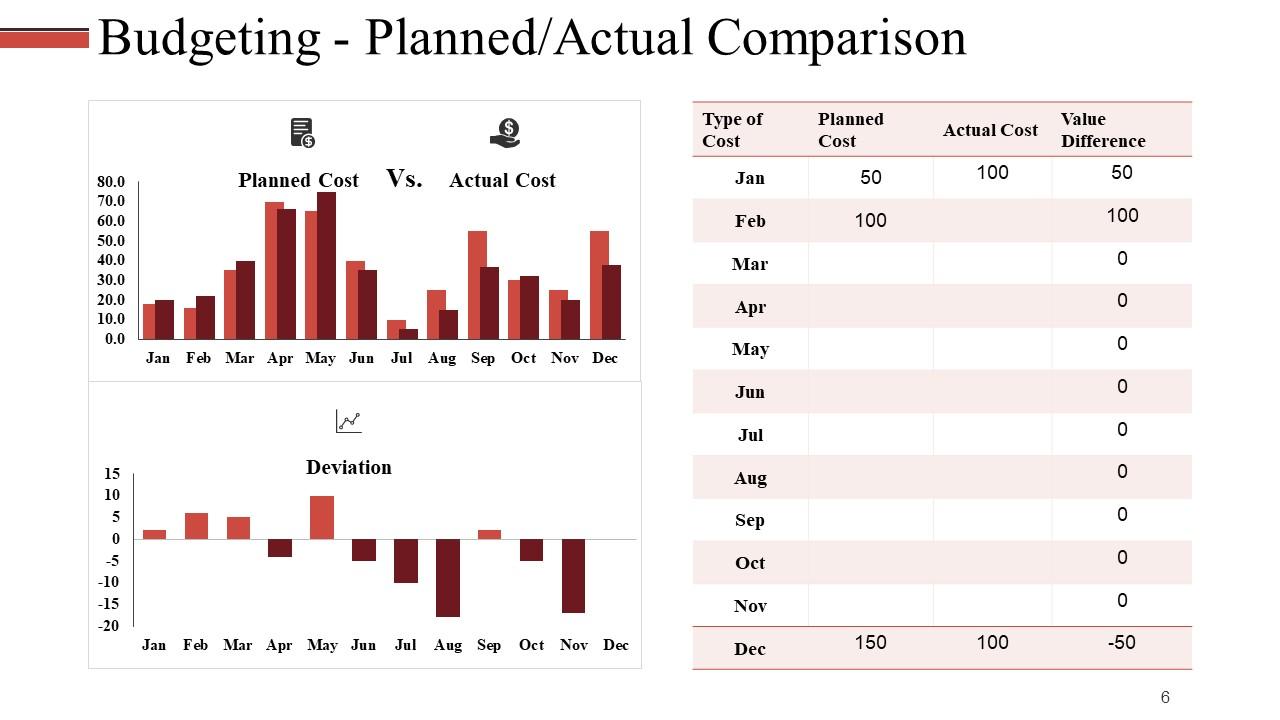
Slide 6: This is Budgeting - Planned/ Actual Comparison slide in a bar graph/ chart form.
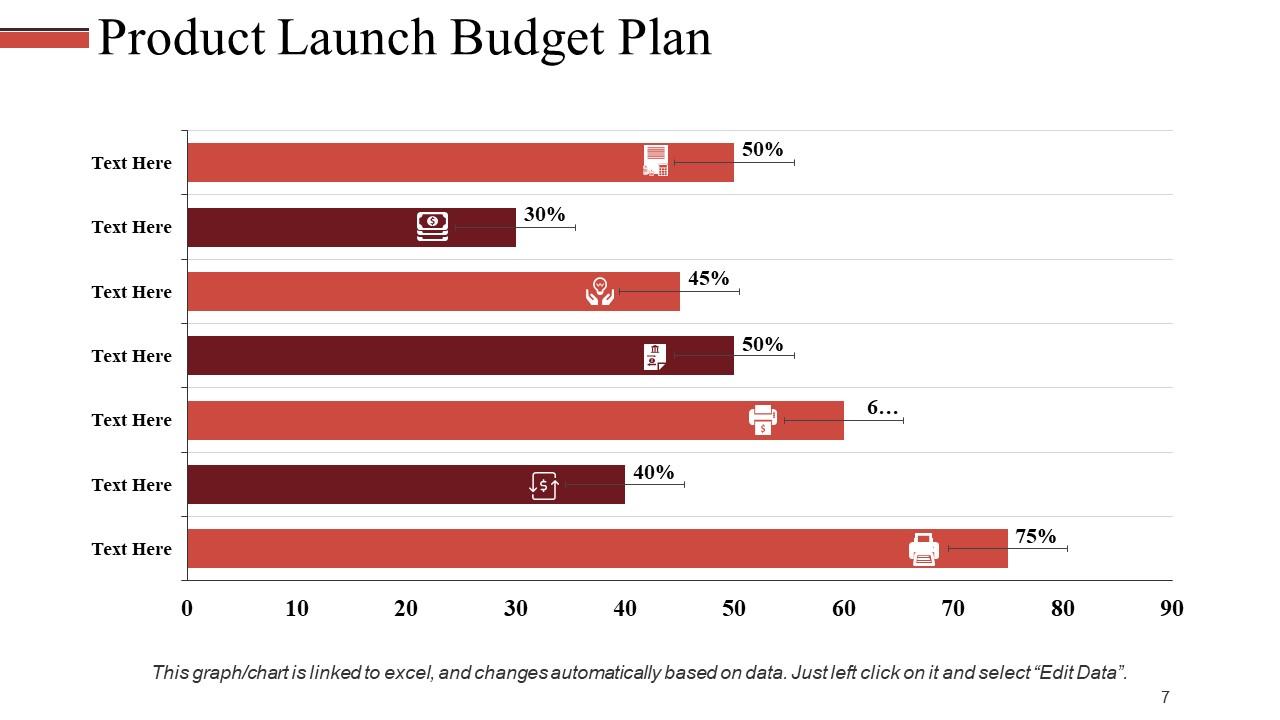
Slide 7: This slide showcases Product Launch Budget Plan in a bar graph/ chart form.
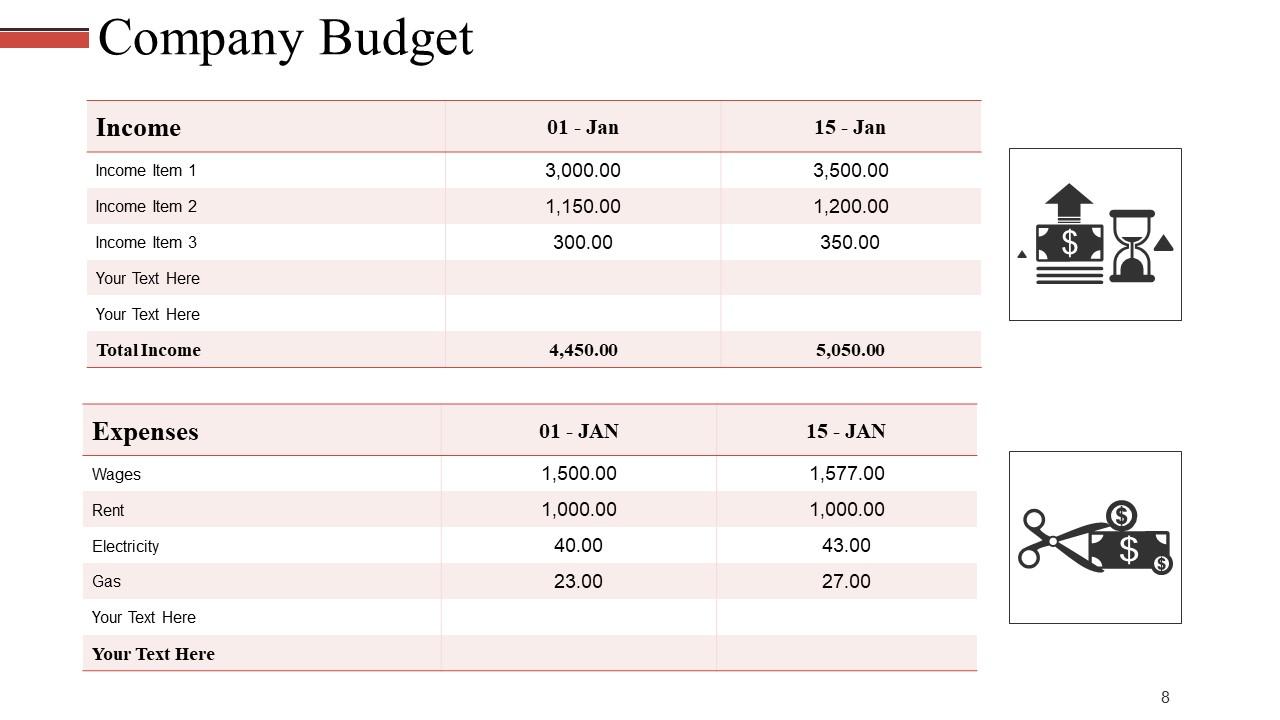
Slide 8: This slide presents Company Budget in a tabular form.
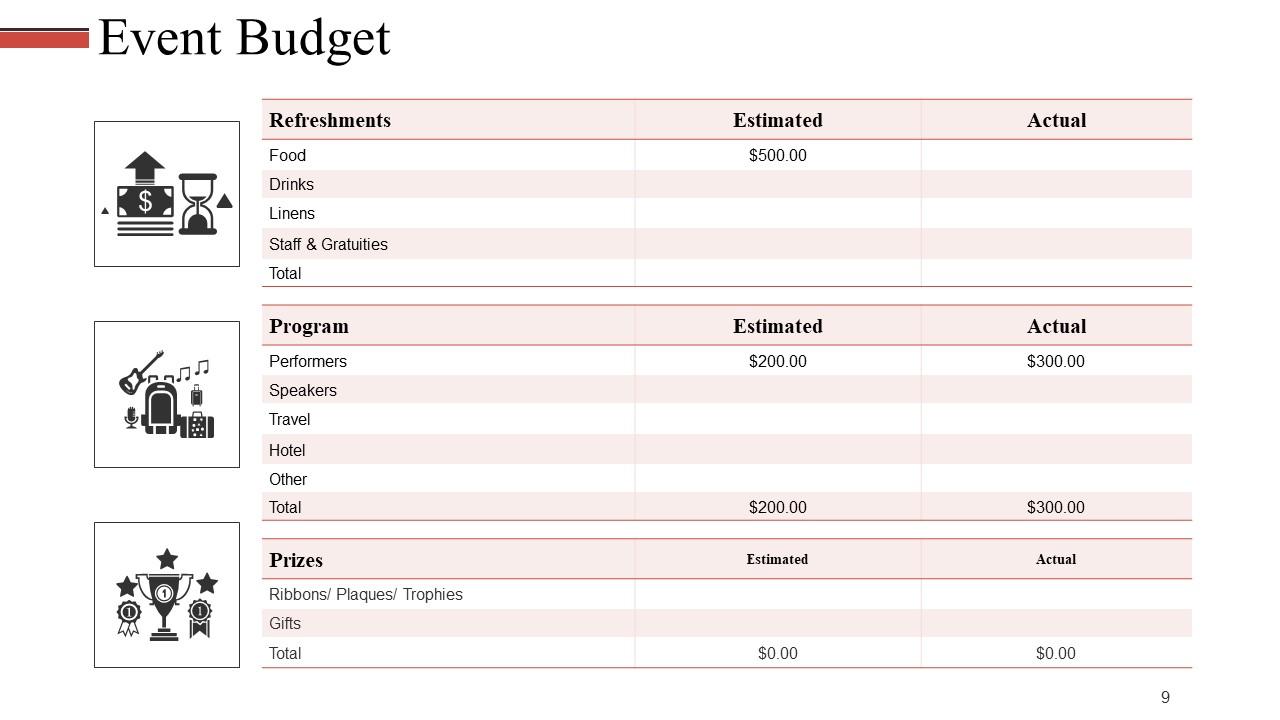
Slide 9: This is Event Budget slide to state.
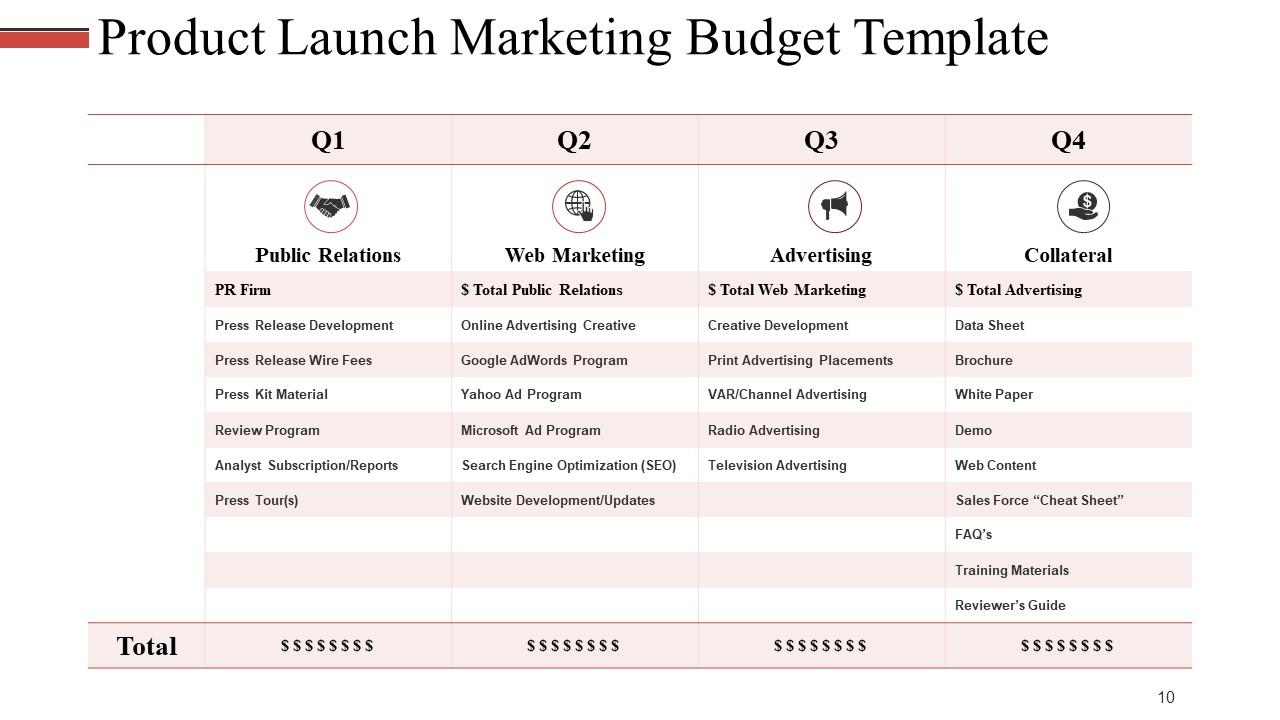
Slide 10: This slide showcases Product Launch Marketing Budget Template in a tabular form.
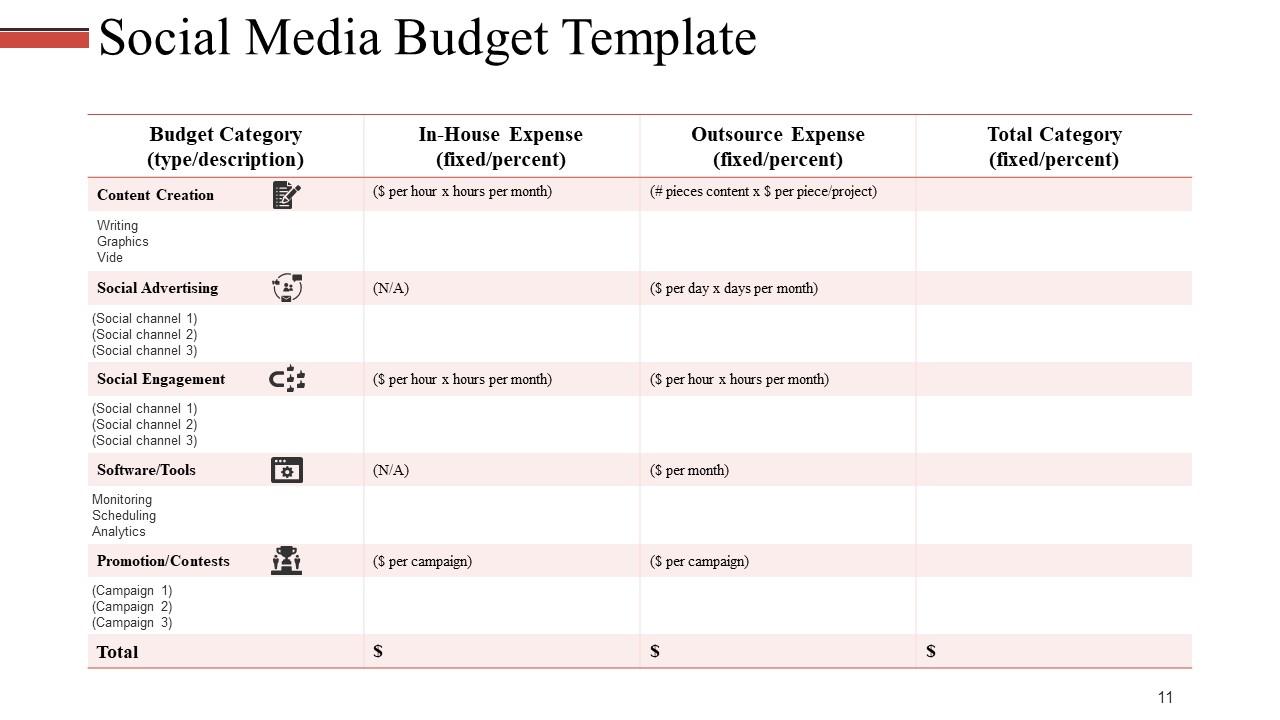
Slide 11: This slide presents Social Media Budget Template in a tabular form. Use it to show your own social media budget.
Slide 12: This is Revenue Budget Icon Slide. Use/ add icons as per your requirement.
Slide 13: This slide shows the Coffee Break image. You can alter the content as per need.
Slide 14: This slide is titled Charts & Graphs to move forward. You may change it as per requirement.
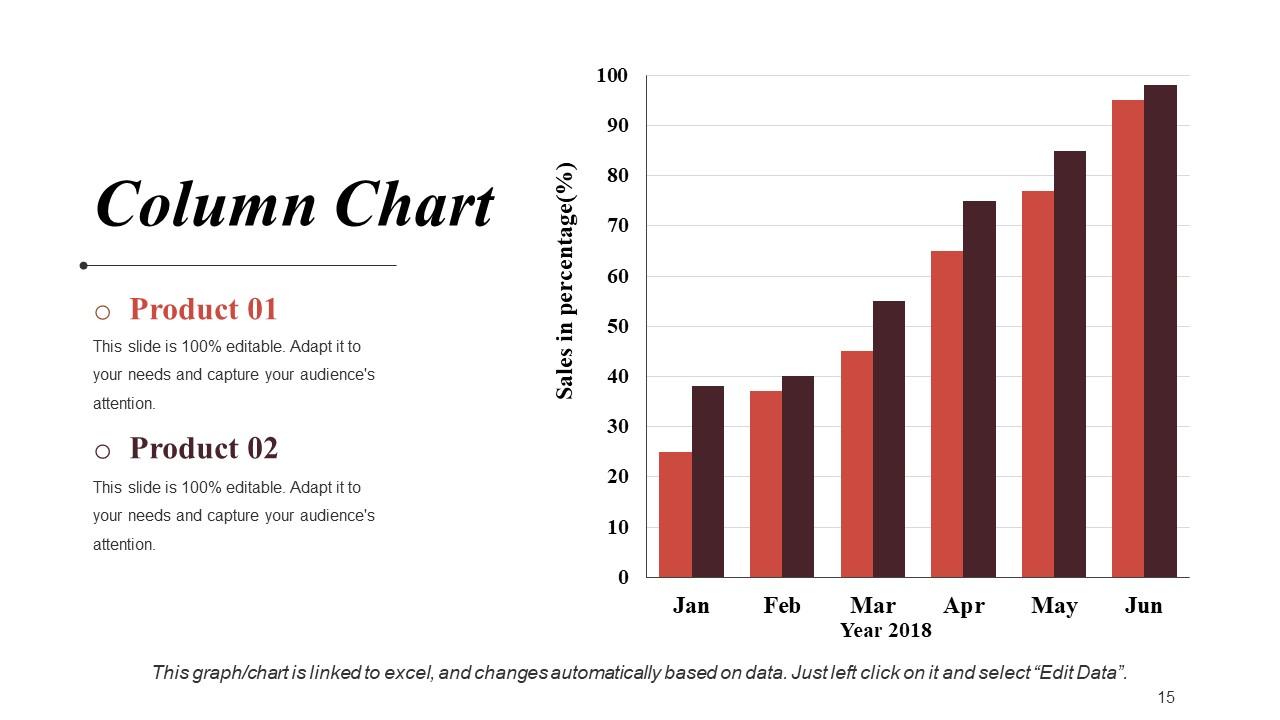
Slide 15: This is a Column Chart slide for product/ entity comparison.
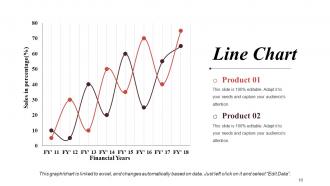
Slide 16: This is a Line Chart slide for product/ entity comparison.
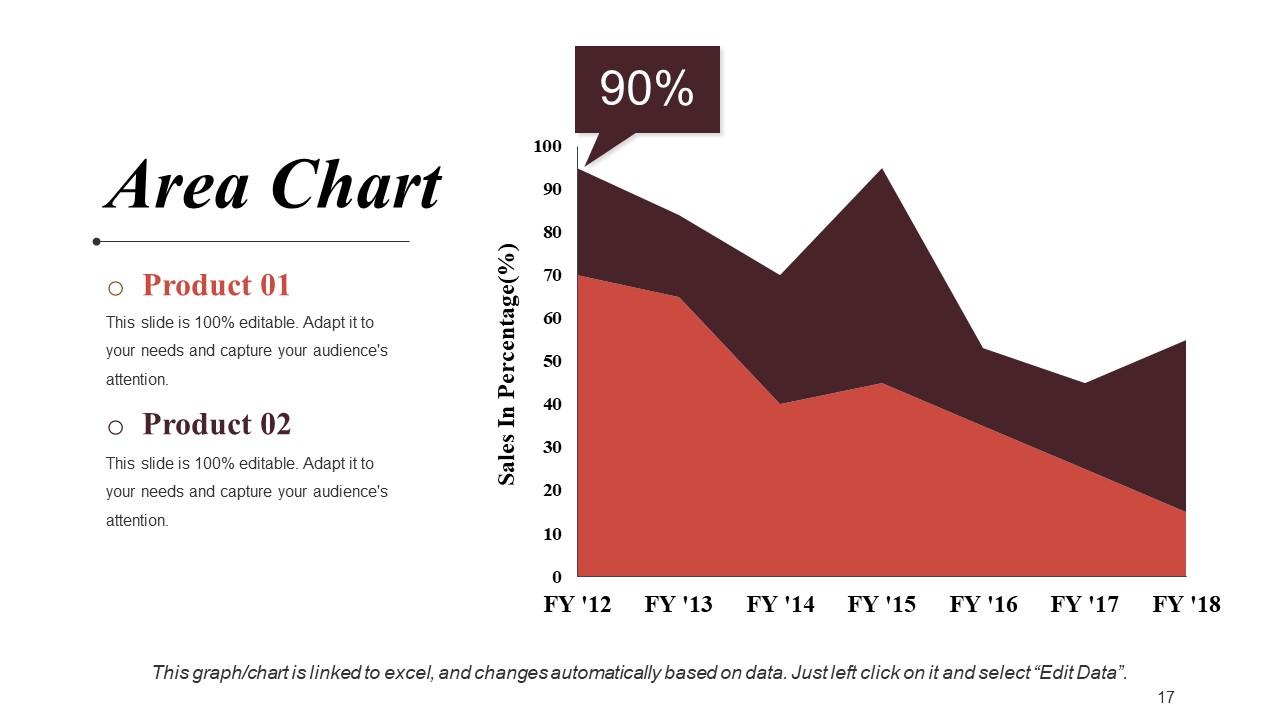
Slide 17: This is an Area Chart slide for product/ entity comparison.
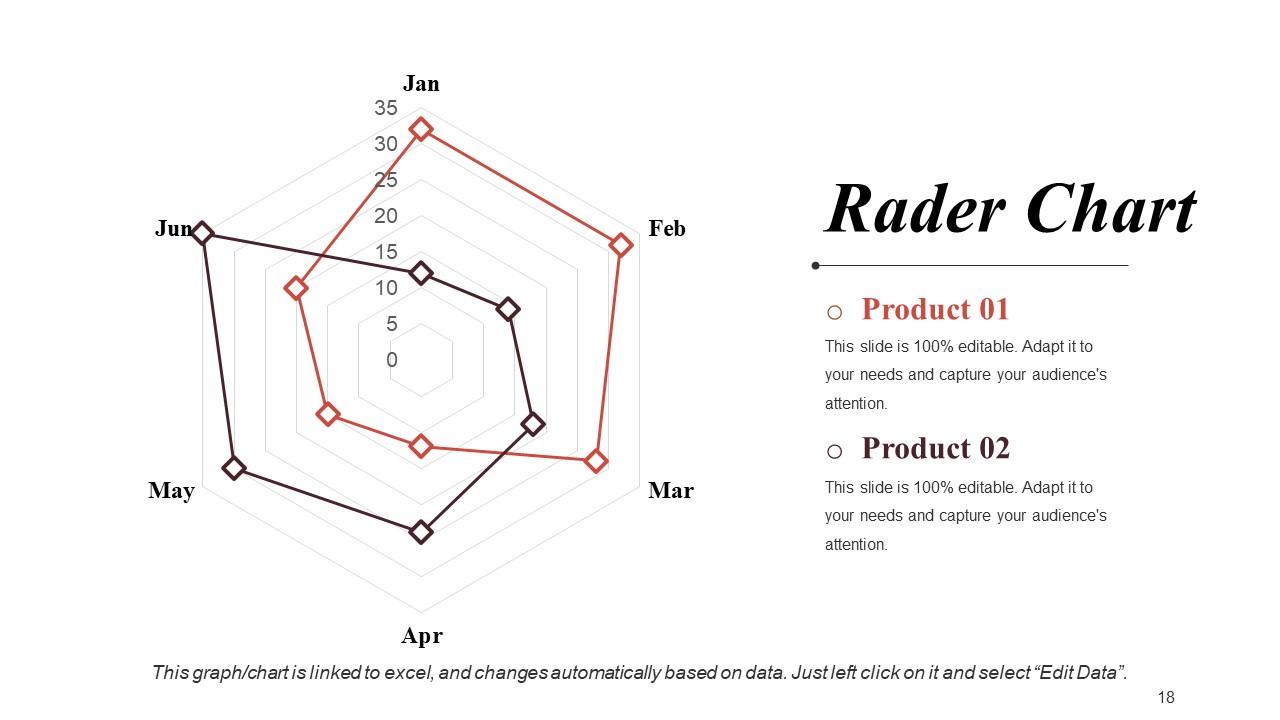
Slide 18: This is a Radar Chart slide for product/ entity comparison.
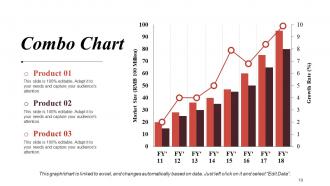
Slide 19: This is a Combo Chart slide to present product/ entity comparison, specifications etc.
Slide 20: This slide is titled Additional Slides. You can change the slide content as per your needs.
Slide 21: This slide contains Our Mission with text boxes.
Slide 22: This is an About Us slide. State company or team specifications here.
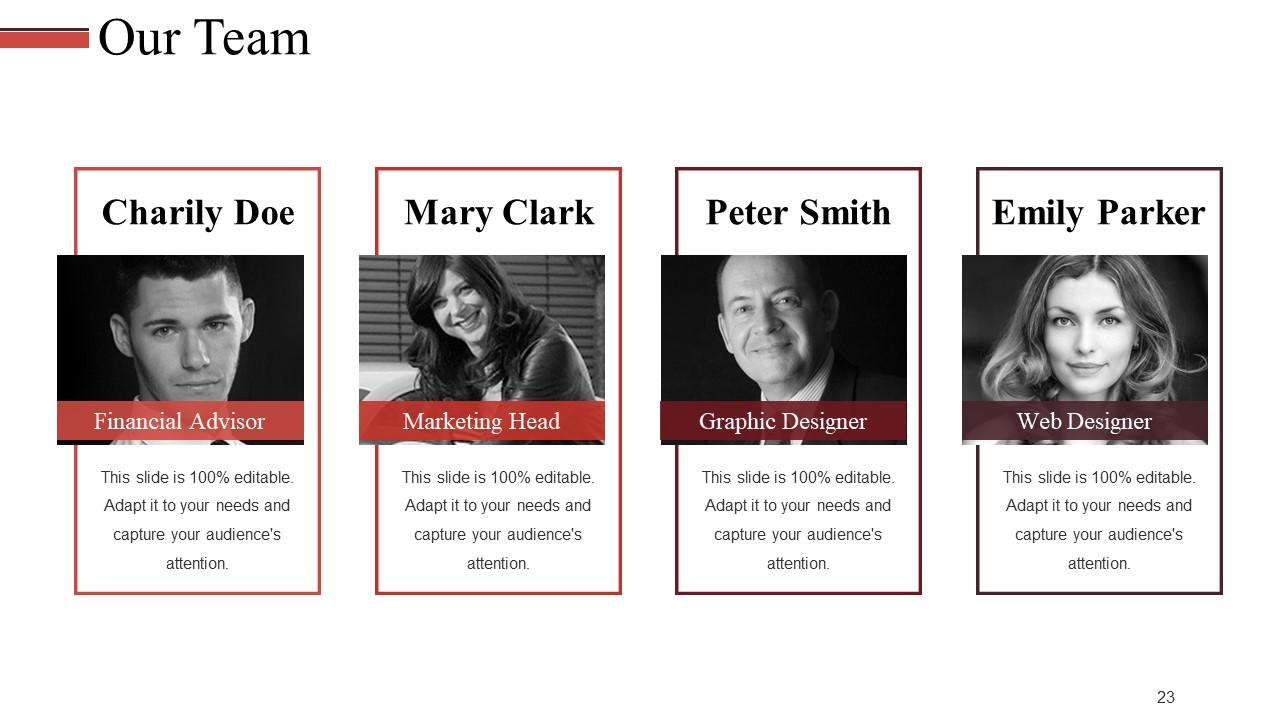
Slide 23: This slide presents Our Team with name, designation and image box.
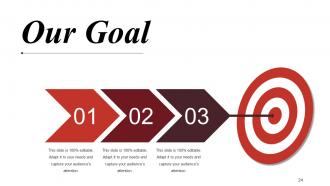
Slide 24: This slide shows Our Goal. State your goals here.
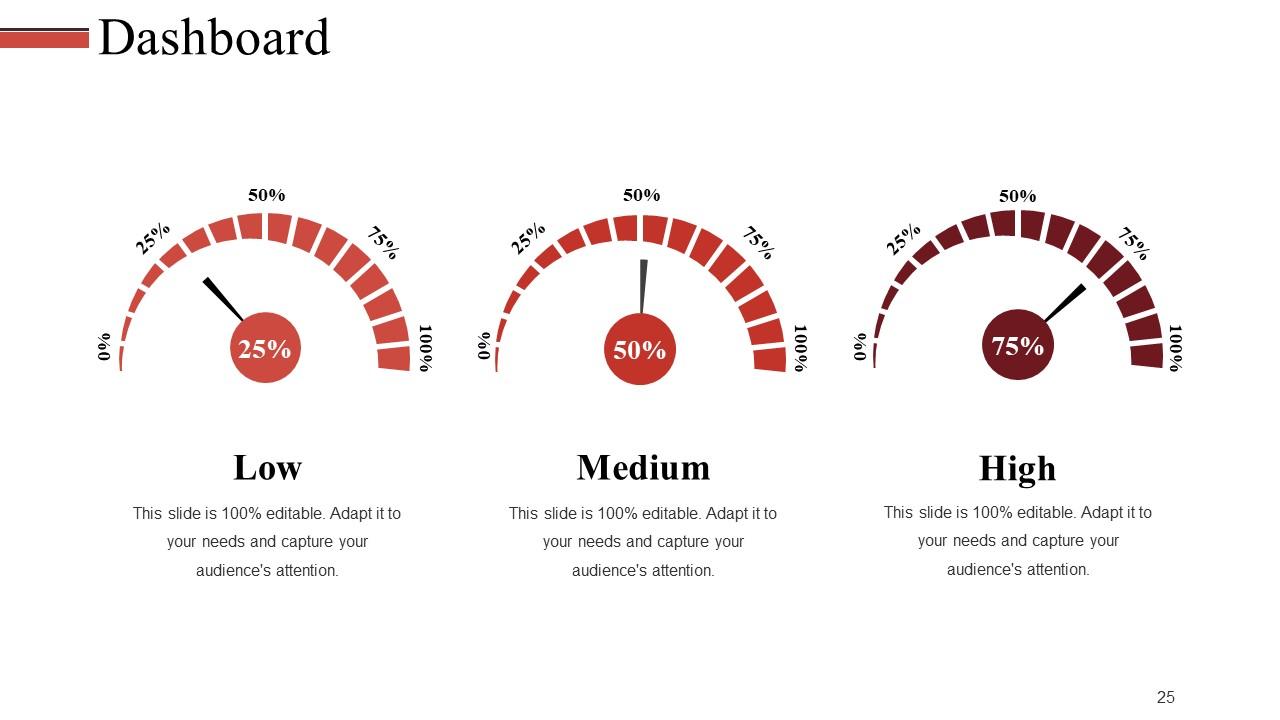
Slide 25: This slide presents the Dashboard with low, medium and high parameters.
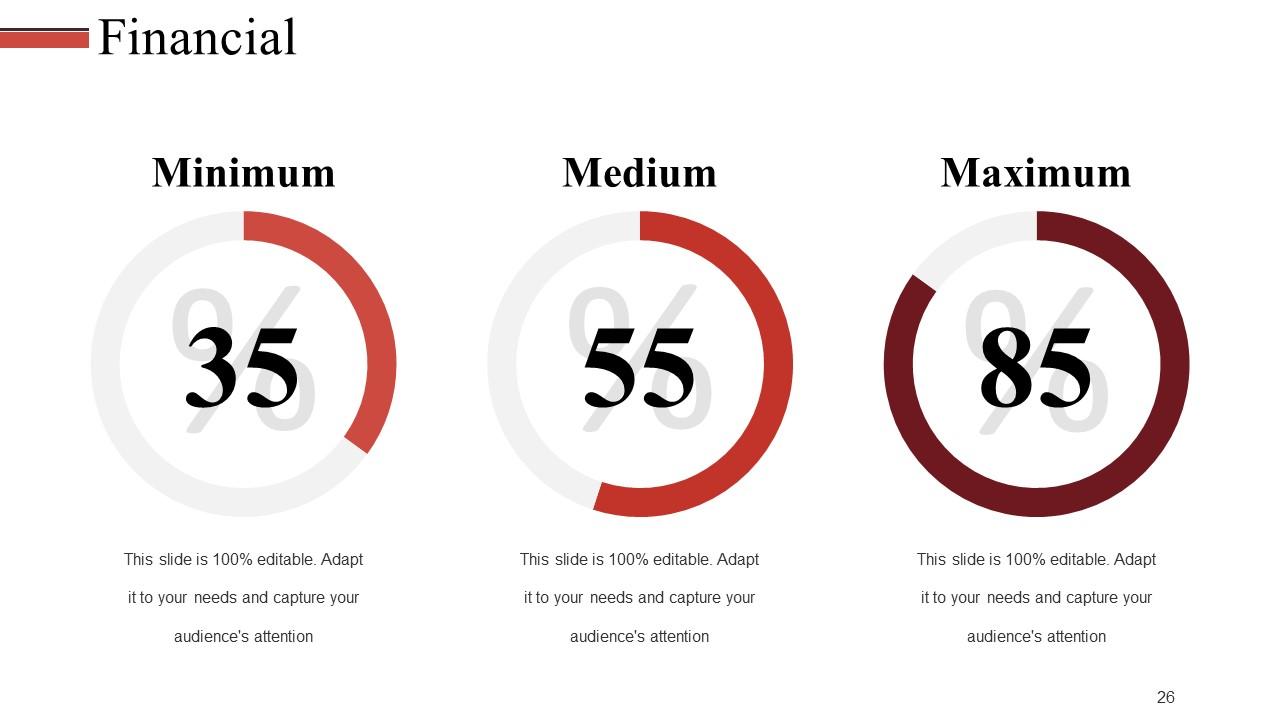
Slide 26: This slide presents Financial scores to display.
Slide 27: This is a Quotes slide to convey message, beliefs etc.
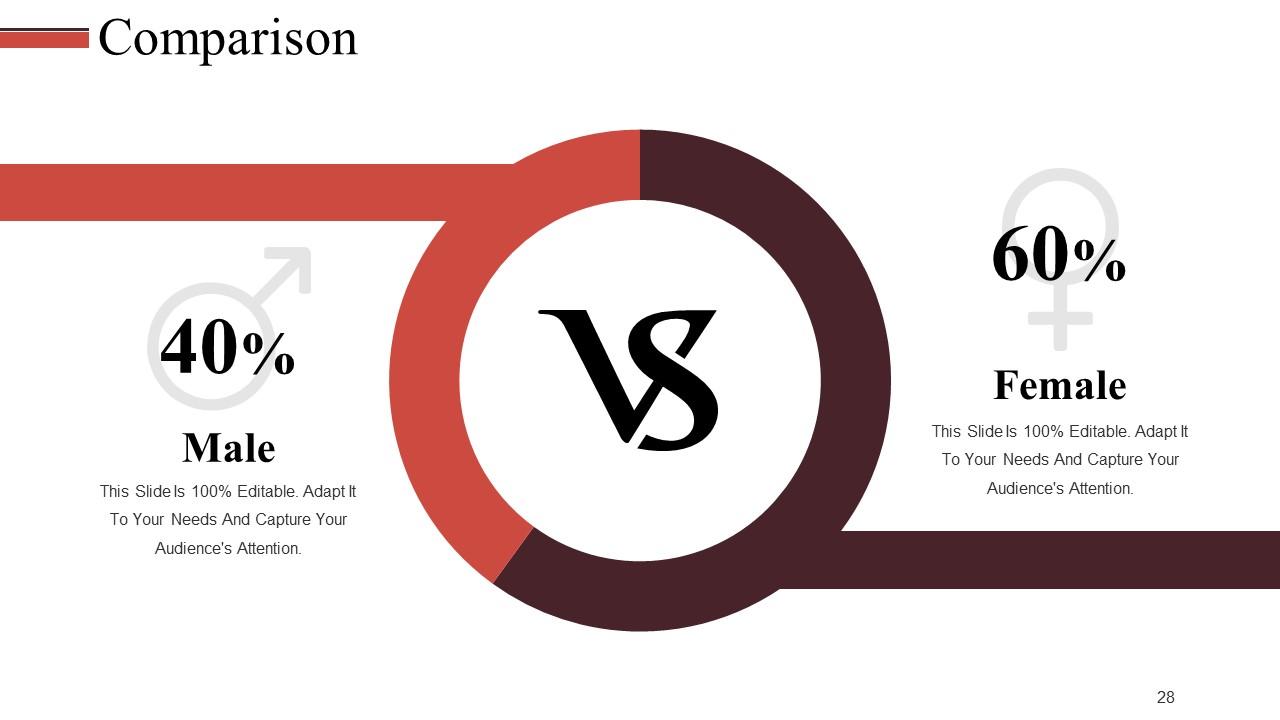
Slide 28: This is a Comparison slide to show comparison of two entities.
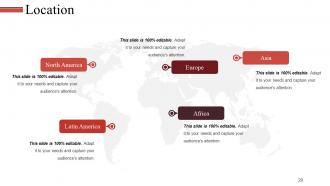
Slide 29: This is a Location slide to show global growth, presence etc. on a world map image.
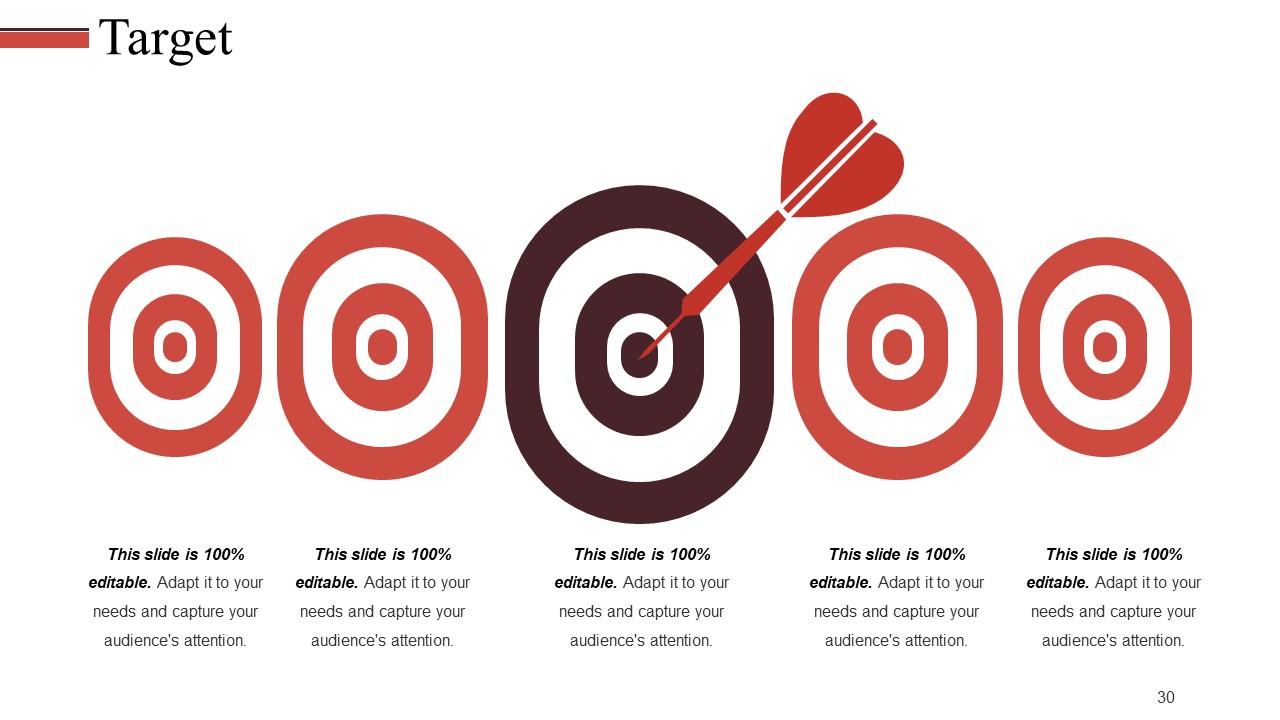
Slide 30: This slide shows Target image with text boxes
Slide 31: This is a Puzzle image slide to show information, specifications etc.
Slide 32: This is a Circular image slide. State information, specifications etc. here.
Slide 33: This is a Lego image slide to show information, specifications etc.
Slide 34: This is a Silhouettes slide to show people related information, specifications etc.
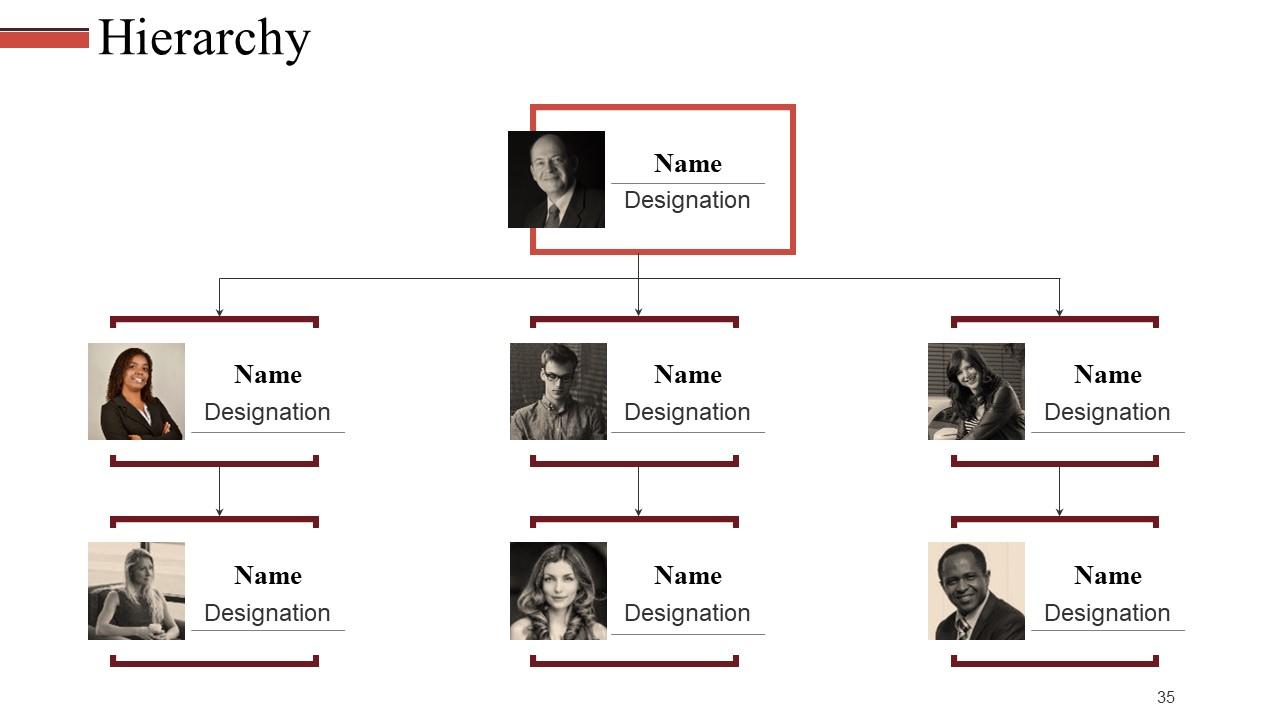
Slide 35: This is a Hierarchy slide to show information, organization structural specifications etc.
Slide 36: This is a Venn diagram image slide to show information, specifications etc.
Slide 37: This is a Mind map image slide to show information, specifications etc.
Slide 38: This is a Magnifying Glass image slide to show information, specifications etc.
Slide 39: This is a Bulb or Idea image slide to show ideas, innovative information etc.
Slide 40: This is a Thank You slide with Address# street number, city, state, Contact Numbers, Email Address.
Revenue budget powerpoint presentation slides with all 40 slides:
Implement the drill with our Revenue Budget Powerpoint Presentation Slides. Guide folks through the emergency actions.
-
Great quality slides in rapid time.
-
Top Quality presentations that are easily editable.


