Capital Structure Approaches For Financial Decision Making Fin CD
Check out our professionally designed Capital Structure Approaches For Financial Decision-making PowerPoint Template. This Capital Structure Decisions PPT covers an overview of a capital structure containing key components, features, benefits, driving factors, and key elements. Further, this Capital Structure Approaches presentation shows examples of the debt-equity ratio and other KPIs. Moreover, the Capital Structure Theories deck illustrates capital structure decision-making based on various approaches to find an optimal capital structure. Also, this Financial Planning module presents different approaches, i.e., the Net Income approach, the Traditional approach, the M and M theory, and many more. Lastly, this Financial Decision-making PowerPoint covers emerging trends in capital structure, regulatory framework, and capital structure analysis in different industries. Get access to this powerful Template now.
You must be logged in to download this presentation.
PowerPoint presentation slides
Deliver this complete deck to your team members and other collaborators. Encompassed with stylized slides presenting various concepts, this Capital Structure Approaches For Financial Decision Making Fin CD is the best tool you can utilize. Personalize its content and graphics to make it unique and thought-provoking. All the ninety two slides are editable and modifiable, so feel free to adjust them to your business setting. The font, color, and other components also come in an editable format making this PPT design the best choice for your next presentation. So, download now.
People who downloaded this PowerPoint presentation also viewed the following :
Content of this Powerpoint Presentation
Slide 1: The slide introduces Capital Structure Approaches For Financial Decision-Making. State your Company name and begin.
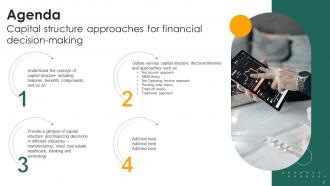
Slide 2: This is an Agenda slide. State your agendas here.
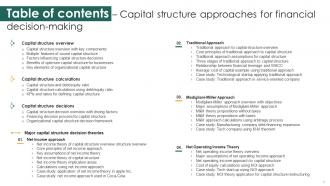
Slide 3: The slide displays Table of contentsfor the presentation.
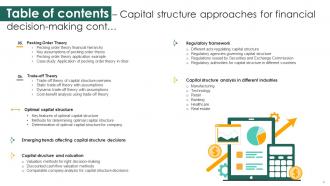
Slide 4: The slide continues Table of contents.
Slide 5: The slide renders Table of contents further.
Slide 6: This slide represents the overview of capital structure containing its description and key components such as common equity, preferred stock and debt.
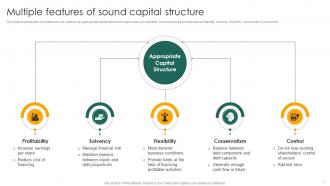
Slide 7: This slide illustrates the key features to be added in an appropriate capital structure to gain maximum benefits.
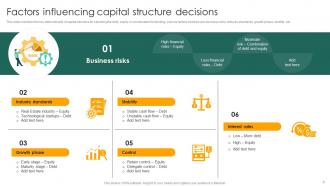
Slide 8: This slide mentions the key determinants of capital structure for selecting the debt, equity or combination for funding.
Slide 9: This slide highlights the key benefits of having an optimum capital structure.
Slide 10: This slide represents various components of capital structure for raising funds to finance the company’s operations and growth opportunities.
Slide 11: The slide displays Title of contents further.
Slide 12: This slide represents the measurement of capital structure along with the debt/equity ratio.
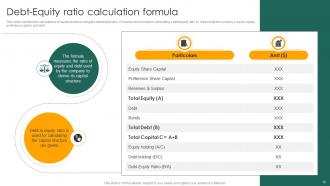
Slide 13: This slide mentions the calculations of capital structure using the debt/equity ratio.
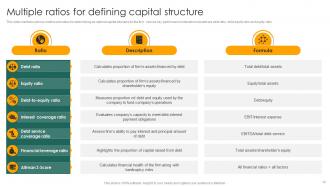
Slide 14: This slide highlights various metrics and ratios for determining an optimal capital structure for the firm.
Slide 15: The slide shows another Title of contents.
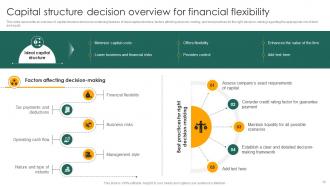
Slide 16: This slide represents an overview of capital structure decisions containing features of ideal capital structure, factors affecting decision-making, etc.
Slide 17: This slide displays the financing decision process for getting an optimal capital structure to maximize the value of the firm.
Slide 18: This slide highlights the framework for capital structure decisions.
Slide 19: The slide contains Title of contents further.
Slide 20: This slide highlights the different capital structure theories used by the companies to balance equity and debt capital.
Slide 21: The slide presents Title of contents which is to be discussed further.
Slide 22: This slide mentions an overview of net income theory containing various information.
Slide 23: This slide highlights the core principles of applying the net income approach.
Slide 24: This slide highlights the major assumptions of the net income theory.
Slide 25: This slide represents the concept of net income theory by explaining the diagram.
Slide 26: This slide indicates the various application areas of the net income theory by the organizations.
Slide 27: This slide highlights the calculations of the overall cost of capital using the formula suggested by the net income approach.
Slide 28: This slide renders the case study of Apple Inc. indicating the application of Net Income (NI) theory in the company.
Slide 29: This slide depicts the case study of The Coca-Cola Company highlighting the applications of net income theory in balancing debt and equity.
Slide 30: The slide represents Title of contents which is to be discussed further.
Slide 31: This slide provides an overview of the traditional approach to capital structure for managing financial risks and distress.
Slide 32: This slide mentions the core principles along with key takeaways to ensure the implementation of optimal capital structure using the traditional approach.
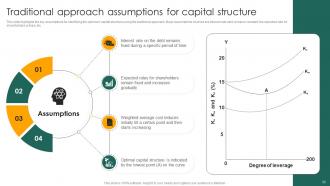
Slide 33: This slide highlights the key assumptions for identifying the optimum capital structure using the traditional approach.
Slide 34: This slide represents the three major stages of balancing debt and equity financing as per the traditional approach for getting an optimum capital structure. The stages indicate relation between the cost of capital and the degree of leverage.
Slide 35: This slide covers an illustration showing the relation between company’s financial leverage and weighted average cost of capital.
Slide 36: This slide provides an example of a traditional approach indicating the calculations of earning available to shareholders.
Slide 37: This slide represents the case study of a technological startup company indicating the applications of traditional approach to balance its capital structure.
Slide 38: This slide renders the case study of service-oriented company showing the application of a traditional approach for getting various benefits.
Slide 39: The slide displays Title of contents further.
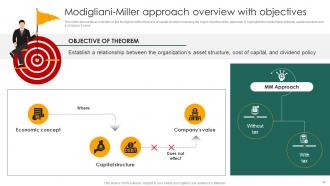
Slide 40: This slide represents an overview of the Modigliani-Miller theorem of capital structure including the major objective of the approach.
Slide 41: This slide highlights the key assumptions of the Modigliani-Miller theorem for defining the capital structure.
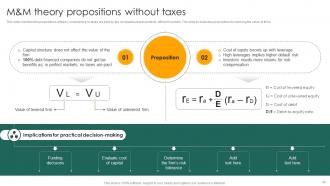
Slide 42: This slide mentions the propositions of theory considering no taxes are paid by the companies due to perfectly efficient markets.
Slide 43: This slide displays the propositions of theory considering taxes are paid by the companies highlighting the relation between cost of capital.
Slide 44: This slide renders the calculations of the value of investment and returns using the arbitrage process of the Modigliani-Miller approach.
Slide 45: This slide represents the case study of a manufacturing company using the M&M approach for defining the relation between cost of capital.
Slide 46: This slide carries an overview of a technological startup company applying the approach of Modigliani-Miller to find an optimum capital structure.
Slide 47: The slide displays Title of contents further.
Slide 48: This slide carries an overview of the net operating income approach including core principles.
Slide 49: This slide represents the key assumptions on which the Net Operating Income approach is based.
Slide 50: This slide depicts the concept of the net operating income approach to highlight the relation between capital structure and the value of the firm.
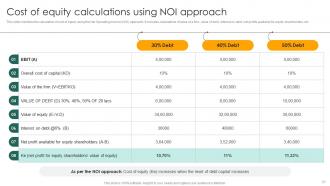
Slide 51: This slide mentions the calculation of cost of equity using the Net Operating Income (NOI) approach.
Slide 52: This slide presents the case study of a tech startup company using the NOI approach to meet its financial requirements.
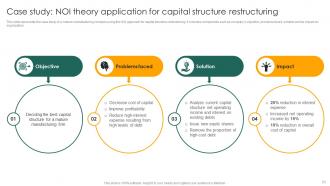
Slide 53: This slide covers the case study of a mature manufacturing company using the NOI approach for capital structure restructuring.
Slide 54: The slide depicts Title of contents further.
Slide 55: This slide represents the financial hierarchy as given by the pecking order theory to understand the preferences of management.
Slide 56: This slide highlights the key assumptions of the pecking order theory.
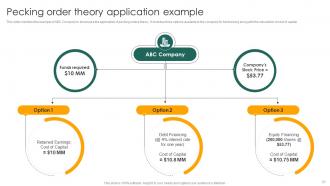
Slide 57: This slide mentions the example of ABC Company to showcase the application of pecking orders theory.
Slide 58: This slide represents the case study of Uber company using the Pecking Order theory for sourcing funds for the organization.
Slide 59: The slide renders another Title of contents.
Slide 60: This slide represents an overview of the trade-off theory for balancing the advantages and disadvantages of using debt and equity in the capital structure.
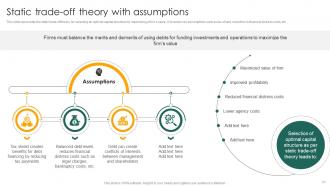
Slide 61: This slide highlights the static trade-off theory for selecting an optimal capital structure for maximizing a firm’s value.
Slide 62: This slide covers an overview of dynamic approach for the trade-off theory to select the right balance of debt and equity.
Slide 63: This slide represents the framework for illustrating a cost-benefit analysis of debt financing with the help of trade-off theory to capital structure.
Slide 64: The slide depicts Title of contents which is to be discussed further.
Slide 65: This slide represents the main features of an optimal capital structure to be used by the company to maximize its value.
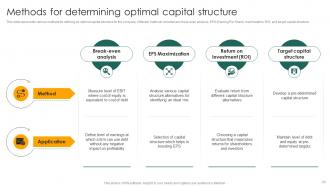
Slide 66: This slide presents various methods for defining an optimal capital structure for the company.
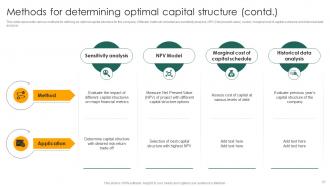
Slide 67: This slide renders other various methods for defining an optimal capital structure for the company.
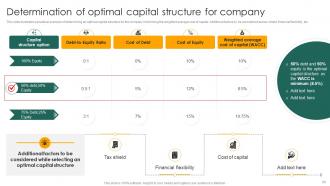
Slide 68: This slide illustrates a practical example of determining an optimal capital structure for the company minimizing the weighted average cost of capital.
Slide 69: The slide displays Title of contents further.
Slide 70: This slide demonstrates various emerging trends influencing the decisions of companies regarding capital structure.
Slide 71: This slide again renders various emerging trends influencing the decisions of companies regarding capital structure.
Slide 72: The slide depicts Title of contents which iis to be discussed further.
Slide 73: This slide highlights different methods of evaluating the company’s assets to make accurate decisions regarding capital structure.
Slide 74: This slide illustrates an example indicating the evaluation of an ideal capital structure using the discounted cash flow (DCF) method.
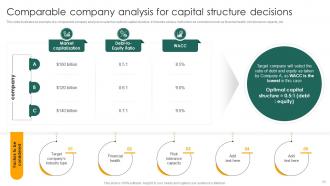
Slide 75: This slide provides an example of a comparable company analysis to select an optimal capital structure.
Slide 76: The slide renders Title of contents which is to be discussed further.
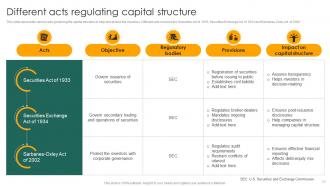
Slide 77: This slide represents various acts governing the capital structure to help and protect the investors.
Slide 78: This slide illustrates various agencies responsible for enforcing laws and regulations regarding capital structure.
Slide 79: This slide exhibits various regulations issued by the SEC to govern and control activities related to capital structure.
Slide 80: This slide demonstrates various authorities responsible for regulating capital structure in different countries.
Slide 81: The slide covers Title of contents further.
Slide 82: This slide carries a capital structure analysis for determining levels of debt and equity in manufacturing industry.
Slide 83: This slide covers a capital structure analysis for determining levels of debt and equity in the technology industry.
Slide 84: This slide presents a capital structure analysis for determining retail industry debt and equity levels.
Slide 85: This slide carries a capital structure analysis for determining levels of debt and equity in banking industry.
Slide 86: This slide demonstrates a capital structure analysis for determining levels of debt and equity in healthcare industry.
Slide 87: This slide carries a capital structure analysis for determining levels of debt and equity in the real estate industry.
Slide 88: This slide shows all the icons included in the presentation.
Slide 89: This slide is titled as Additional Slides for moving forward.
Slide 90: The slide renders Risk return trade-off in capital structure decisions.
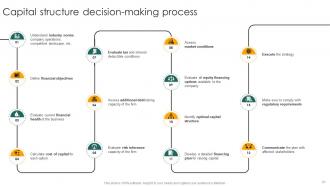
Slide 91: The slide provides Capital structure decision-making process.
Slide 92: This is a Thank You slide with address, contact numbers and email address.
Capital Structure Approaches For Financial Decision Making Fin CD with all 101 slides:
Use our Capital Structure Approaches For Financial Decision Making Fin CD to effectively help you save your valuable time. They are readymade to fit into any presentation structure.
-
Their templates are super easy to edit and use even for the one like me who is not familiar with PowerPoint. Great customer support.
-
Illustrative design with editable content. Exceptional value for money. Highly pleased with the product.


