Capsim scorecard powerpoint presentation slides
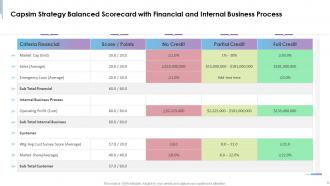
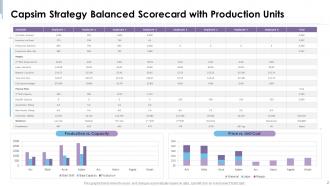
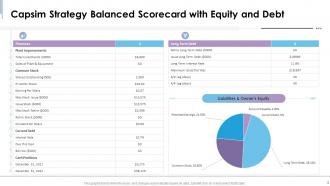
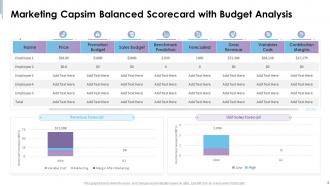
A balanced scorecard is a strategic assessment and performance metric tool which organizations can use to improve internal operations and functions. Check out our professionally designed CAPSIM Strategy Scorecard, which the organization can use to examine score and credit points based on pre-defined criteria such as market capitalization, sales, emergency loan, etc. Our powerful PowerPoint presentation covers a scorecard that provides information about different employees schedules, margins, physical plant, and workforce capacity. This PPT includes a scorecard through which corporations can get detailed information about the sales of plant and equipment, shares outstanding, dividend per share, current debt, etc. The template also helps in exhibiting cash position, long-term debt and percentage of liabilities, and owners equity position. Lastly, it covers a budget analysis scorecard which can assist organizations in identifying gross revenue and contribution margin of various employees. Customize this 100 percent editable and insightful template based on your specific business needs. Get access now.
You must be logged in to download this presentation.
 Impress your
 audience
Editable
of Time
PowerPoint presentation slides
This complete presentation has PPT slides on wide range of topics highlighting the core areas of your business needs. It has professionally designed templates with relevant visuals and subject driven content. This presentation deck has total of seventeen slides. Get access to the customizable templates. Our designers have created editable templates for your convenience. You can edit the color, text and font size as per your need. You can add or delete the content if required. You are just a click to away to have this ready-made presentation. Click the download button now.
People who downloaded this PowerPoint presentation also viewed the following :
Content of this Powerpoint Presentation
Slide 1: This slide displays title i.e. 'Capsim Scorecard'.
Slide 2: This slide introduces Capsim Strategy Balanced Scorecard with Financial and Internal Business Process.
Slide 3: This slide shows Capsim Strategy Balanced Scorecard with Production Units.
Slide 4: This slide presents Capsim Strategy Balanced Scorecard with Equity and Debt.
Slide 5: This slide shows Marketing Capsim Balanced Scorecard with Budget Analysis.
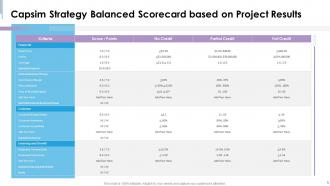
Slide 6: This slide displays Capsim Strategy Balanced Scorecard based on Project Results.
Slide 7: This slide is titled as Additional Slides for moving forward.
Slide 8: This slide shows Icons for Capsim Strategy Balanced Scorecard.
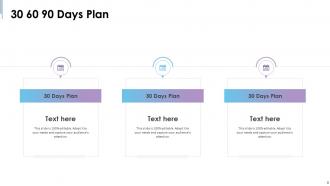
Slide 9: This slide presents 30 60 90 Days Plan with text boxes.
Slide 10: This is Our Team slide with names and designation.
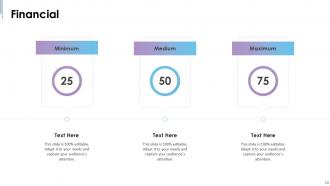
Slide 11: This is a Financial slide. Show your finance related stuff here.
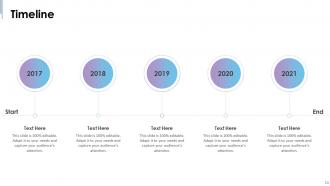
Slide 12: This is a Timeline slide. Show data related to time intervals here.
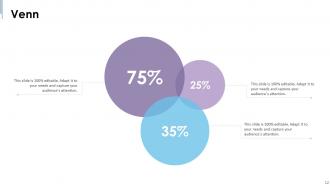
Slide 13: This slide shows Venn diagram with text boxes.
Slide 14: This slide presents Post It Notes. Post your important notes here.
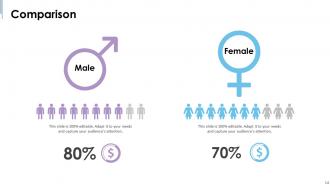
Slide 15: This is a Comparison slide to state comparison between commodities, entities etc.
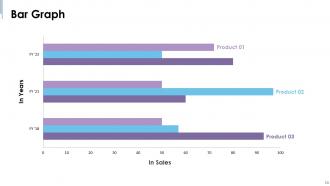
Slide 16: This slide displays Bar Graph chart with three products comparison.
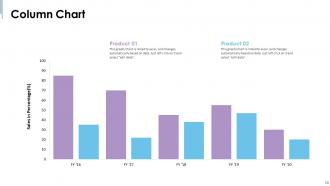
Slide 17: This slide represents Column chart with two products comparison.
Slide 18: This is a Thank You slide with address, contact numbers and email address.
Capsim scorecard powerpoint presentation slides with all 18 slides:
Use our Capsim Scorecard Powerpoint Presentation Slides to effectively help you save your valuable time. They are readymade to fit into any presentation structure.
-
Best Representation of topics, really appreciable.
-
Visually stunning presentation, love the content.
-
Illustrative design with editable content. Exceptional value for money. Highly pleased with the product.
-
Great designs, really helpful.
-
Top Quality presentations that are easily editable.
-
Illustrative design with editable content. Exceptional value for money. Highly pleased with the product.
-
Informative presentations that are easily editable.


