Case competition oil and gas industry challenges powerpoint presentation slides
Our case competition oil and gas industry challenges PowerPoint template helps you identify the key problems and challenges faced by companies in the oil and gas sector. It offers recommendations and risk management strategies to help you tackle these challenges. This operational challenges in the oil and gas industry PPT slideshow gives you the industry overview, including future growth perspective, recent and prospective trends, key factors that affect growth, and more. Our oil and gas industry trends and challenges PPT theme helps you to explore key performance indicators and key market players. It helps you devise a plan of action to meet those parameters and get on the route to growth and success. This oil and gas industry strategic recommendations PPT layout explains risk management strategies to secure your company against potential dangers that threaten to wreck your company. Download our oil and gas industry inspection PPT set today.
You must be logged in to download this presentation.
PowerPoint presentation slides
Presenting our notable case competition oil and gas industry challenges PowerPoint template. This PPT presentation is available for download in both standard and widescreen formats. You can easily edit the content inside the PPT design. It is compatible with all prominent presentation software, including Microsoft Office and Google Slides, among others. This PPT slide can also be edited for print and digital formats such as JPEG, PNG, and PDF.
People who downloaded this PowerPoint presentation also viewed the following :
Content of this Powerpoint Presentation
Slide 1: This is the title slide for Case Competition Challenges in the Oil and Gas Industry.
Slide 2: This slide shows the Agenda for this presentation including points such as identify the key problems and challenges faced by the companies of oil and gas sector, provide recommendations and risk management strategies, and provide an industry overview, including market size, future growth perspective, recent & upcoming trends, key facts that affect growth.
Slide 3: This slide displays the table of contents covering headings such as Oil and Gas Industry Market Size, Key Challenges Faced by Oil and Gas Companies, External Challenges Faced by the Oil and Gas Sector Companies, Factors that Affect the Price of Crude Oil, Oil Prices Fluctuations Over the Period (1960 – 2020), Price Comparison Between Crude Oil and Natural Gas, Government Regulations that Affect the Oil and Gas Sector, Guidelines Under Environmental Policy to Protect Environment, Substitute of Crude Oil and Natural Gas, Key Market Players in the Oil and Gas Industry, Top Five Oil Producing Countries, The Organization of the Petroleum Exporting Countries (OPEC), Recent Trends that Might Transform the Oil and Gas Industry Outlook, Upcoming (for 2020 and 2021) Trends in USA Oil and Gas Industry, Key Performance Indicator to Track the Performance of Oil and Gas Company, Wells Up-Time Analysis Dashboard, Oil and Gas Well Summary Dashboard, Oil and Gas Production Monitoring Dashboard, Oil and Gas Production Dashboard, Strategic Recommendations for Growth in Oil and Gas Industry, Future Growth Prospective of Oil and Gas (2030), Case Study of Using Analytical Solution to Monitor Gas Data, Case Study of Downstream Oil and Gas Industry Research, and Major Risks and Risk Management Strategies.
Slide 4: This slide showcases the Oil and Gas Industry Market Size with a detailed bar graph and a dedicated section to list the key facts.
Slide 5: This slide presents the Key Challenges Faced by Oil and Gas Companies including Growing visibility, Improve collaboration, Develop a high-performing culture, Make the connection, Use metrics, Get senior executives, and Create networks of excellence.
Slide 6: This slide shows the External Challenges Faced by the Oil and Gas Sector Companies covering Corporate Social Responsibility, Substitute Fuels, Government Regulations, and Growing Fuel Prices.
Slide 7: This slide displays the Factors that Affect the Price of Crude Oil such as Demand of Oil, Supply of Oil, Geopolitical, Prices of US Dollar, Future Traders, and Other Factors.
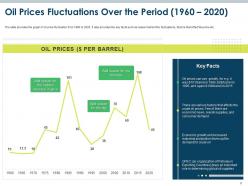
Slide 8: This slide showcases the Oil Prices Fluctuations Over the Period (1960 – 2020) with a detailed line graph and a separate section to add key facts.
Slide 9: This slide presents the Price Comparison Between Crude Oil and Natural Gas with a detailed comparison bar and line graph and a separate section to add key facts.
Slide 10: This slide shows the Government Regulations that Affect the Oil and Gas Sector including The Clean Air Act, US Energy Policy, Health, and Safety Standards.
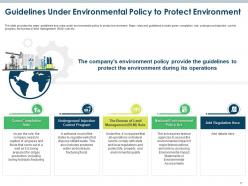
Slide 11: This slide provides the major Guidelines Under Environmental Policy to Protect Environment such as green completion rule, underground injection control program, the bureau of land management (BLM) rule, etc.
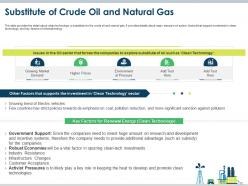
Slide 12: This slide demonstrates the need for Substitute of Crude Oil and Natural Gas including Growing Market Demand, Higher Prices, and Environmental Pressure.
Slide 13: This slide displays the Key Market Players in the Oil and Gas Industry with their Headquarters country and production metrics with respect to their market share.
Slide 14: This slide showcases the top Five Oil Producing Countries on a world map with their percentage share.
Slide 15: This slide presents The Organization of the Petroleum Exporting Countries (OPEC) on the world map with a dedicated section for key facts.
Slide 16: This slide shows the Recent Trends that Might Transform the Oil and Gas Industry Outlook including Focus on Infrastructure, Increased Sustainability, Growth in Natural Gas, Focus on Technology, and Increased Connectivity and Labour Cost.
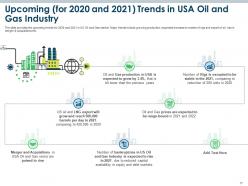
Slide 17: This slide demonstrates the Upcoming (for 2020 and 2021) Trends in the USA Oil and Gas Industry with relevant icons and flows diagram format.
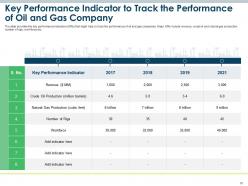
Slide 18: This slide showcases the Key Performance Indicator to Track the Performance of Oil and Gas Company over four years from 2017 to 2021.
Slide 19: This slide presents the Major Risks and Risk Management Strategies such as economic, environmental, operational, political, and resource-related risks.
Slide 20: The slide provides a case study of downstream oil and gas industry research with its associated challenges, the processes, and the result.
Slide 21: This slide shows the Case Study of Using Analytical solutions to Monitor Gas Data. The slide provides a case study of an oil and gas company that wants to use a new analytical solution to track and analyze its oil and gas data. The case includes the challenge (a major point of concern), the solution (key points to solve the issue), and the result (outcome of the process).
Slide 22: This slide covers the future growth prospects of oil and gas for the year 2030.
Slide 23: This slide displays the Strategic Recommendations for Growth in the Oil and Gas Industry such as Develop Commercially Competitive Service, Invest in New Technologies, Follow Effective Risk Mitigation Strategies, and Build Loyal Customer Base to Get Long Term Benefits.
Slide 24: This slide showcases the Oil and Gas Production Dashboard covering the Top 5 Average Monthly Production by Company, Top 5 Average yearly Production by Company, Top 5 Average Monthly Production by Company, and Top 5 Average yearly Production by Company.
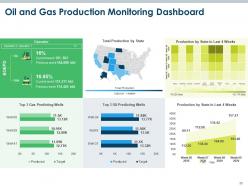
Slide 25: This slide demonstrates the Oil and Gas Production Monitoring Dashboard with Operator, Total Production by State, Production by State in Last 4 Weeks, Top 3 Gas Predicting Wells, Top 3 Oil Predicting Wells, and Production by State in Last 4 Weeks.
Slide 26: This slide presents the Oil and Gas Well Summary Dashboard with details on the Operator, Wells Count by Purpose, Downtime Well Count by Reason, Well Details, and Gross vs Net Well Count.
Slide 27: This slide shows the Wells Up-Time Analysis Dashboard including chats on Wells Count vs. Production Months, Average number of Production Months by County, and Average Number of Production Months by Company.
Slide 28: This slide provides you with the additional icons for the presentation on the Case Competition-Oil and Gas Industry Challenges Icons Slide.
Slide 29: This slide introduces the Additional Slides given with this presentation.
Slide 30: This is the About Us slide highlighting points such as We Are Talented, We Are Professional, and We Are Successful.
Slide 31: This slide shows Our Mission with details on your company's Vision, Mission, and Goals.
Slide 32: This slide introduces your company's team with their Name, Designation, Image, and additional details.
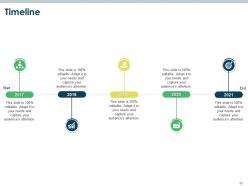
Slide 33: This slide presents the project Timeline over five years from 2017 to 2021.
Slide 34: This slide shows a dual Line Chart for marking details for two products over the years 2016 to 2021. This graph is linked to excel and changes automatically based on data. Just left-click on it and select “Edit Data”.
Slide 35: This slide displays a Stock Chart for two products showing profit earned over the years 2013 to 2021. This graph is linked to excel and changes automatically based on data. Just left-click on it and select “Edit Data”.
Slide 36: This slide shows three text sections in the Post-it Notes format to highlight key data.
Slide 37: This slide showcases the 30 60 90 Days Plan to plan for your project.
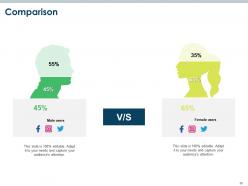
Slide 38: This slide shows the Comparison between genders over social media engagement.
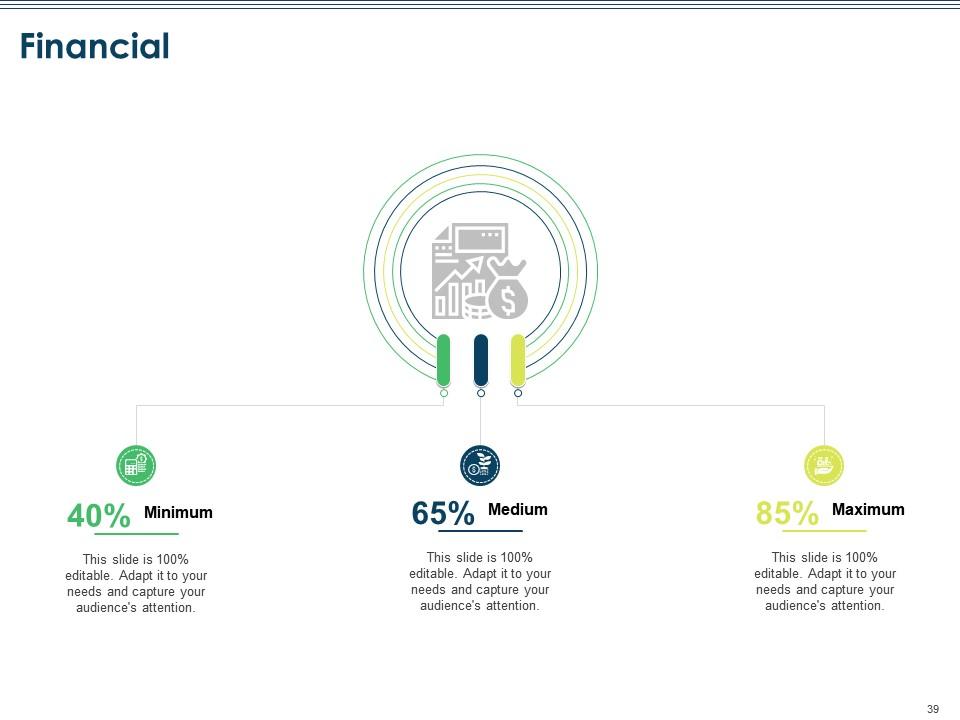
Slide 39: This slide shows the Financial status for your project under minimum, medium, and maximum stages.
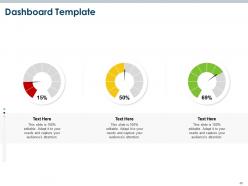
Slide 40: This slide shows the Dashboard Template with three levels under red, yellow, and green stages.
Slide 41: This is the thank you slide covering the company's Address, Contact Number, and Email Address.
Case competition oil and gas industry challenges powerpoint presentation slides with all 41 slides:
Use our Case Competition Oil And Gas Industry Challenges Powerpoint Presentation Slides to effectively help you save your valuable time. They are readymade to fit into any presentation structure.
-
Appreciate the research and its presentable format.
-
Out of the box and creative design.
-
Presentation Design is very nice, good work with the content as well.
-
Great product with highly impressive and engaging designs.
-
Graphics are very appealing to eyes.
-
Designs have enough space to add content.


