Clustering Algorithms In Machine Learning Training Ppt

Rating:
90%
Clustering Algorithms In Machine Learning Training Ppt
Slide 1 of 23
Favourites Favourites

Try Before you Buy Download Free Sample Product

Audience Impress Your
Audience
Editable 100%
Editable
Time Save Hours
of Time
The Biggest Sale is ending soon in
0
0
:
0
0
:
0
0
Rating:
90%
Presenting Clustering Algorithms in Machine Learning. These slides are 100 percent made in PowerPoint and are compatible with all screen types and monitors. They also support Google Slides. Premium Customer Support available. Suitable for use by managers, employees, and organizations. These slides are easily customizable. You can edit the color, text, icon, and font size to suit your requirements.

People who downloaded this PowerPoint presentation also viewed the following :

Content of this Powerpoint Presentation

Slide 1

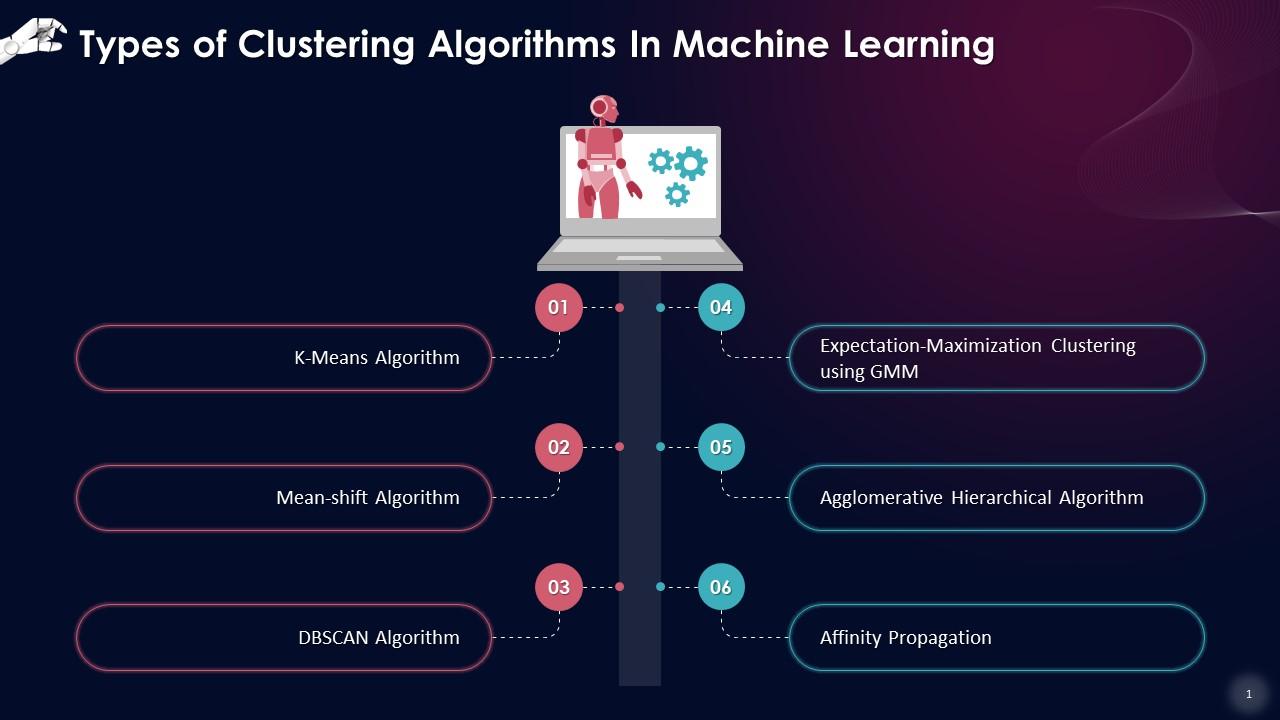
This slide lists the different types of clustering algorithms in unsupervised Machine Learning. These include K-Means, mean-shift, DBSCAN, expectation-maximization clustering using GMM, agglomerative hierarchical algorithm, and affinity propagation.

Slide 2

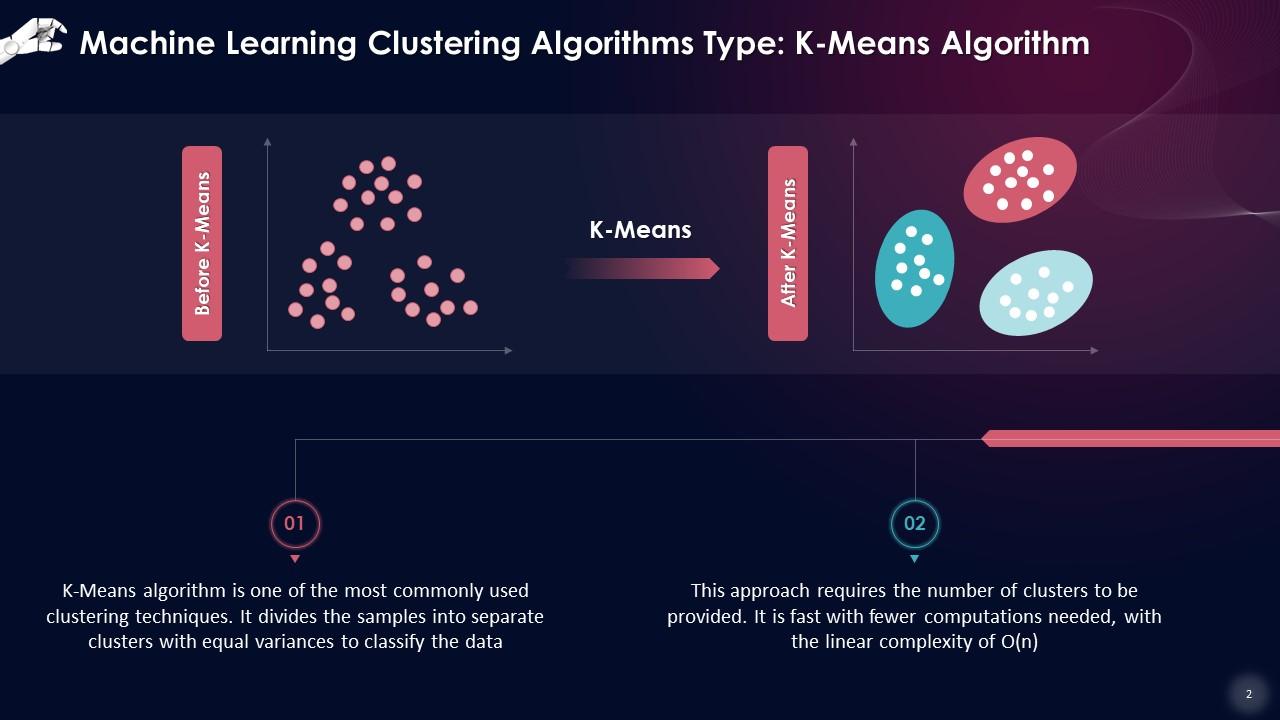
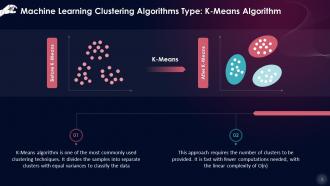
This slide gives an overview of K-Means clustering algorithm which is an unsupervised approach in which the samples are divided into separate clusters with equal variances to classify the data.

Slide 3

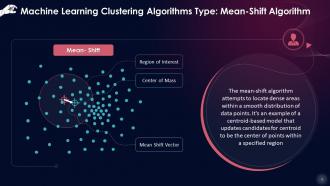
This slide introduces the mean-shift algorithm, which attempts to locate dense areas within a smooth distribution of data points. It's an example of a centroid-based model that updates candidates for centroid to be the center of points within a specified region.

Slide 4

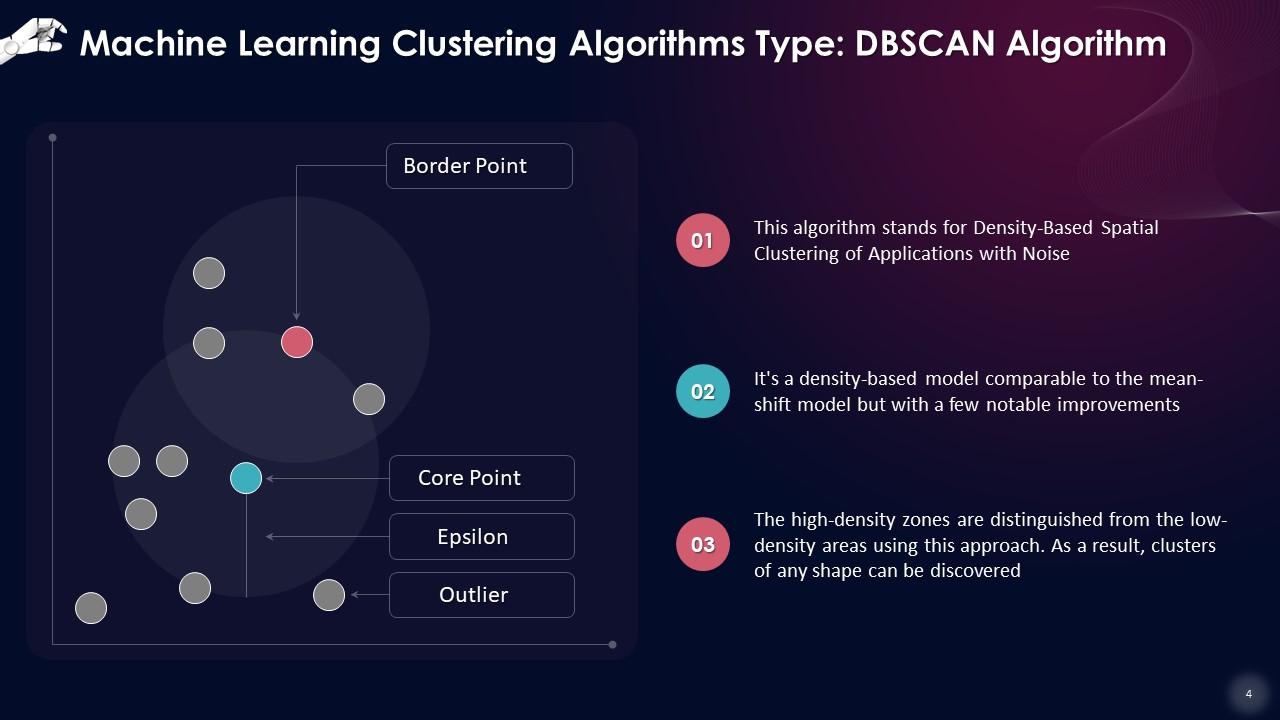
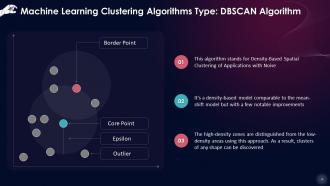
This slide states that DBSCAN algorithm stands for Density-Based Spatial Clustering of Applications with Noise. It's a density-based model comparable to the mean-shift model but with a few notable improvements. The high-density zones are distinguished from the low-density areas using this approach.

Slide 5

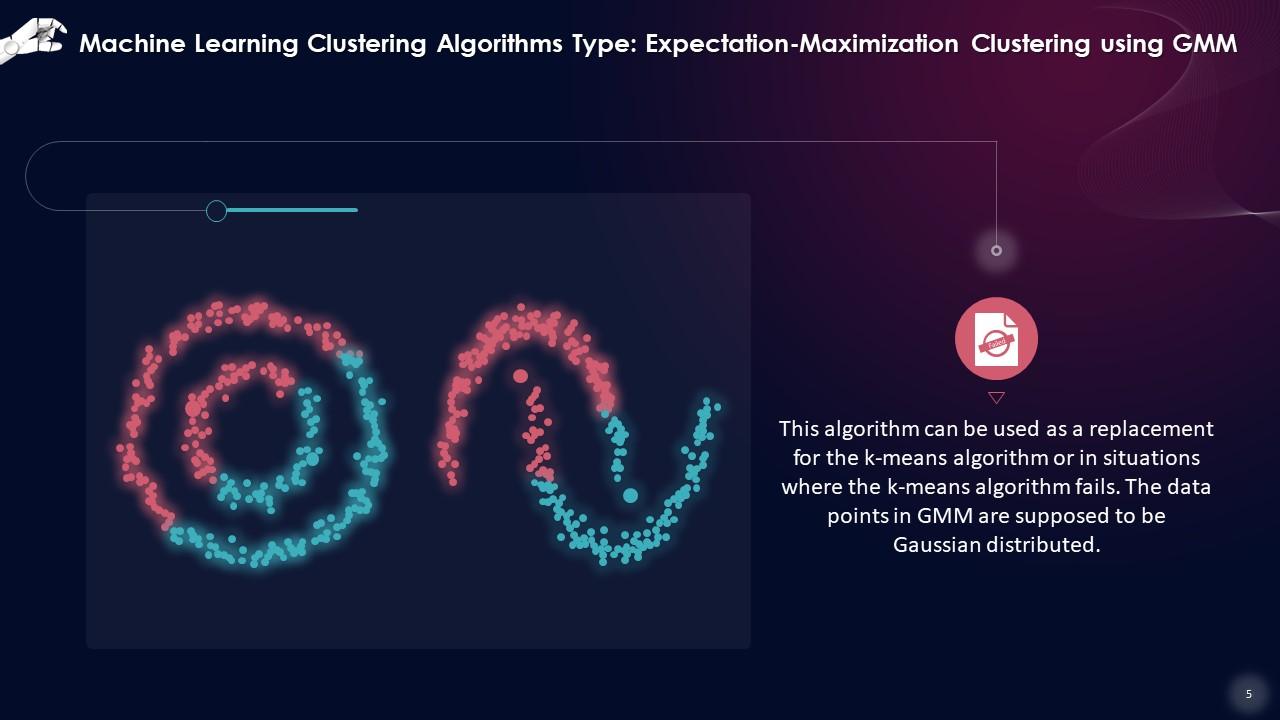
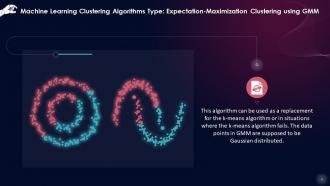
This slide showcases that Expectation-Maximization Clustering using GMM algorithm can be used as a replacement for the k-means algorithm or in situations when the k-means algorithm fails. The data points in GMM are supposed to be Gaussian distributed.

Slide 6

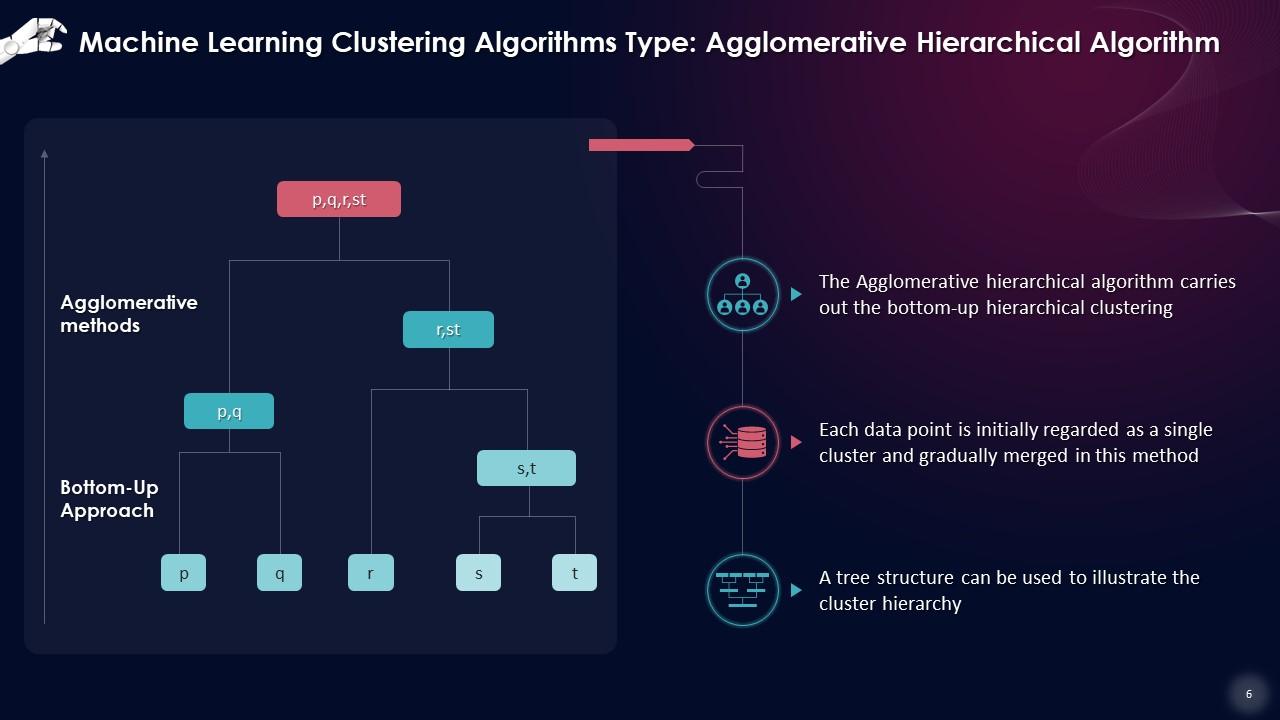
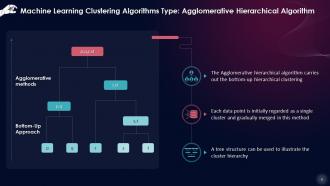
This slide lists that Agglomerative hierarchical algorithm carries out the bottom-up hierarchical clustering. Each data point is initially regarded as a single cluster and then gradually merged in this method.

Slide 7

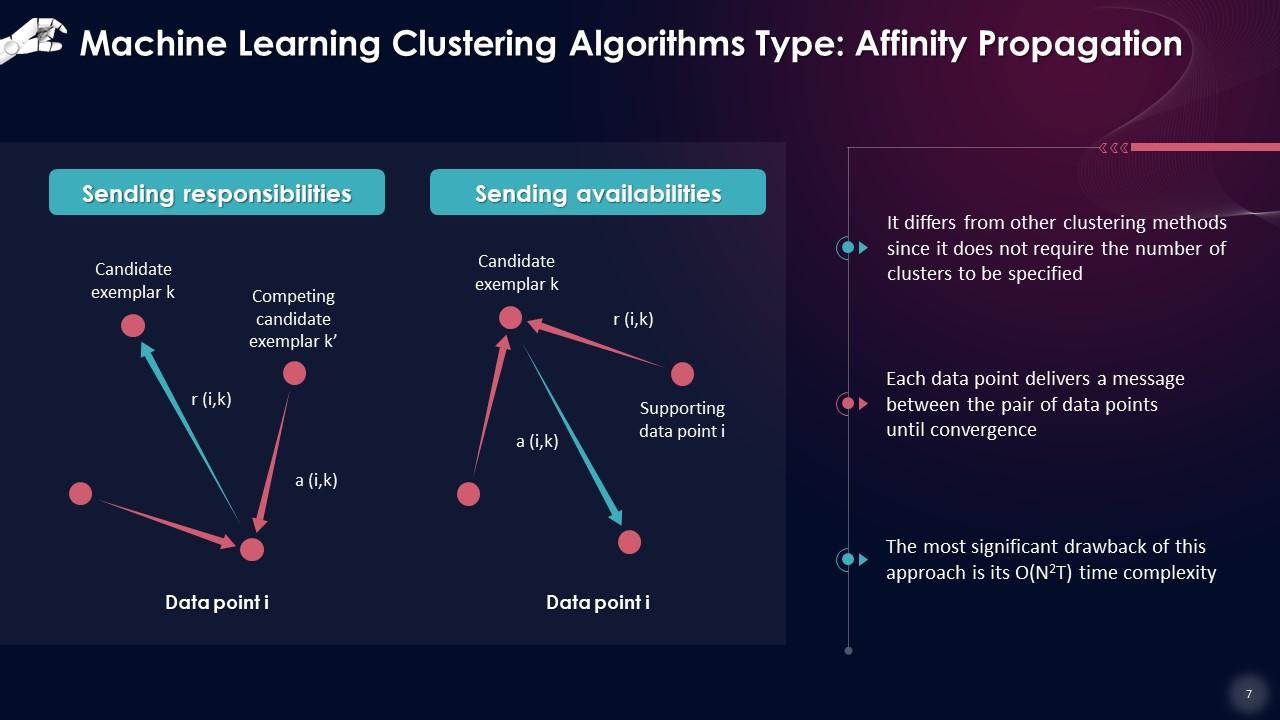
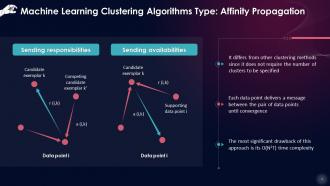
This slide gives an overview of affinity propagation which is different from other clustering methods since it does not require the number of clusters to be specified. Each data point delivers a message between the pair of data points until convergence.

FAQs for Clustering Algorithms In Machine

So hierarchical clustering is like building a family tree for your data - it shows how everything connects at different levels. You don't have to decide upfront how many clusters you want, which is pretty neat. K-means and other partitioning methods just chop everything into whatever number of groups you tell them to. Way faster though, especially if you're dealing with tons of data. Honestly, I usually go with k-means when I have a rough idea of my group count and need quick results. But hierarchical's perfect when you're still figuring out the structure.

Honestly, picking the right distance metric is huge - it literally defines what "similar" means to your algorithm. Euclidean works great for round clusters, but if your data's weirdly shaped or has different scales, you'll get bizarre groupings. Manhattan's your friend for high-dimensional stuff. For text? Cosine similarity is chef's kiss since it cares about direction, not size. I've watched people waste weeks tweaking every other parameter when they just picked the wrong distance metric from day one. Before you do anything else, test 2-3 different ones on a sample and see which actually makes sense for your specific data.

K-means is ridiculously fast and handles big datasets without breaking a sweat. Plus you can actually make sense of the results - those nice round clusters are perfect for presentations. The downside? You're basically guessing how many clusters exist before you start, which feels backwards to me. Also, it only works well when your data forms neat circles of similar sizes. Got some weird banana-shaped clusters or one giant group mixed with tiny ones? You're screwed. I usually throw it at data first just to get a feel for things. Works great for straightforward stuff, but definitely have a backup plan ready.

So DBSCAN is actually pretty smart about noise - it automatically spots outliers that don't fit anywhere. Basically, if a point doesn't have enough neighbors within your set radius, it gets tagged as noise (labeled -1). This beats k-means by a mile since k-means just shoves every point into some cluster whether it belongs or not. You can filter out those noise points later or study them separately. One thing though - you really need to dial in your epsilon and min_samples parameters correctly, otherwise you'll either catch way too much noise or miss obvious outliers.

So the elbow method is probably where I'd start - just plot within-cluster sum of squares for different k values and find where it bends. That bend is usually your answer. There's also the silhouette method which measures cluster separation, but honestly? Sometimes you gotta go with your gut based on what actually makes sense for your specific data. I mean, there's no magic formula here. The elbow thing is pretty easy to code up and interpret though, so definitely try that first. Worst case you can always compare a few methods and see if they agree.

Hey! So for customer segmentation, k-means clustering is your best bet - though honestly hierarchical clustering shows relationships between groups better if that matters to you. Most companies end up with segments like "high-value buyers," "bargain hunters," that kind of thing. Works great for email campaigns and figuring out what to stock. Oh, and definitely start with RFM analysis first (recency, frequency, monetary) - it's way simpler than jumping into complex algorithms. You can always get fancier later once you see what patterns emerge.

So silhouette score measures how well your data points actually belong in their clusters. Basically compares how similar each point is to its own cluster vs the nearest neighboring one. Scores range from -1 to 1 - anything close to 1 means you nailed it, negative scores mean your clustering is probably trash. It averages two things: cohesion (how tight points are within clusters) and separation (distance to other clusters). Super useful for testing different cluster numbers too. Just run it with like 3, 4, 5 clusters and pick whichever gives the highest score. Way more intuitive than some other metrics honestly.

So you plot WCSS against different k values and look for where the curve bends - that's your elbow. Basically it's the point where adding more clusters stops helping much. The curve flattens out just like your actual elbow bends, which is pretty clever naming honestly. After that spot, you're just making things unnecessarily complicated. Sometimes the elbow isn't super clear though, which is annoying. You might need silhouette analysis too if you can't tell where exactly it bends. But yeah, it's a solid way to pick your k value without just guessing.

Yeah totally! Clustering works great for spotting weird stuff. I'd go with DBSCAN first - it's honestly pretty clever because it automatically marks noise points as outliers, so less work for you. With k-means you're looking for points that sit way too far from their cluster centers. The main thing is your training data can't have anomalies mixed in already, otherwise you're kinda screwed from the start. Oh and if you don't know how many clusters you need, DBSCAN's definitely the move since it figures that out itself.

Yeah, high-dimensional clustering is a total pain. Basically, when you've got too many features, distances stop making sense - everything just looks the same distance apart (weird, right?). K-means and hierarchical clustering completely choke on this stuff. DBSCAN struggles too since density gets all wonky. I'd definitely try PCA or t-SNE first to shrink your dimensions down. Maybe aim for under 50 features? Then run your clustering on that. Or you could skip the reduction and go straight to spectral clustering - it handles high-dim data way better than the standard algorithms.

Dude, you gotta scale your features before clustering - trust me on this one. Distance-based algorithms get totally screwed up when one feature has way bigger numbers than others. Picture clustering customers by age (like 25, 30, 45) versus income (50k, 80k, 120k). The income numbers are gonna steamroll everything else and age becomes meaningless. Normalize or standardize first so each feature actually matters in the distance math. K-means and DBSCAN definitely need this. Honestly learned this the hard way once! Tree methods don't care as much, but for most clustering? Scale first, always.

So DBSCAN basically groups points by how densely packed they are. You've got epsilon (neighborhood size) and minPts (how many neighbors you need). Core points with enough nearby neighbors form clusters. Sparse areas? Those get marked as noise, which honestly saves you from dealing with outliers later. The cool thing is you don't have to guess how many clusters beforehand like with k-means. Plus it handles weird-shaped clusters way better. I'd start with epsilon around 1-2% of your data range and minPts at 4 or 5 - worked for me last time.

Honestly, K-means++ is a game changer compared to random initialization. With random init, you're basically rolling dice - sometimes you get decent clusters, other times complete garbage. Been there! K-means++ actually thinks about where it places those starting points, spreading them out intelligently across your data. The results are way more consistent, plus it converges faster since you're not starting from some random terrible position. I mean, unless you've got some weird edge case, just go with K-means++. Your clustering will thank you.

Scatter plots are your go-to here - color-code each cluster so you can actually see what's happening. For higher dimensions, you'll need PCA or t-SNE to squash everything into 2D/3D (otherwise you're flying blind). Silhouette plots work great for checking if points actually belong in their clusters. But honestly? Sometimes just eyeballing it tells you more than the fancy metrics. Look for tight groups that don't overlap much. I always start simple with basic 2D plots first, then get fancier if needed. Oh, and watch for weird outliers - they'll mess with your results.

So basically, if your clusters are weird shapes or overlap, go with GMM. K-means only works well when you've got nice round clusters that are roughly the same size - which honestly doesn't happen that often in real life. GMM is way more flexible since it can handle elliptical shapes and gives you probabilities instead of just shoving each point into one bucket. Plus it handles different cluster sizes better. The downside? More complicated math. If your data looks clean and well-separated though, K-means will do the job just fine and run faster.

Ratings and Reviews

90% of 100
Review Form
Write a review
Most Relevant Reviews
  1. 80%

    by Dino Grant

    If you have visited their site and failed to find the products, try reaching the customer service because it will be the case that you didn't use the search bar well.
  2. 100%

    by Chong Richardson

    Time saving slide with creative ideas. Help a lot in quick presentations..

2 Item(s)

per page: