


Company Operations Powerpoint Presentation Slides


Try Before you Buy Download Free Sample Product
 Impress Your
 Audience
Editable
of Time


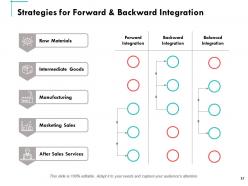
Understand the processes of the organization by utilizing this Company Operations Powerpoint Presentation Slides. Mention the seven steps of operation management by utilizing this readily available business plan PPT slideshow. Showcase the strategic functions of the organization by taking the aid of operational plan PPT layouts. Generate a quality cost report in order to maintain production and output quality with the help of this business operations PPT slideshow. Elaborate the strategies for forward and backward integration such as raw materials, intermediate goods, manufacturing, marketing sales, etc with the help of the business operations management PowerPoint slides. Showcase the elements of operational management strategy using these corporate operations PPT visuals. Determine the production capacity needed by an organization to meet changing demands for its products with the help of operation management PPT templates. Thus understand the functions that are important to the stability and profitability of any business by downloading this operation plan PPT presentation.
People who downloaded this PowerPoint presentation also viewed the following :
Content of this Powerpoint Presentation
Slide 1: This slide introduces Company Operations. State your company name and begin.
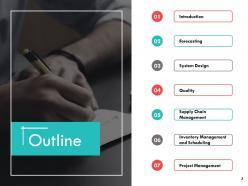
Slide 2: This slide displays the Outline of the presentation.
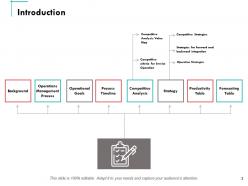
Slide 3: This slide displays the Introduction.
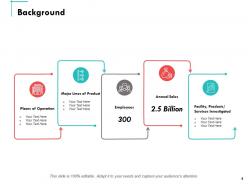
Slide 4: This slide showcases the Background with- Places of Operation, Major Lines of Product, Employees, Annual Sales, 2.5 Billion, Facility, Products/ Services Investigated.
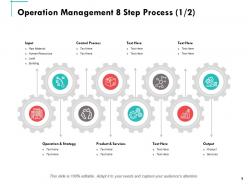
Slide 5: This slide showcases Operation Management with 8 Step Process. This slide is 100% editable. Adapt it to your needs and capture your audience's attention.
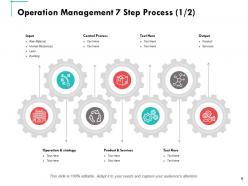
Slide 6: This slide depicts Operation Management with 7 Step Process.
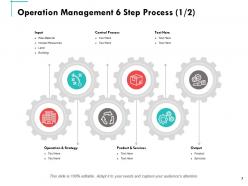
Slide 7: This slide showcases Operation Management with 6 Step Process containing- Input, Raw Material, Human Resources, Land, Building, Operation & Strategy.
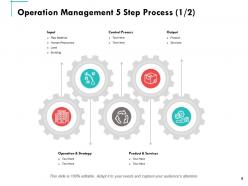
Slide 8: This slide depicts Operation Management 5 Step Process.
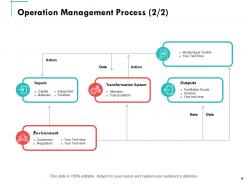
Slide 9: This slide displays the Operation Management Process.
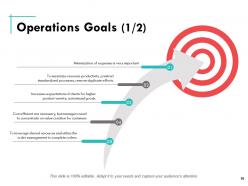
Slide 10: This slide showcases Operations Goals.
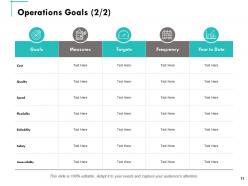
Slide 11: This is another slide showcasing Operations Goals.
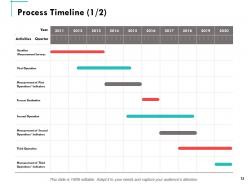
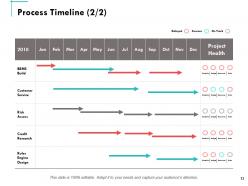
Slide 12: This is Process Timeline slide.
Slide 13: This slide displays Process Timeline.
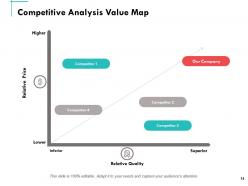
Slide 14: This slide showcases Competitive Analysis Value Map.
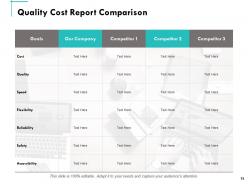
Slide 15: This slide depicts Quality Cost Report Comparison.
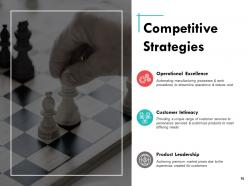
Slide 16: This slide depicts Competitive Strategies.
Slide 17: This slide showcases Strategies for Forward & Backward Integration.
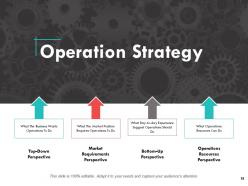
Slide 18: This slide describes the Operation Strategy containing- What The Market Position Requires Operations To Do, Market Requirements Perspective, etc.
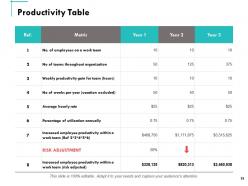
Slide 19: This slide represents Productivity Table.
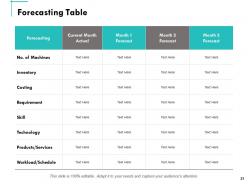
Slide 20: This slide showcases Forecasting Table.
Slide 21: This slide also presents Forecasting Table.
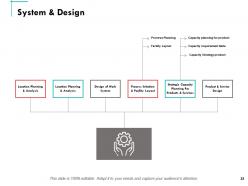
Slide 22: This slide depicts System & Design with- Capacity Strategy product, Capacity requirement table, Capacity planning for product, Facility Layout, Process Planning, Location Planning & Analysis, Location Planning & Analysis, Design of Work System, etc.
Slide 23: This slide displays Product & Service Design.
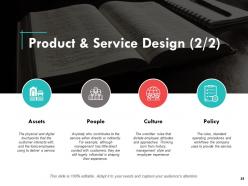
Slide 24: This slide depicts Product & Service Design containing- people, culture, policy and assets.
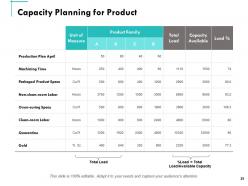
Slide 25: This slide showcases Capacity Planning for Product.
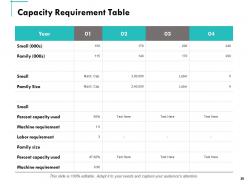
Slide 26: This slide showcases Capacity Requirement Table.
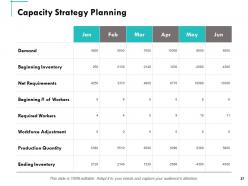
Slide 27: This slide displays Capacity Strategy Planning.
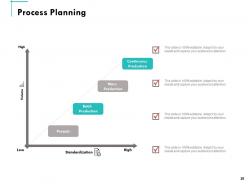
Slide 28: This slide showcases Process Planning with Projects, Batch production, Mass production, Continuous Production.
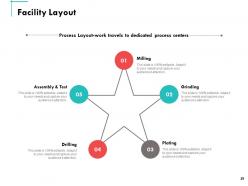
Slide 29: This slide depicts Facility Layout displaying- Milling, Plating, Drilling, Grinding, Assembly & Test.
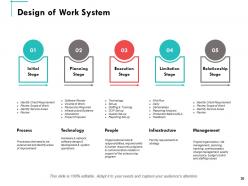
Slide 30: This slide showcases Design of Work System.
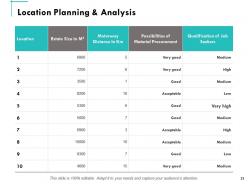
Slide 31: This slide displays Location Planning & Analysis.
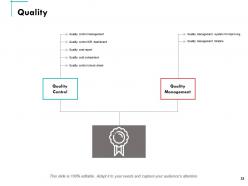
Slide 32: This slide displays Quality containing- Quality management timeline, Quality management system for improving, Quality control management, Quality control KPI dashboard, Quality cost report, Quality cost comparison, Quality control check sheet, Quality Control Quality Management.
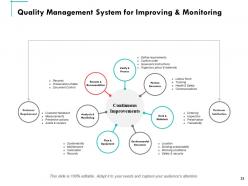
Slide 33: This slide showcases Quality Management System for Improving & Monitoring.
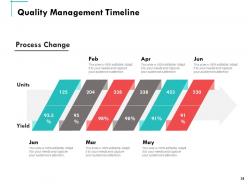
Slide 34: This slide displays the Quality Management Timeline.
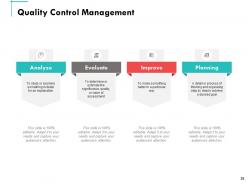
Slide 35: This slide describes Quality Control Management. Analyze, Evaluate, Improve, Planning.
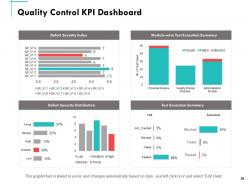
Slide 36: This slide depicts Quality Control KPI Dashboard.
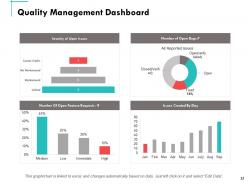
Slide 37: This slide showcases Quality Management Dashboard.
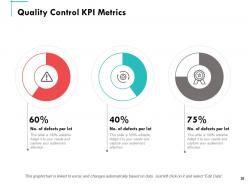
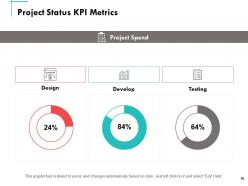
Slide 38: This slide showcases Quality Control KPI Metrics.
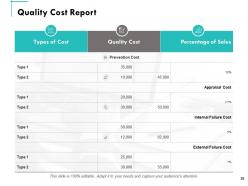
Slide 39: This slide displays the Quality Cost Report.
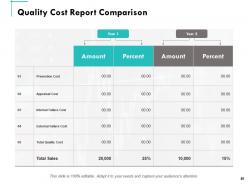
Slide 40: This slide depicts Quality Cost Report Comparison.
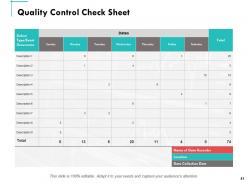
Slide 41: This slide represents Quality Control Check Sheet.
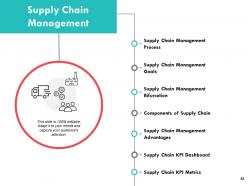
Slide 42: This slide showcases Supply Chain Management containing- Supply Chain Management Process, Supply Chain Management Goals, Supply Chain Management Bifurcation, Components of Supply Chain, Supply Chain Management Advantages, Supply Chain KPI Dashboard, Supply Chain KPI Metrics.
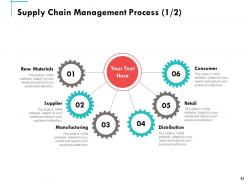
Slide 43: This slide showcases Supply Chain Management Process displaying- Raw Materials, Supplier, Manufacturing, Distribution, Retail.
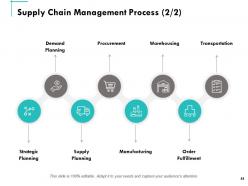
Slide 44: This slide showcases Supply Chain Management Process with- Strategic Planning, Demand Planning, Supply Planning, Procurement, Manufacturing, Warehousing, Order Fulfillment, Transportation.
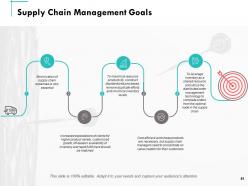
Slide 45: This slide showcases Supply Chain Management Goals.
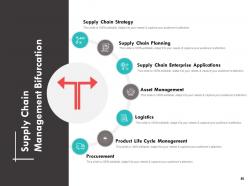
Slide 46: This slide depicts Supply Chain Management Bifurcation displaying- Supply Chain Strategy, Supply Chain Planning, Supply Chain Enterprise Applications, Asset Management, Logistics, Product Life Cycle Management, Procurement.
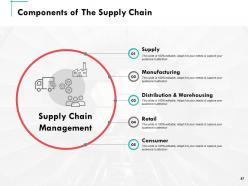
Slide 47: This slide showcases Components of The Supply Chain.
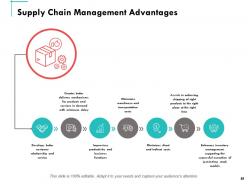
Slide 48: This slide depicts Supply Chain Management Advantages.
Slide 49: This slide reminds about Coffee Break.
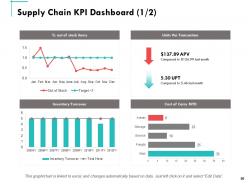
Slide 50: This slide displays Supply Chain KPI Dashboard.
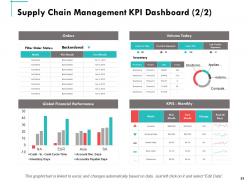
Slide 51: This slide depicts Supply Chain Management KPI Dashboard.
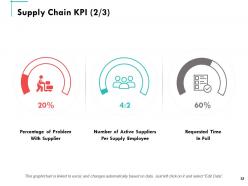
Slide 52: This slide showcases Supply Chain KPI.
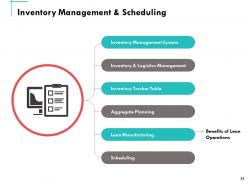
Slide 53: This slide represents Inventory Management & Scheduling.
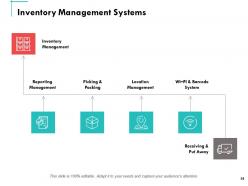
Slide 54: This slide represents Inventory Management Systems with- Receiving & Put Away, WI–FI & Barcode System, Location Management, Picking & Packing, Reporting Management, Inventory Management.
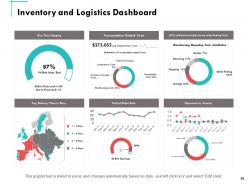
Slide 55: This slide showcases Inventory and Logistics Dashboard.
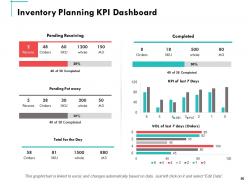
Slide 56: This slide displays the Inventory Planning KPI Dashboard.
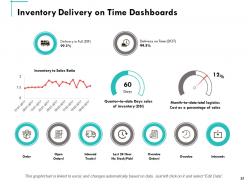
Slide 57: This slide depicts Inventory Delivery on Time Dashboards.
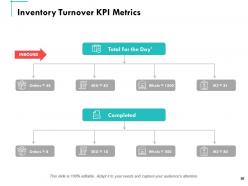
Slide 58: This slide showcases Inventory Turnover KPI Metrics.
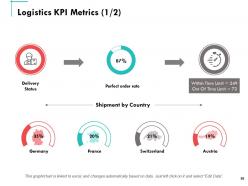
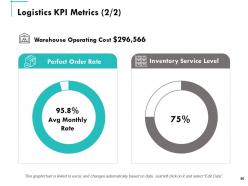
Slide 59: This slide represents Logistics KPI Metrics.
Slide 60: This slide presents Logistics KPI Metrics.
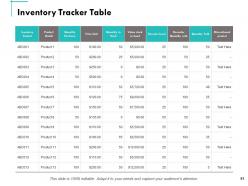
Slide 61: This slide showcases Inventory Tracker Table.
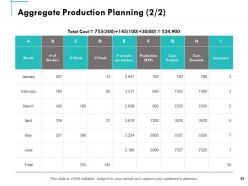
Slide 62: This slide depicts Aggregate Production Planning.
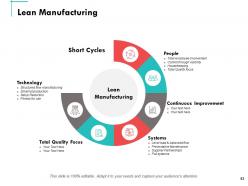
Slide 63: This slide displays Lean Manufacturing with- People, Total employee involvement, Control through visibility, Housekeeping, Total Quality focus, Systems, Level load & balanced flow, Preventative Maintenance, Supplier Partnerships, Pull systems, Total Quality Focus,etc.
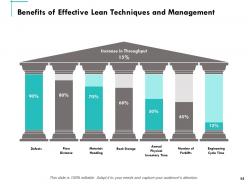
Slide 64: This slide showcases Benefits of Effective Lean Techniques and Management.
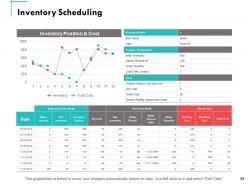
Slide 65: This slide represents Inventory Scheduling.
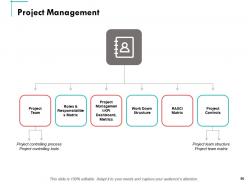
Slide 66: This slide represents Project Management with- Project controlling process, Project controlling tools, Project team structure, Project team matrix, Project Team, Roles & Responsibilities Matrix, Project Management KPI Dashboard, Metrics, Project Controls, RASCI Matrix, Work Down Structure.
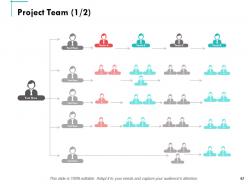
Slide 67: This slide showcases Project Team. This slide is 100% editable. Adapt it to your needs and capture your audience's attention.
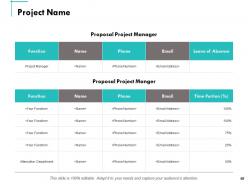
Slide 68: This slide showcases Project Name.
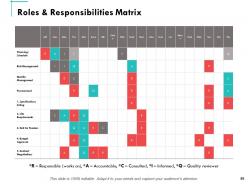
Slide 69: This slide showcases Roles & Responsibilities Matrix.
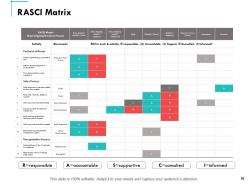
Slide 70: This slide showcases RASCI Matrix- R=responsible, A=accountable, C=consulted, I=informed, S=supportive.
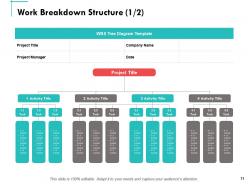
Slide 71: This slide depicts Work Breakdown Structure.
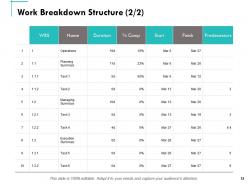
Slide 72: This slide showcases Work Breakdown Structure.
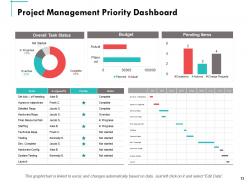
Slide 73: This slide showcases Project Management Priority Dashboard.
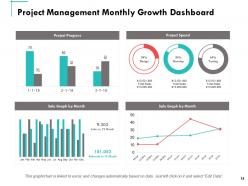
Slide 74: This slide depicts Project Management Monthly Growth Dashboard.
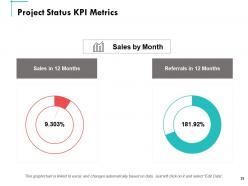
Slide 75: This slide showcases Project Status KPI Metrics
Slide 76: This slide depicts Project Status KPI Metrics.
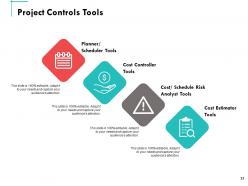
Slide 77: This slide showcases Project Controls Tools.
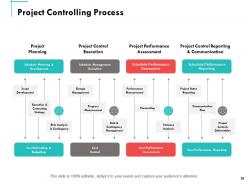
Slide 78: This slide displays Project Controlling Process with- Schedule Planning & Development, Schedule Management Execution, Schedule Performance Assessment, Schedule Performance Reporting, Project Planning, Project Control, Execution, Project Performance Assessment, Project Control Reporting & Communication, Cost Estimating & Budgeting, Cost Control, etc.
Slide 79: This is Puzzle slide with icons and text boxes.
Slide 80: This is Thank You slide with address, email address and contact number.
Company Operations Powerpoint Presentation Slides with all 80 slides:
Use our Company Operations Powerpoint Presentation Slides to effectively help you save your valuable time. They are readymade to fit into any presentation structure.


FAQs for Company Operations
Start with cycle time and throughput - those operational metrics are your bread and butter. Quality stuff like defect rates matters tons too, obviously you don't want things falling apart later. If you're manufacturing, OEE is honestly where it's at for production health. Cost per unit, operating margin, cash conversion cycle... the usual suspects for keeping the money side straight. Customer satisfaction scores are clutch for catching problems early. Keep it to maybe 5-7 KPIs though - I learned the hard way that tracking everything means tracking nothing. Build dashboards people actually look at daily, not just fancy reports that sit there.
Honestly, tech can be a total lifesaver for cutting costs. Automate the boring stuff like invoicing and inventory - saves you from hiring more people. Cloud tools are where it's at though, your team can work from anywhere without you dropping cash on fancy servers. Real-time data helps you make quick decisions instead of guessing. You'll slash paper costs and avoid those annoying human errors that waste time fixing later. Oh, and customer support tickets can mostly run themselves now. My advice? Don't go crazy at first. Just pick whatever process is currently driving your team nuts and tackle that one thing.
Training your team seriously makes a huge difference - it cuts down on mistakes and speeds everything up. When people actually know what they're doing, you're not constantly putting out fires. I read somewhere that some companies saw 30% faster processing times after decent training, which honestly makes sense. Your employees won't need you breathing down their necks all the time. They'll catch problems early too. Look at where things get stuck in your workflow first - that's probably where training would help most. Way better than dealing with the same screwups over and over.
Honestly? Start with simple stuff like getting teams to actually talk during cross-functional meetings instead of just rattling off updates. Coffee chats with people from other departments work surprisingly well - way better than formal meetings sometimes. Get everyone using the same project management tools so finance can see what marketing's doing and vice versa. Create shared goals that force collaboration (can't hit targets without working together). Oh, and celebrate wins company-wide, not just within departments. Your managers need to model this behavior first though - if they're not collaborating, good luck getting anyone else to care.
Honestly, you've gotta build flexibility before shit hits the fan. COVID taught me that lesson the expensive way - we were running around like headaches trying to find backup suppliers. Map out where you're most screwed if something goes wrong, then line up alternatives for each vulnerability. Yeah, keeping extra inventory eats cash, but it's worth it for critical stuff. Multiple suppliers for anything important is non-negotiable. Also, stay in regular touch with your vendors so you hear about problems early instead of getting surprised. Real-time inventory tracking helps too, though that's probably obvious.
Honestly, start by figuring out where you're bleeding the most - check your response times and see what customers complain about most. Train your people properly (I know it sounds basic but so many places half-ass this). Get a decent ticketing system so nothing falls through cracks. Here's the thing though - let your front desk people actually solve problems instead of passing everything up the chain. That alone will speed things up tons. Also throw some quick surveys at customers after interactions. You'll spot patterns you didn't even know existed.
Most companies build compliance right into their daily processes instead of treating it like some side project. They'll have dedicated teams doing regular audits and training everyone on the rules. The documentation is honestly insane - I swear some places keep records of everything down to coffee purchases. Legal teams stay involved, plus they bring in outside experts who know the industry-specific stuff. My advice? Figure out which regulations actually hit your operations first. That's way better than trying to tackle everything at once. Make it part of your regular workflow from day one.
Honestly, culture is way more tied to performance than people think. Strong alignment means faster decisions and less BS politics slowing everything down. Your teams actually collaborate instead of stepping on each other's toes. The numbers don't lie either - companies with solid cultures perform 20-30% better operationally. Wild, right? Poor culture creates friction everywhere. Miscommunication. Duplicated work. People pulling in different directions instead of toward the same goal. Look at where your team's energy gets drained by cultural misalignment first. That's probably your biggest bottleneck.
Honestly, once you start tracking the right data, you'll catch problems way before they become expensive disasters. The numbers don't lie - you can finally see what's actually working instead of just hoping your gut instincts are right. Bottlenecks become obvious, you can predict when stuff needs fixing, and your scheduling gets way smarter. I'd say pick just one thing you're always second-guessing and start measuring it religiously. The clarity is kind of addictive once you get going. Your KPIs will actually mean something for once, and you'll wonder how you managed without real visibility into what drives results.
Honestly, I'd start with the easy stuff first - renewable energy and better inventory management to cut waste. Going paperless saves you money and helps the environment, so that's a no-brainer. Supply chain auditing is where it gets messy, but checking if your vendors are actually sustainable is worth it. Oh, and that circular economy thing where you design products for reuse instead of just tossing them? Game changer. Don't try to do everything though - pick maybe 2-3 things max or you'll burn out before seeing any real progress.
Oh absolutely, lean works great for service stuff! Instead of looking at physical waste, you're hunting down process waste. Map out how you deliver services and question every single step - why do we do this? Does it help customers or just create busy work? Wait times are the biggest culprit usually. Also those ridiculous approval chains where requests ping-pong between five different people for no good reason. One company I know cut their onboarding from like 3 weeks to 10 days just by really examining their workflow. Honestly though, don't try figuring this out from your office - talk to the people actually doing the work daily.
Honestly, most companies just overcomplicate everything from the start. Plus they never actually talk to the people doing the work - which is insane if you think about it. Oh, and chasing every shiny new trend instead of sticking with what actually moves the needle. I see this constantly. Start simple, then add layers later. Loop in your frontline folks because they know where things break down. Pick maybe 2-3 big things max - spreading too thin kills momentum. Test stuff small first. Scale what works, ditch what doesn't. Sounds obvious but you'd be surprised how many skip this step.
Start with whatever's driving you nuts - data entry, invoices, scheduling, those same customer questions over and over. Zapier's pretty solid for connecting apps and automating workflows. Chatbots can handle the basic customer stuff, and if you're feeling fancy, RPA tools tackle bigger things like payroll. The tricky part? There's almost too many options, which is weirdly paralyzing. Pick something that takes forever but doesn't need your brain - you know what I mean? Try one thing first, see how much time you actually save, then go from there. I'd honestly just start with the task that annoys you most.
Track your inventory turnover ratio first - shows how fast you're moving stuff. Days sales outstanding and stockout frequency are huge too. Don't sleep on carrying costs (storage, insurance, all that money just sitting there). Fill rate is probably the most overlooked metric - tells you how often you can actually ship orders from what's on hand. That one drives me nuts when businesses ignore it. Gross margin return on investment helps with smarter buying decisions. Pull these monthly and you'll catch problems way earlier. Oh, and short sentences mixed with longer ones keep it interesting.
Start with one messy process and get your team talking about it weekly - what's broken, what's actually working. Customer complaints are gold (even when they sting). Track a few key numbers so you're not flying blind. Here's the thing though - most people collect feedback and then... nothing. Don't be that person. Make real changes based on what you're hearing, then check if those tweaks actually helped. It's like a mini experiment each time. Oh, and your employees probably see problems you don't, so ask them too.
-
Nice and innovative design.
-
Really like the color and design of the presentation.
-
Unique research projects to present in meeting.
-
Easily Understandable slides.