Company profile PowerPoint Presentation Templates and Slides
- Sub Categories
-
- Architecture and Design Services
- Automotive
- Beauty and Cosmetics
- BFSI
- Consumer Goods and FMCG
- E-Commerce
- Edtech
- Electronics
- Energy
- Fashion
- Food and Agriculture
- Food delivery
- General
- Healthcare
- International Trade
- IT
- Legal
- Logistic and Supply Chain
- Marketing and Sales
- Media and Entertainment
- Payment Solution
- Professional Services
- Quick Service Restaurant
- Real Estate and Construction
- Retail and FMCG
- Retail and Trade
- Social Media
- Telecommunications media and technology services
- Transportation mobility
- Travel and Tourism
-
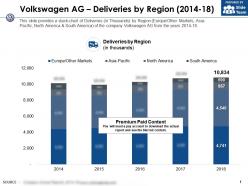 Volkswagen ag deliveries by region 2014-18
This is a professionally designed visual chart for Volkswagen Ag Deliveries By Region 2014 to 18. This is part of our Data and Statistics products selection, and you will need a Paid account to download the actual report with accurate data and sources. Downloaded report will contain the editable graph with accurate data, an excel table with the actual data, the exact source of the data and the release date. This slide provides a stack chart of Deliveries in Thousands by Region Europe Other Markets, Asia Pacific, North America and South America of the company Volkswagen AG from the years 2014 to 18. Download it immediately and use it for your business.
-
 Volkswagen ag deliveries by vehicles segment 2014-18
This is a professionally designed visual chart for Volkswagen Ag Deliveries By Vehicles Segment 2014 to 18. This is part of our Data and Statistics products selection, and you will need a Paid account to download the actual report with accurate data and sources. Downloaded report will contain the editable graph with accurate data, an excel table with the actual data, the exact source of the data and the release date. This slide provides a stack chart of Deliveries by Vehicles Segment in Thousands of the company Volkswagen AG from the years 2014 to 18. Download it immediately and use it for your business.
-
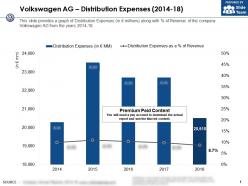 Volkswagen ag distribution expenses 2014-18
This is a professionally designed visual chart for Volkswagen Ag Distribution Expenses 2014 to 18. This is part of our Data and Statistics products selection, and you will need a Paid account to download the actual report with accurate data and sources. Downloaded report will contain the editable graph with accurate data, an excel table with the actual data, the exact source of the data and the release date. This slide provides a graph of Distribution Expenses in JPY millions along with percent of Revenue of the company Volkswagen AG from the years 2014 to 18. Download it immediately and use it for your business.
-
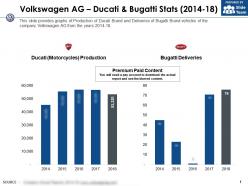 Volkswagen ag ducati and bugatti stats 2014-18
This is a professionally designed visual chart for Volkswagen Ag Ducati And Bugatti Stats 2014 to 18. This is part of our Data and Statistics products selection, and you will need a Paid account to download the actual report with accurate data and sources. Downloaded report will contain the editable graph with accurate data, an excel table with the actual data, the exact source of the data and the release date. This slide provides graphs of Production of Ducati Brand and Deliveries of Bugatti Brand vehicles of the company Volkswagen AG from the years 2014 to 18. Download it immediately and use it for your business.
-
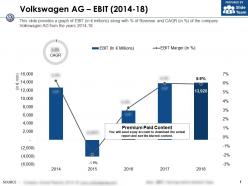 Volkswagen ag ebit 2014-18
This is a professionally designed visual chart for Volkswagen Ag Ebit 2014 to 18. This is part of our Data and Statistics products selection, and you will need a Paid account to download the actual report with accurate data and sources. Downloaded report will contain the editable graph with accurate data, an excel table with the actual data, the exact source of the data and the release date. This slide provides a graph of EBIT in JPY millions along with percent of Revenue and CAGR in percent of the company Volkswagen AG from the years 2014 to 18. Download it immediately and use it for your business.
-
 Volkswagen ag employees by business area 2014-18
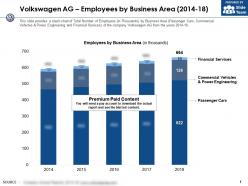
This is a professionally designed visual chart for Volkswagen Ag Employees By Business Area 2014 to 18. This is part of our Data and Statistics products selection, and you will need a Paid account to download the actual report with accurate data and sources. Downloaded report will contain the editable graph with accurate data, an excel table with the actual data, the exact source of the data and the release date. This slide provides a stack chart of Total Number of Employees in Thousands by Business Area Passenger Cars, Commercial Vehicles and Power Engineering and Financial Services of the company Volkswagen AG from the years 2014 to 18. Download it immediately and use it for your business.
-
 Volkswagen ag employees by region 2014-18
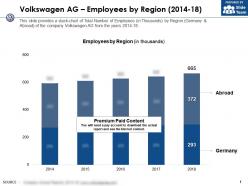
This is a professionally designed visual chart for Volkswagen Ag Employees By Region 2014 to 18. This is part of our Data and Statistics products selection, and you will need a Paid account to download the actual report with accurate data and sources. Downloaded report will contain the editable graph with accurate data, an excel table with the actual data, the exact source of the data and the release date. This slide provides a stack chart of Total Number of Employees in Thousands by Region Germany and Abroad of the company Volkswagen AG from the years 2014 to 18. Download it immediately and use it for your business.
-
 Volkswagen ag financial highlights 2017-2018
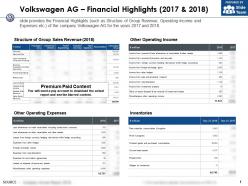
This is a professionally designed visual chart for Volkswagen Ag Financial Highlights 2017 to 2018. This is part of our Data and Statistics products selection, and you will need a Paid account to download the actual report with accurate data and sources. Downloaded report will contain the editable graph with accurate data, an excel table with the actual data, the exact source of the data and the release date. This slide provides the Financial Highlights such as Structure of Group Revenue, Operating Income and Expenses etc. of the company Volkswagen AG for the years 2017 to 2018. Download it immediately and use it for your business.
-
 Volkswagen ag fixed assets 2014-18
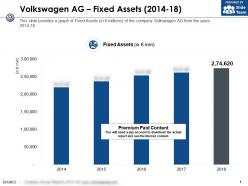
This is a professionally designed visual chart for Volkswagen Ag Fixed Assets 2014 to 18. This is part of our Data and Statistics products selection, and you will need a Paid account to download the actual report with accurate data and sources. Downloaded report will contain the editable graph with accurate data, an excel table with the actual data, the exact source of the data and the release date. This slide provides a graph of Fixed Assets in JPY millions of the company Volkswagen AG from the years 2014 to 18. Download it immediately and use it for your business.
-
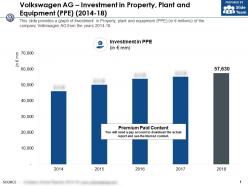 Volkswagen ag investment in property plant and equipment ppe 2014-18
This is a professionally designed visual chart for Volkswagen Ag Investment In Property Plant And Equipment PPE 2014 to 18. This is part of our Data and Statistics products selection, and you will need a Paid account to download the actual report with accurate data and sources. Downloaded report will contain the editable graph with accurate data, an excel table with the actual data, the exact source of the data and the release date. This slide provides a graph of Investment in Property, plant and equipment PPE in JPY millions of the company Volkswagen AG from the years 2014 to 18. Download it immediately and use it for your business.
-
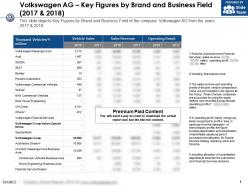 Volkswagen ag key figures by brand and business field 2017-2018
This is a professionally designed visual chart for Volkswagen Ag Key Figures By Brand And Business Field 2017 to 2018. This is part of our Data and Statistics products selection, and you will need a Paid account to download the actual report with accurate data and sources. Downloaded report will contain the editable graph with accurate data, an excel table with the actual data, the exact source of the data and the release date. This slide depicts Key Figures by Brand and Business Field of the company Volkswagen AG from the years 2017 to 2018. Download it immediately and use it for your business.
-
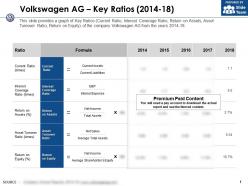 Volkswagen ag key ratios 2014-18
This is a professionally designed visual chart for Volkswagen Ag Key Ratios 2014 to 18. This is part of our Data and Statistics products selection, and you will need a Paid account to download the actual report with accurate data and sources. Downloaded report will contain the editable graph with accurate data, an excel table with the actual data, the exact source of the data and the release date. This slide provides a graph of Key Ratios Current Ratio, Interest Coverage Ratio, Return on Assets, Asset Turnover Ratio, Return on Equity of the company Volkswagen AG from the years 2014 to 18. Download it immediately and use it for your business.
-
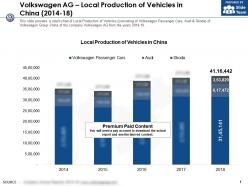 Volkswagen ag local production of vehicles in china 2014-18
This is a professionally designed visual chart for Volkswagen Ag Local Production Of Vehicles In China 2014 to 18. This is part of our Data and Statistics products selection, and you will need a Paid account to download the actual report with accurate data and sources. Downloaded report will contain the editable graph with accurate data, an excel table with the actual data, the exact source of the data and the release date. This slide provides a stack chart of Local Production of Vehicles consisting of Volkswagen Passenger Cars, Audi and Skoda of Volkswagen Group China of the company Volkswagen AG from the years 2014 to 18. Download it immediately and use it for your business.
-
 Volkswagen ag long term liabilities 2014-18
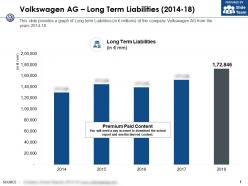
This is a professionally designed visual chart for Volkswagen Ag Long Term Liabilities 2014 to 18. This is part of our Data and Statistics products selection, and you will need a Paid account to download the actual report with accurate data and sources. Downloaded report will contain the editable graph with accurate data, an excel table with the actual data, the exact source of the data and the release date. This slide provides a graph of Long term Liabilities in JPY millions of the company Volkswagen AG from the years 2014 to 18. Download it immediately and use it for your business.
-
 Volkswagen ag man 2014-18
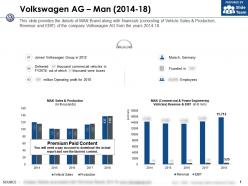
This is a professionally designed visual chart for Volkswagen Ag Man 2014 to 18. This is part of our Data and Statistics products selection, and you will need a Paid account to download the actual report with accurate data and sources. Downloaded report will contain the editable graph with accurate data, an excel table with the actual data, the exact source of the data and the release date. This slide provides the details of MAN Brand along with financials consisting of Vehicle Sales and Production, Revenue and EBIT of the company Volkswagen AG from the years 2014 to 18. Download it immediately and use it for your business.
-
 Volkswagen ag market capitalization 2014-18
This is a professionally designed visual chart for Volkswagen Ag Market Capitalization 2014 to 18. This is part of our Data and Statistics products selection, and you will need a Paid account to download the actual report with accurate data and sources. Downloaded report will contain the editable graph with accurate data, an excel table with the actual data, the exact source of the data and the release date. This slide provides the graph of Market Capitalization in JPY billions of the company Volkswagen AG from the years 2014 to 18. Download it immediately and use it for your business.
-
 Volkswagen ag net income 2014-18
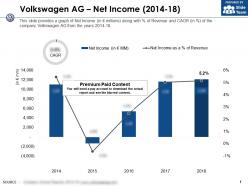
This is a professionally designed visual chart for Volkswagen Ag Net Income 2014 to 18. This is part of our Data and Statistics products selection, and you will need a Paid account to download the actual report with accurate data and sources. Downloaded report will contain the editable graph with accurate data, an excel table with the actual data, the exact source of the data and the release date. This slide provides a graph of Net Income in JPY millions along with percent of Revenue and CAGR in percent of the company Volkswagen AG from the years 2014 to 18. Download it immediately and use it for your business.
-
 Volkswagen ag net revenue 2014-18
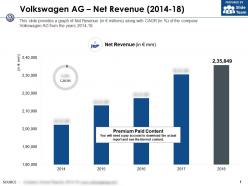
This is a professionally designed visual chart for Volkswagen Ag Net Revenue 2014 to 18. This is part of our Data and Statistics products selection, and you will need a Paid account to download the actual report with accurate data and sources. Downloaded report will contain the editable graph with accurate data, an excel table with the actual data, the exact source of the data and the release date. This slide provides a graph of Net Revenue in JPY millions along with CAGR in percent of the company Volkswagen AG from the years 2014 to 18. Download it immediately and use it for your business.
-
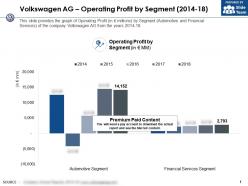 Volkswagen ag operating profit by segment 2014-18
This is a professionally designed visual chart for Volkswagen Ag Operating Profit By Segment 2014 to 18. This is part of our Data and Statistics products selection, and you will need a Paid account to download the actual report with accurate data and sources. Downloaded report will contain the editable graph with accurate data, an excel table with the actual data, the exact source of the data and the release date. This slide provides the graph of Operating Profit in JPY millions by Segment Automotive and Financial Services of the company Volkswagen AG from the years 2014 to 18. Download it immediately and use it for your business.
-
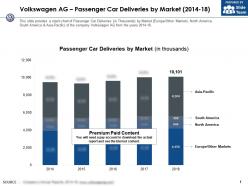 Volkswagen ag passenger car deliveries by market 2014-18
This is a professionally designed visual chart for Volkswagen Ag Passenger Car Deliveries By Market 2014 to 18. This is part of our Data and Statistics products selection, and you will need a Paid account to download the actual report with accurate data and sources. Downloaded report will contain the editable graph with accurate data, an excel table with the actual data, the exact source of the data and the release date. This slide provides a stack chart of Passenger Car Deliveries in Thousands by Market Europe Other Markets, North America, South America and Asia Pacific of the company Volkswagen AG from the years 2014 to 18. Download it immediately and use it for your business.
-
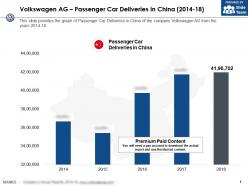 Volkswagen ag passenger car deliveries in china 2014-18
This is a professionally designed visual chart for Volkswagen Ag Passenger Car Deliveries In China 2014 to 18. This is part of our Data and Statistics products selection, and you will need a Paid account to download the actual report with accurate data and sources. Downloaded report will contain the editable graph with accurate data, an excel table with the actual data, the exact source of the data and the release date. This slide provides the graph of Passenger Car Deliveries in China of the company Volkswagen AG from the years 2014 to 18. Download it immediately and use it for your business.
-
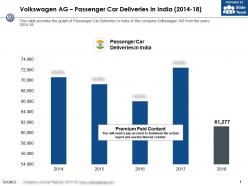 Volkswagen ag passenger car deliveries in india 2014-18
This is a professionally designed visual chart for Volkswagen Ag Passenger Car Deliveries In India 2014 to 18. This is part of our Data and Statistics products selection, and you will need a Paid account to download the actual report with accurate data and sources. Downloaded report will contain the editable graph with accurate data, an excel table with the actual data, the exact source of the data and the release date. This slide provides the graph of Passenger Car Deliveries in India of the company Volkswagen AG from the years 2014 to 18. Download it immediately and use it for your business.
-
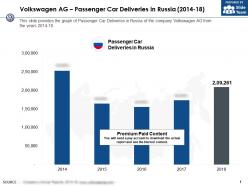 Volkswagen ag passenger car deliveries in russia 2014-18
This is a professionally designed visual chart for Volkswagen Ag Passenger Car Deliveries In Russia 2014 to 18. This is part of our Data and Statistics products selection, and you will need a Paid account to download the actual report with accurate data and sources. Downloaded report will contain the editable graph with accurate data, an excel table with the actual data, the exact source of the data and the release date. This slide provides the graph of Passenger Car Deliveries in Russia of the company Volkswagen AG from the years 2014 to 18. Download it immediately and use it for your business.
-
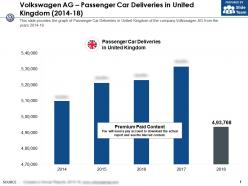 Volkswagen ag passenger car deliveries in united kingdom 2014-18
This is a professionally designed visual chart for Volkswagen Ag Passenger Car Deliveries In United Kingdom 2014 to 18. This is part of our Data and Statistics products selection, and you will need a Paid account to download the actual report with accurate data and sources. Downloaded report will contain the editable graph with accurate data, an excel table with the actual data, the exact source of the data and the release date. This slide provides the graph of Passenger Car Deliveries in United Kingdom of the company Volkswagen AG from the years 2014 to 18. Download it immediately and use it for your business.
-
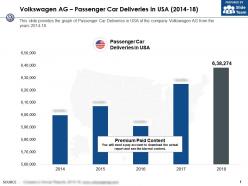 Volkswagen ag passenger car deliveries in usa 2014-18
This is a professionally designed visual chart for Volkswagen Ag Passenger Car Deliveries In USA 2014 to 18. This is part of our Data and Statistics products selection, and you will need a Paid account to download the actual report with accurate data and sources. Downloaded report will contain the editable graph with accurate data, an excel table with the actual data, the exact source of the data and the release date. This slide provides the graph of Passenger Car Deliveries in USA of the company Volkswagen AG from the years 2014 to 18. Download it immediately and use it for your business.
-
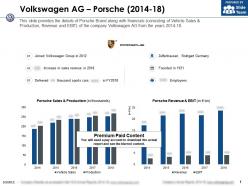 Volkswagen ag porsche 2014-18
This is a professionally designed visual chart for Volkswagen Ag Porsche 2014 to 18. This is part of our Data and Statistics products selection, and you will need a Paid account to download the actual report with accurate data and sources. Downloaded report will contain the editable graph with accurate data, an excel table with the actual data, the exact source of the data and the release date. This slide provides the details of Porsche Brand along with financials consisting of Vehicle Sales and Production, Revenue and EBIT of the company Volkswagen AG from the years 2014 to 18. Download it immediately and use it for your business.
-
 Volkswagen ag r and d expenses 2014-18
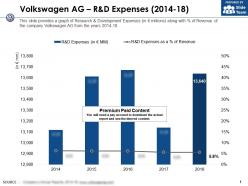
This is a professionally designed visual chart for Volkswagen Ag R And D Expenses 2014 to 18. This is part of our Data and Statistics products selection, and you will need a Paid account to download the actual report with accurate data and sources. Downloaded report will contain the editable graph with accurate data, an excel table with the actual data, the exact source of the data and the release date. This slide provides a graph of Research and Development Expenses in JPY millions along with percent of Revenue of the company Volkswagen AG from the years 2014 to 18. Download it immediately and use it for your business.
-
 Volkswagen ag sales revenue by automotive segment 2014-18
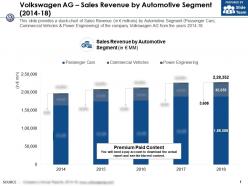
This is a professionally designed visual chart for Volkswagen Ag Sales Revenue By Automotive Segment 2014 to 18. This is part of our Data and Statistics products selection, and you will need a Paid account to download the actual report with accurate data and sources. Downloaded report will contain the editable graph with accurate data, an excel table with the actual data, the exact source of the data and the release date. This slide provides a stack chart of Sales Revenue in JPY millions by Automotive Segment Passenger Cars, Commercial Vehicles and Power Engineering of the company Volkswagen AG from the years 2014 to 18. Download it immediately and use it for your business.
-
 Volkswagen ag sales revenue by market and business area 2018
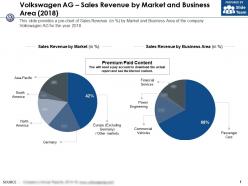
This is a professionally designed visual chart for Volkswagen Ag Sales Revenue By Market And Business Area 2018. This is part of our Data and Statistics products selection, and you will need a Paid account to download the actual report with accurate data and sources. Downloaded report will contain the editable graph with accurate data, an excel table with the actual data, the exact source of the data and the release date. This slide provides a pie chart of Sales Revenue in percent by Market and Business Area of the company Volkswagen AG for the year 2018. Download it immediately and use it for your business.
-
 Volkswagen ag scania 2014-18
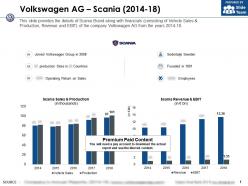
This is a professionally designed visual chart for Volkswagen Ag Scania 2014 to 18. This is part of our Data and Statistics products selection, and you will need a Paid account to download the actual report with accurate data and sources. Downloaded report will contain the editable graph with accurate data, an excel table with the actual data, the exact source of the data and the release date. This slide provides the details of Scania Brand along with financials consisting of Vehicle Sales and Production, Revenue and EBIT of the company Volkswagen AG from the years 2014 to 18. Download it immediately and use it for your business.
-
 Volkswagen ag scania and man commercial vehicles production 2014-18
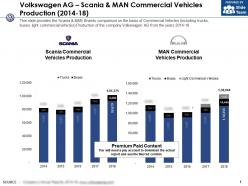
This is a professionally designed visual chart for Volkswagen Ag Scania And Man Commercial Vehicles Production 2014 to 18. This is part of our Data and Statistics products selection, and you will need a Paid account to download the actual report with accurate data and sources. Downloaded report will contain the editable graph with accurate data, an excel table with the actual data, the exact source of the data and the release date. This slide provides the Scania and MAN Brands comparison on the basis of Commercial Vehicles including trucks, buses, light commercial vehicles Production of the company Volkswagen AG from the years 2014 to 18. Download it immediately and use it for your business.
-
 Volkswagen ag seat 2014-18
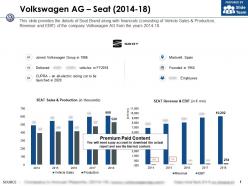
This is a professionally designed visual chart for Volkswagen Ag Seat 2014 to 18. This is part of our Data and Statistics products selection, and you will need a Paid account to download the actual report with accurate data and sources. Downloaded report will contain the editable graph with accurate data, an excel table with the actual data, the exact source of the data and the release date. This slide provides the details of Seat Brand along with financials consisting of Vehicle Sales and Production, Revenue and EBIT of the company Volkswagen AG from the years 2014 to 18. Download it immediately and use it for your business.
-
 Volkswagen ag shareholders equity 2014-18
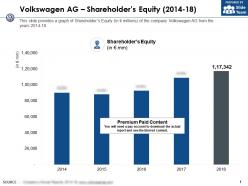
This is a professionally designed visual chart for Volkswagen Ag Shareholders Equity 2014 to 18. This is part of our Data and Statistics products selection, and you will need a Paid account to download the actual report with accurate data and sources. Downloaded report will contain the editable graph with accurate data, an excel table with the actual data, the exact source of the data and the release date. This slide provides a graph of Shareholders Equity in JPY millions of the company Volkswagen AG from the years 2014 to 18. Download it immediately and use it for your business.
-
 Volkswagen ag skoda 2014-18
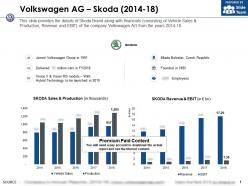
This is a professionally designed visual chart for Volkswagen Ag Skoda 2014 to 18. This is part of our Data and Statistics products selection, and you will need a Paid account to download the actual report with accurate data and sources. Downloaded report will contain the editable graph with accurate data, an excel table with the actual data, the exact source of the data and the release date. This slide provides the details of Skoda Brand along with financials consisting of Vehicle Sales and Production, Revenue and EBIT of the company Volkswagen AG from the years 2014 to 18. Download it immediately and use it for your business.
-
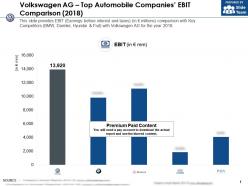 Volkswagen ag top automobile companies ebit comparison 2018
This is a professionally designed visual chart for Volkswagen Ag Top Automobile Companies Ebit Comparison 2018. This is part of our Data and Statistics products selection, and you will need a Paid account to download the actual report with accurate data and sources. Downloaded report will contain the editable graph with accurate data, an excel table with the actual data, the exact source of the data and the release date. This slide provides EBIT Earnings before interest and taxes in JPY millions comparison with Key Competitors BMW, Daimler, Hyundai and Fiat with Volkswagen AG for the year 2018. Download it immediately and use it for your business.
-
 Volkswagen ag top automobile companies employees comparison 2018
This is a professionally designed visual chart for Volkswagen Ag Top Automobile Companies Employees Comparison 2018. This is part of our Data and Statistics products selection, and you will need a Paid account to download the actual report with accurate data and sources. Downloaded report will contain the editable graph with accurate data, an excel table with the actual data, the exact source of the data and the release date. This slide provides Employees comparison with Key Competitors BMW, Daimler, Hyundai and Fiat with Volkswagen AG for the year 2018. Download it immediately and use it for your business.
-
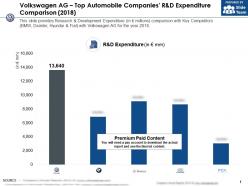 Volkswagen ag top automobile companies r and d expenditure comparison 2018
This is a professionally designed visual chart for Volkswagen Ag Top Automobile Companies R And D Expenditure Comparison 2018. This is part of our Data and Statistics products selection, and you will need a Paid account to download the actual report with accurate data and sources. Downloaded report will contain the editable graph with accurate data, an excel table with the actual data, the exact source of the data and the release date. This slide provides Research and Development Expenditure in JPY millions comparison with Key Competitors BMW, Daimler, Hyundai and Fiat with Volkswagen AG for the year 2018. Download it immediately and use it for your business.
-
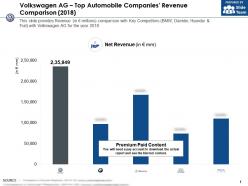 Volkswagen ag top automobile companies revenue comparison 2018
This is a professionally designed visual chart for Volkswagen Ag Top Automobile Companies Revenue Comparison 2018. This is part of our Data and Statistics products selection, and you will need a Paid account to download the actual report with accurate data and sources. Downloaded report will contain the editable graph with accurate data, an excel table with the actual data, the exact source of the data and the release date. This slide provides Revenue in JPY millions comparison with Key Competitors BMW, Daimler, Hyundai and Fiat with Volkswagen AG for the year 2018. Download it immediately and use it for your business.
-
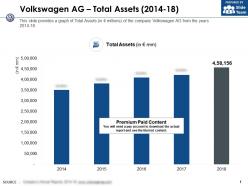 Volkswagen ag total assets 2014-18
This is a professionally designed visual chart for Volkswagen Ag Total Assets 2014 to 18. This is part of our Data and Statistics products selection, and you will need a Paid account to download the actual report with accurate data and sources. Downloaded report will contain the editable graph with accurate data, an excel table with the actual data, the exact source of the data and the release date. This slide provides a graph of Total Assets in JPY millions of the company Volkswagen AG from the years 2014 to 18. Download it immediately and use it for your business.
-
 Volkswagen ag total liabilities and equity 2014-18
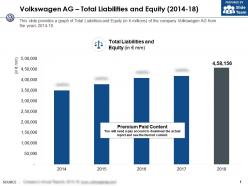
This is a professionally designed visual chart for Volkswagen Ag Total Liabilities And Equity 2014 to 18. This is part of our Data and Statistics products selection, and you will need a Paid account to download the actual report with accurate data and sources. Downloaded report will contain the editable graph with accurate data, an excel table with the actual data, the exact source of the data and the release date. This slide provides a graph of Total Liabilities and Equity in JPY millions of the company Volkswagen AG from the years 2014 to 18. Download it immediately and use it for your business.
-
 Volkswagen ag traton group 2015-18
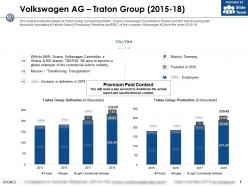
This is a professionally designed visual chart for Volkswagen Ag Traton Group 2015 to 18. This is part of our Data and Statistics products selection, and you will need a Paid account to download the actual report with accurate data and sources. Downloaded report will contain the editable graph with accurate data, an excel table with the actual data, the exact source of the data and the release date. This slide provides the details of Traton Group comprising of MAN, Scania, Volkswagen Caminhoes e Onibus and RIO brands along with financials consisting of Vehicle Sales and Production, Revenue and EBIT of the company Volkswagen AG from the years 2015 to 18. Download it immediately and use it for your business.
-
 Volkswagen ag vehicle sales by business area 2014-18
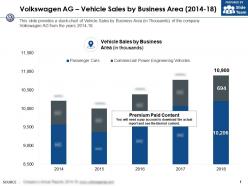
This is a professionally designed visual chart for Volkswagen Ag Vehicle Sales By Business Area 2014 to 18. This is part of our Data and Statistics products selection, and you will need a Paid account to download the actual report with accurate data and sources. Downloaded report will contain the editable graph with accurate data, an excel table with the actual data, the exact source of the data and the release date. This slide provides a stack chart of Vehicle Sales by Business Area in Thousands of the company Volkswagen AG from the years 2014 to 18. Download it immediately and use it for your business.
-
 Volkswagen ag vehicle sales by market 2014-18
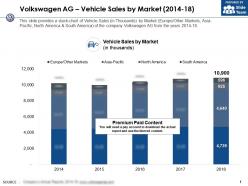
This is a professionally designed visual chart for Volkswagen Ag Vehicle Sales By Market 2014 to 18. This is part of our Data and Statistics products selection, and you will need a Paid account to download the actual report with accurate data and sources. Downloaded report will contain the editable graph with accurate data, an excel table with the actual data, the exact source of the data and the release date. This slide provides a stack chart of Vehicle Sales in Thousands by Market Europe Other Markets, Asia Pacific, North America and South America of the company Volkswagen AG from the years 2014 to 18. Download it immediately and use it for your business.
-
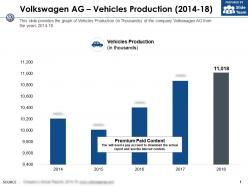 Volkswagen ag vehicles production 2014-18
This is a professionally designed visual chart for Volkswagen Ag Vehicles Production 2014 to 18. This is part of our Data and Statistics products selection, and you will need a Paid account to download the actual report with accurate data and sources. Downloaded report will contain the editable graph with accurate data, an excel table with the actual data, the exact source of the data and the release date. This slide provides the graph of Vehicles Production in Thousands of the company Volkswagen AG from the years 2014 to 18. Download it immediately and use it for your business.
-
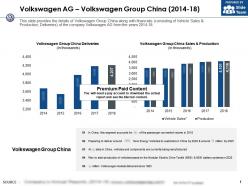 Volkswagen ag volkswagen group china 2014-18
This is a professionally designed visual chart for Volkswagen Ag Volkswagen Group China 2014 to 18. This is part of our Data and Statistics products selection, and you will need a Paid account to download the actual report with accurate data and sources. Downloaded report will contain the editable graph with accurate data, an excel table with the actual data, the exact source of the data and the release date. This slide provides the details of Volkswagen Group China along with financials consisting of Vehicle Sales and Production, Deliveries of the company Volkswagen AG from the years 2014 to 18. Download it immediately and use it for your business.
-
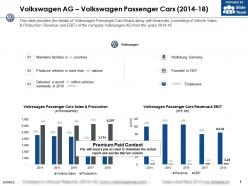 Volkswagen ag volkswagen passenger cars 2014-18
This is a professionally designed visual chart for Volkswagen Ag Volkswagen Passenger Cars 2014 to 18. This is part of our Data and Statistics products selection, and you will need a Paid account to download the actual report with accurate data and sources. Downloaded report will contain the editable graph with accurate data, an excel table with the actual data, the exact source of the data and the release date. This slide provides the details of Volkswagen Passenger Cars Brand along with financials consisting of Vehicle Sales Production, Revenue and EBIT of the company Volkswagen AG from the years 2014 to 18. Download it immediately and use it for your business.
-
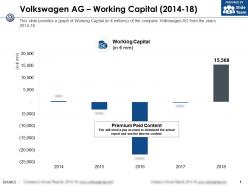 Volkswagen ag working capital 2014-18
This is a professionally designed visual chart for Volkswagen Ag Working Capital 2014 to 18. This is part of our Data and Statistics products selection, and you will need a Paid account to download the actual report with accurate data and sources. Downloaded report will contain the editable graph with accurate data, an excel table with the actual data, the exact source of the data and the release date. This slide provides a graph of Working Capital in JPY millions of the company Volkswagen AG from the years 2014 to 18. Download it immediately and use it for your business.
-
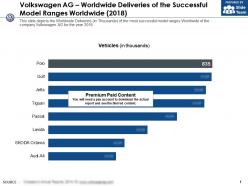 Volkswagen ag worldwide deliveries of the successful model ranges worldwide 2018
This is a professionally designed visual chart for Volkswagen Ag Worldwide Deliveries Of The Successful Model Ranges Worldwide 2018. This is part of our Data and Statistics products selection, and you will need a Paid account to download the actual report with accurate data and sources. Downloaded report will contain the editable graph with accurate data, an excel table with the actual data, the exact source of the data and the release date. This slide depicts the Worldwide Deliveries in Thousands of the most successful model ranges Worldwide of the company Volkswagen AG for the year 2018. Download it immediately and use it for your business.
-
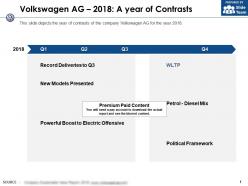 Volkswagen ag 2018 a year of contrasts
The information presented in this slide has been researched by our team of professional business analysts. This is part of our Company Profiles products selection, and you will need a Paid account to download the actual report with accurate data and sources. Downloaded report will be in Powerpoint and will contain the actual editable slides with the actual data and sources for each data. This slide depicts the year of contrasts of the company Volkswagen AG for the year 2018. Download it immediately and use it for your business.
-
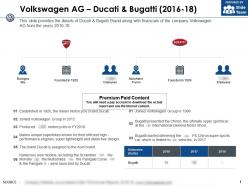 Volkswagen ag ducati and bugatti 2016-18
The information presented in this slide has been researched by our team of professional business analysts. This is part of our Company Profiles products selection, and you will need a Paid account to download the actual report with accurate data and sources. Downloaded report will be in Powerpoint and will contain the actual editable slides with the actual data and sources for each data. This slide provides the details of Ducati and Bugatti Brand along with financials of the company Volkswagen AG from the years 2016 to 18. Download it immediately and use it for your business.
-
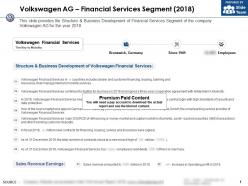 Volkswagen ag financial services segment 2018
The information presented in this slide has been researched by our team of professional business analysts. This is part of our Company Profiles products selection, and you will need a Paid account to download the actual report with accurate data and sources. Downloaded report will be in Powerpoint and will contain the actual editable slides with the actual data and sources for each data. This slide provides the Structure and Business Development of Financial Services Segment of the company Volkswagen AG for the year 2018. Download it immediately and use it for your business.
-
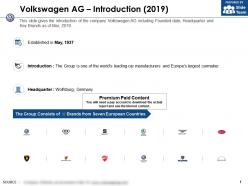 Volkswagen ag introduction 2019
The information presented in this slide has been researched by our team of professional business analysts. This is part of our Company Profiles products selection, and you will need a Paid account to download the actual report with accurate data and sources. Downloaded report will be in Powerpoint and will contain the actual editable slides with the actual data and sources for each data. This slide gives the introduction of the company Volkswagen AG including Founded date, Headquarter and Key Brands as of Mar 2019. Download it immediately and use it for your business.
-
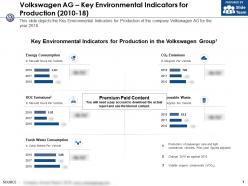 Volkswagen ag key environmental indicators for production 2010-18
The information presented in this slide has been researched by our team of professional business analysts. This is part of our Company Profiles products selection, and you will need a Paid account to download the actual report with accurate data and sources. Downloaded report will be in Powerpoint and will contain the actual editable slides with the actual data and sources for each data. This slide depicts the Key Environmental Indicators for Production of the company Volkswagen AG for the year 2018. Download it immediately and use it for your business.
-
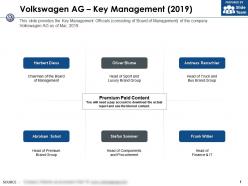 Volkswagen ag key management 2019
The information presented in this slide has been researched by our team of professional business analysts. This is part of our Company Profiles products selection, and you will need a Paid account to download the actual report with accurate data and sources. Downloaded report will be in Powerpoint and will contain the actual editable slides with the actual data and sources for each data. This slide provides the Key Management Officials consisting of Board of Management of the company Volkswagen AG as of Mar 2019. Download it immediately and use it for your business.
-
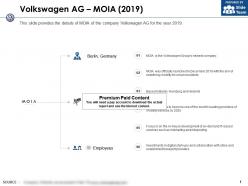 Volkswagen ag moia 2019
The information presented in this slide has been researched by our team of professional business analysts. This is part of our Company Profiles products selection, and you will need a Paid account to download the actual report with accurate data and sources. Downloaded report will be in Powerpoint and will contain the actual editable slides with the actual data and sources for each data. This slide provides the details of MOIA of the company Volkswagen AG for the year 2019. Download it immediately and use it for your business.
-
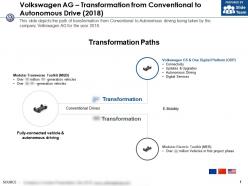 Volkswagen ag transformation from conventional to autonomous drive 2018
The information presented in this slide has been researched by our team of professional business analysts. This is part of our Company Profiles products selection, and you will need a Paid account to download the actual report with accurate data and sources. Downloaded report will be in Powerpoint and will contain the actual editable slides with the actual data and sources for each data. This slide depicts the path of transformation from Conventional to Autonomous driving being taken by the company Volkswagen AG for the year 2018. Download it immediately and use it for your business.
-
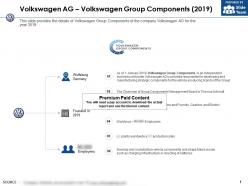 Volkswagen ag volkswagen group components 2019
The information presented in this slide has been researched by our team of professional business analysts. This is part of our Company Profiles products selection, and you will need a Paid account to download the actual report with accurate data and sources. Downloaded report will be in Powerpoint and will contain the actual editable slides with the actual data and sources for each data. This slide provides the details of Volkswagen Group Components of the company Volkswagen AG for the year 2019. Download it immediately and use it for your business.
-
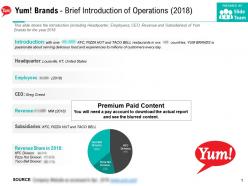 Yum brands brief introduction of operations 2018
The information presented in this slide has been researched by our team of professional business analysts. This is part of our Company Profiles products selection, and you will need a Paid account to download the actual report with accurate data and sources. Downloaded report will be in Powerpoint and will contain the actual editable slides with the actual data and sources for each data. This slide shows the Introduction including Headquarter, Employees, CEO, Revenue and Subsidiaries of Yum Brands for the year 2018. Download it immediately and use it for your business.
-
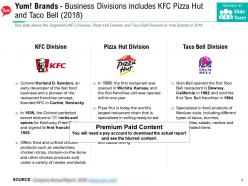 Yum brands business divisions includes kfc pizza hut and taco bell 2018
The information presented in this slide has been researched by our team of professional business analysts. This is part of our Company Profiles products selection, and you will need a Paid account to download the actual report with accurate data and sources. Downloaded report will be in Powerpoint and will contain the actual editable slides with the actual data and sources for each data. This slide shows the Segments KFC Division, Pizza Hut Division and Taco Bell Division of Yum Brands in 2018. Download it immediately and use it for your business.
-
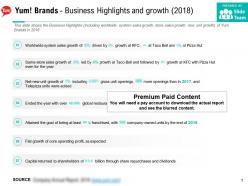 Yum brands business highlights and growth 2018
The information presented in this slide has been researched by our team of professional business analysts. This is part of our Company Profiles products selection, and you will need a Paid account to download the actual report with accurate data and sources. Downloaded report will be in Powerpoint and will contain the actual editable slides with the actual data and sources for each data. This slide shows the Business Highlights Including worldwide system sales growth, store sales growth, new unit growth of Yum Brands in 2018. Download it immediately and use it for your business.


