Software Products And Services Company Profile Powerpoint Presentation Slides
A Company profile is a professional introduction of an organization that aims to inform stakeholders about products and services offered by the firm. Grab our competently designed Software Products and Services Company Profile template that provides a brief overview of the company with business information, key financials, awards and recognition, and an executive summary. The slides showcase the business model canvas to describe operations, cost structure, value proposition, and firm revenue streams. It also includes a historical timeline, international presence, and key people of the management team. Furthermore, it shows the workforce structure inside the company and organizational structure depicting hierarchy based on employee roles. The profile also covers shareholding patterns, work culture reports, company clients, and client testimonials. Additionally, It highlights the financials by illustrating recent revenue trends, gross profit, EBITDA, operating profit, net profit, revenue split by geography, global revenue trend, and financial statements. It further shows SWOT analysis, expansion strategies, CSR activities and spend, and a case study. Download it now.
- Google Slides is a new FREE Presentation software from Google.
- All our content is 100% compatible with Google Slides.
- Just download our designs, and upload them to Google Slides and they will work automatically.
- Amaze your audience with SlideTeam and Google Slides.
-
Want Changes to This PPT Slide? Check out our Presentation Design Services
- WideScreen Aspect ratio is becoming a very popular format. When you download this product, the downloaded ZIP will contain this product in both standard and widescreen format.
-

- Some older products that we have may only be in standard format, but they can easily be converted to widescreen.
- To do this, please open the SlideTeam product in Powerpoint, and go to
- Design ( On the top bar) -> Page Setup -> and select "On-screen Show (16:9)” in the drop down for "Slides Sized for".
- The slide or theme will change to widescreen, and all graphics will adjust automatically. You can similarly convert our content to any other desired screen aspect ratio.
Compatible With Google Slides

Get This In WideScreen
You must be logged in to download this presentation.
PowerPoint presentation slides
Deliver this complete deck to your team members and other collaborators. Encompassed with stylized slides presenting various concepts, this Software Products And Services Company Profile Powerpoint Presentation Slides is the best tool you can utilize. Personalize its content and graphics to make it unique and thought-provoking. All the fourty nine slides are editable and modifiable, so feel free to adjust them to your business setting. The font, color, and other components also come in an editable format making this PPT design the best choice for your next presentation. So, download now.
People who downloaded this PowerPoint presentation also viewed the following :
Content of this Powerpoint Presentation
Slide 1: This slide displays title i.e. 'Software Products and Services Company Profile' and your Company Name.
Slide 2: This slide presents table of contents.
Slide 3: This slide also shows table of contents.
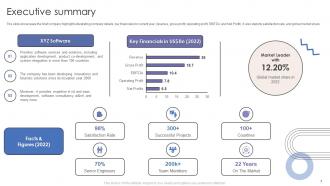
Slide 4: The slide showcases the brief company highlights illustrating company details, key financials for current year.
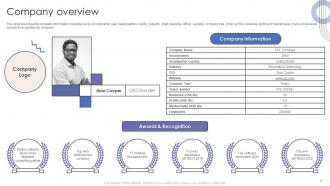
Slide 5: The slide describes the company information including name, incorporation year, headquarters country, industry, chief executive officer, etc.
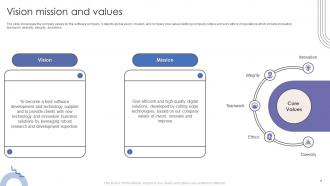
Slide 6: The slide showcases the company values for the software company.
Slide 7: This slide depicts four product categories which include software, products, platforms, and others.
Slide 8: The slide highlights four domains of exclusive expertise provided by company which include IoT development, Enterprise Solution, etc.
Slide 9: The slide showcases four areas of services from our experienced team of engineers which are software consultancy, UX/UI Design, Quality Assurance and Code Audit.
Slide 10: This slide showcases the latest technologies leveraged in organisation to provide improved the services and new solutions.
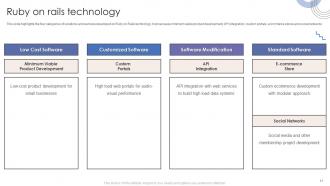
Slide 11: This slide highlights the four categories of solutions and services developed on Ruby on Rails technology.
Slide 12: This slide showcases tools and solutions for predictive modelling, natural language processing and artificial vision.
Slide 13: This slide showcases data engineering, database management, data visualization and multi system data integration tools.
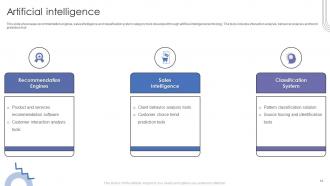
Slide 14: This slide showcases recommendation engines, sales intelligence and classification system category tools.
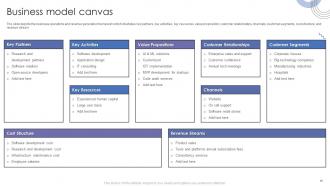
Slide 15: The slide depicts the business operations and revenue generation framework which illustrates key partners, key activities, etc.
Slide 16: The slide highlights the timeline of company from incorporation to current year.
Slide 17: The slide illustrates the global footprint of company providing digital solutions and services.
Slide 18: The slide highlights the chief executive officer & founder, chief technology officer, chief financial officer, etc.
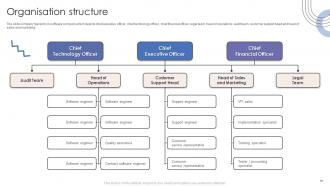
Slide 19: The slide company hierarchy in software company which depicts chief executive officer, chief technology officer, chief financial officer, etc.
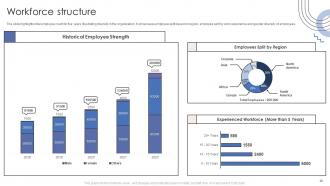
Slide 20: The slide highlights total employee count for five years illustrating diversity in the organization.
Slide 21: The slide highlights the company ownership structure and FII holdings for financial year 2022.
Slide 22: The slide showcases work culture and diversity report for FY22 illustrating key ranking criteria.
Slide 23: The slide highlights the list of major business clients for software companies.
Slide 24: The slide highlights the customer feedback post for software company solutions and services to build credibility and trust among clients.
Slide 25: The slide shows annual revenue growth of the company with the CAGR for last five financial years from 2018 to 2022.
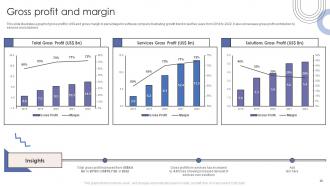
Slide 26: This slide illustrates a graph of gross profit in US$ and gross margin in percentage for software company.
Slide 27: This slide illustrates a graph of EBITDA in US$ and margin in percentage for software company.
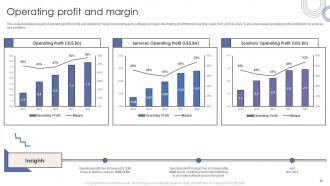
Slide 28: This slide illustrates a graph of operating profit in US$ and operating margin in percentage for software company.
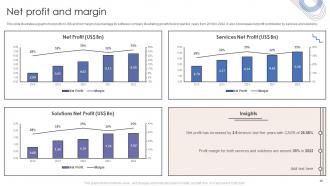
Slide 29: This slide illustrates a graph of net profit in US$ and net margin in percentage for software company.
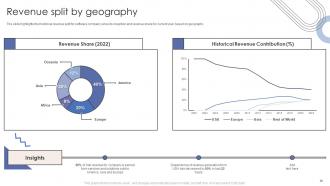
Slide 30: The slide highlights the historical revenue split for software company since its inception and revenue share for current year based on geography.
Slide 31: The slide highlights the global revenue earnings for FY22 to understand the major customers based on geography.
Slide 32: The slide showcases income statement, balance sheet and cashflow statement of last five years to represent current financial position of organisation.
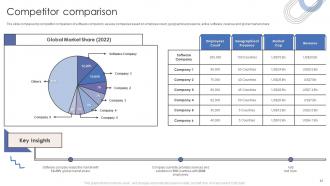
Slide 33: The slide compares top competitor comparison of software company to assess companies based on employee count, geographical presence, etc.
Slide 34: The slide showcases strength, opportunity, weakness and threats of company to estimate company’s future prospects.
Slide 35: The slide showcases business expansion, joint venture and acquisition as the form of expansion strategies along with their success rate in last 12 years.
Slide 36: The slide highlights the major corporate social responsibility activities performed by company based on three categories people, environment and welfare.
Slide 37: The slide describes the spending on corporate social responsibility for last five years.
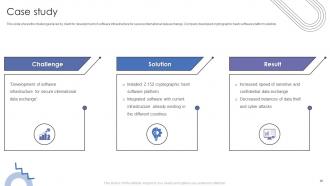
Slide 38: This slide shows the challenges faced by client for development of software infrastructure for secure international data exchange.
Slide 39: This is the icons slide.
Slide 40: This slide presents title for additional slides.
Slide 41: This slide shows about your company, target audience and its client's values.
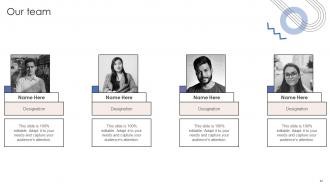
Slide 42: This slide shows details of team members like name, designation, etc.
Slide 43: This slide displays goals of your company.
Slide 44: This slide depicts posts for past experiences of clients.
Slide 45: This slide displays Venn.
Slide 46: This slide shows yearly column charts for different products. The charts are linked to Excel.
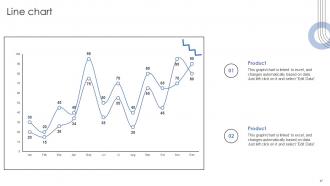
Slide 47: This slide exhibits monthly line charts for different products. The charts are linked to Excel.
Slide 48: This slide exhibits yearly timeline.
Slide 49: This is thank you slide & contains contact details of company like office address, phone no., etc.
Software Products And Services Company Profile Powerpoint Presentation Slides with all 54 slides:
Use our Software Products And Services Company Profile Powerpoint Presentation Slides to effectively help you save your valuable time. They are readymade to fit into any presentation structure.
-
Awesome use of colors and designs in product templates.
-
A beautiful, professional design paired with high-quality images and content that is sure to impress. It is a must-use PPT template in my opinion.


