Trade and Retail Company Profile PowerPoint Presentation Templates
- Sub Categories
-
- Architecture and Design Services
- Automotive
- Beauty and Cosmetics
- BFSI
- Consumer Goods and FMCG
- E-Commerce
- Edtech
- Electronics
- Energy
- Fashion
- Food and Agriculture
- Food delivery
- General
- Healthcare
- International Trade
- IT
- Legal
- Logistic and Supply Chain
- Marketing and Sales
- Media and Entertainment
- Payment Solution
- Professional Services
- Quick Service Restaurant
- Real Estate and Construction
- Retail and FMCG
- Retail and Trade
- Social Media
- Telecommunications media and technology services
- Transportation mobility
- Travel and Tourism
-
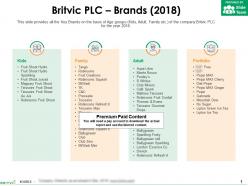 Britvic plc brands 2018
The information presented in this slide has been researched by our team of professional business analysts. This is part of our Company Profiles products selection, and you will need a Paid account to download the actual report with accurate data and sources. Downloaded report will be in Powerpoint and will contain the actual editable slides with the actual data and sources for each data. This slide provides all the Key Brands on the basis of Age groups Kids, Adult, Family etc. of the company Britvic PLC for the year 2018. Download it immediately and use it for your business.
-
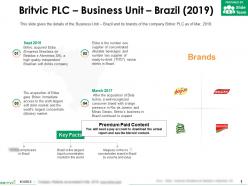 Britvic plc business unit brazil 2019
The information presented in this slide has been researched by our team of professional business analysts. This is part of our Company Profiles products selection, and you will need a Paid account to download the actual report with accurate data and sources. Downloaded report will be in Powerpoint and will contain the actual editable slides with the actual data and sources for each data. This slide gives the details of the Business Unit Brazil and its brands of the company Britvic PLC as of Mar 2019. Download it immediately and use it for your business.
-
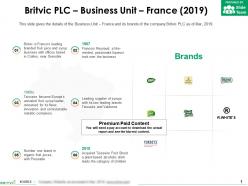 Britvic plc business unit france 2019
The information presented in this slide has been researched by our team of professional business analysts. This is part of our Company Profiles products selection, and you will need a Paid account to download the actual report with accurate data and sources. Downloaded report will be in Powerpoint and will contain the actual editable slides with the actual data and sources for each data. This slide gives the details of the Business Unit France and its brands of the company Britvic PLC as of Mar 2019. Download it immediately and use it for your business.
-
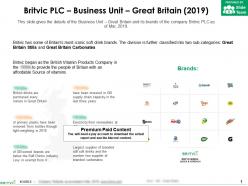 Britvic plc business unit great britain 2019
The information presented in this slide has been researched by our team of professional business analysts. This is part of our Company Profiles products selection, and you will need a Paid account to download the actual report with accurate data and sources. Downloaded report will be in Powerpoint and will contain the actual editable slides with the actual data and sources for each data. This slide gives the details of the Business Unit Great Britain and its brands of the company Britvic PLC as of Mar 2019. Download it immediately and use it for your business.
-
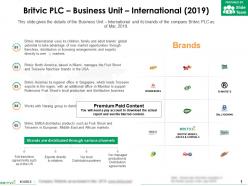 Britvic plc business unit international 2019
The information presented in this slide has been researched by our team of professional business analysts. This is part of our Company Profiles products selection, and you will need a Paid account to download the actual report with accurate data and sources. Downloaded report will be in Powerpoint and will contain the actual editable slides with the actual data and sources for each data. This slide gives the details of the Business Unit International and its brands of the company Britvic PLC as of Mar 2019. Download it immediately and use it for your business.
-
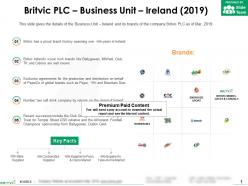 Britvic plc business unit ireland 2019
The information presented in this slide has been researched by our team of professional business analysts. This is part of our Company Profiles products selection, and you will need a Paid account to download the actual report with accurate data and sources. Downloaded report will be in Powerpoint and will contain the actual editable slides with the actual data and sources for each data. This slide gives the details of the Business Unit Ireland and its brands of the company Britvic PLC as of Mar 2019. Download it immediately and use it for your business.
-
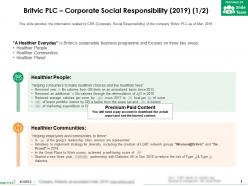 Britvic plc corporate social responsibility 2019
The information presented in this slide has been researched by our team of professional business analysts. This is part of our Company Profiles products selection, and you will need a Paid account to download the actual report with accurate data and sources. Downloaded report will be in Powerpoint and will contain the actual editable slides with the actual data and sources for each data. This slide provides the information related to CSR Corporate Social Responsibility of the company Britvic PLC as of Mar 2019. Download it immediately and use it for your business.
-
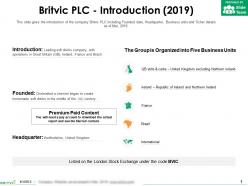 Britvic plc introduction 2019
The information presented in this slide has been researched by our team of professional business analysts. This is part of our Company Profiles products selection, and you will need a Paid account to download the actual report with accurate data and sources. Downloaded report will be in Powerpoint and will contain the actual editable slides with the actual data and sources for each data. This slide gives the introduction of the company Britvic PLC including Founded date, Headquarter, Business units and Ticker details as of Mar 2019. Download it immediately and use it for your business.
-
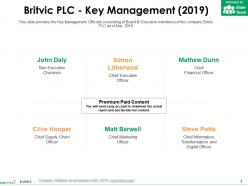 Britvic plc key management 2019
The information presented in this slide has been researched by our team of professional business analysts. This is part of our Company Profiles products selection, and you will need a Paid account to download the actual report with accurate data and sources. Downloaded report will be in Powerpoint and will contain the actual editable slides with the actual data and sources for each data. This slide provides the Key Management Officials consisting of Board and Executive members of the company Britvic PLC as of Mar 2019. Download it immediately and use it for your business.
-
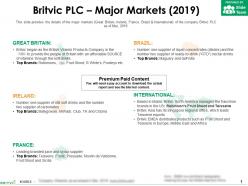 Britvic plc major markets 2019
The information presented in this slide has been researched by our team of professional business analysts. This is part of our Company Profiles products selection, and you will need a Paid account to download the actual report with accurate data and sources. Downloaded report will be in Powerpoint and will contain the actual editable slides with the actual data and sources for each data. This slide provides the details of the major markets Great Britain, Ireland, France, Brazil and International of the company Britvic PLC as of Mar 2019. Download it immediately and use it for your business.
-
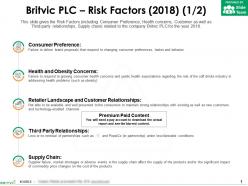 Britvic plc risk factors 2018
The information presented in this slide has been researched by our team of professional business analysts. This is part of our Company Profiles products selection, and you will need a Paid account to download the actual report with accurate data and sources. Downloaded report will be in Powerpoint and will contain the actual editable slides with the actual data and sources for each data. This slide gives the Risk Factors including Consumer Preference, Health concerns, Customer as well as Third party relationships, Supply chain related to the company Britvic PLC for the year 2018. Download it immediately and use it for your business.
-
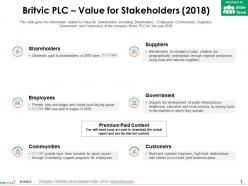 Britvic plc value for stakeholders 2018
The information presented in this slide has been researched by our team of professional business analysts. This is part of our Company Profiles products selection, and you will need a Paid account to download the actual report with accurate data and sources. Downloaded report will be in Powerpoint and will contain the actual editable slides with the actual data and sources for each data. This slide gives the information related to Value for Stakeholders including Shareholders, Employees, Communities, Suppliers, Government and Customers of the company Britvic PLC for the year 2018. Download it immediately and use it for your business.
-
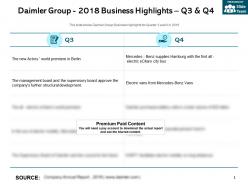 Daimler group 2018 business highlights q3 and q4
The information presented in this slide has been researched by our team of professional business analysts. This is part of our Company Profiles products selection, and you will need a Paid account to download the actual report with accurate data and sources. Downloaded report will be in Powerpoint and will contain the actual editable slides with the actual data and sources for each data. This slide shows Daimler Group Business Highlights for Quarter 3 and 4 in 2018. Download it immediately and use it for your business.
-
 Daimler group composition 2017-18
The information presented in this slide has been researched by our team of professional business analysts. This is part of our Company Profiles products selection, and you will need a Paid account to download the actual report with accurate data and sources. Downloaded report will be in Powerpoint and will contain the actual editable slides with the actual data and sources for each data. This slide shows Daimler Group Composition stating subsidiaries for the year 2017 to 2018. Download it immediately and use it for your business.
-
 Daimler group divisions key competitors list 2018
The information presented in this slide has been researched by our team of professional business analysts. This is part of our Company Profiles products selection, and you will need a Paid account to download the actual report with accurate data and sources. Downloaded report will be in Powerpoint and will contain the actual editable slides with the actual data and sources for each data. This slide shows the list of Key Competitors of Daimler Group for every division for the year 2018. Download it immediately and use it for your business.
-
 Daimler group cash and cash equivalent at end of period 2014-18
This is a professionally designed visual chart for Daimler Group Cash And Cash Equivalent At End Of Period 2014 to 18. This is part of our Data and Statistics products selection, and you will need a Paid account to download the actual report with accurate data and sources. Downloaded report will contain the editable graph with accurate data, an excel table with the actual data, the exact source of the data and the release date. This slide shows Daimler Group Cash and Cash Equivalent at year end from the years 2014 to 2018. Download it immediately and use it for your business.
-
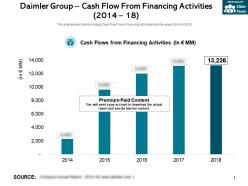 Daimler group cash flow from financing activities 2014-18
This is a professionally designed visual chart for Daimler Group Cash Flow From Financing Activities 2014 to 18. This is part of our Data and Statistics products selection, and you will need a Paid account to download the actual report with accurate data and sources. Downloaded report will contain the editable graph with accurate data, an excel table with the actual data, the exact source of the data and the release date. This slide shows Daimler Group Cash Flow From Financing Activities from the years 2014 to 2018. Download it immediately and use it for your business.
-
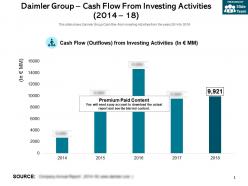 Daimler group cash flow from investing activities 2014-18
This is a professionally designed visual chart for Daimler Group Cash Flow From Investing Activities 2014 to 18. This is part of our Data and Statistics products selection, and you will need a Paid account to download the actual report with accurate data and sources. Downloaded report will contain the editable graph with accurate data, an excel table with the actual data, the exact source of the data and the release date. This slide shows Daimler Group Cash flow from investing Activities from the years 2014 to 2018. Download it immediately and use it for your business.
-
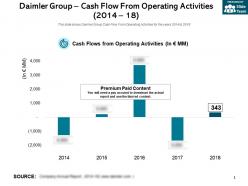 Daimler group cash flow from operating activities 2014-18
This is a professionally designed visual chart for Daimler Group Cash Flow From Operating Activities 2014 to 18. This is part of our Data and Statistics products selection, and you will need a Paid account to download the actual report with accurate data and sources. Downloaded report will contain the editable graph with accurate data, an excel table with the actual data, the exact source of the data and the release date. This slide shows Daimler Group Cash Flow From Operating Activities for the years 2014 to 2018. Download it immediately and use it for your business.
-
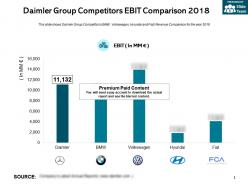 Daimler group competitors ebit comparison 2018
This is a professionally designed visual chart for Daimler Group Competitors Ebit Comparison 2018. This is part of our Data and Statistics products selection, and you will need a Paid account to download the actual report with accurate data and sources. Downloaded report will contain the editable graph with accurate data, an excel table with the actual data, the exact source of the data and the release date. This slide shows Daimler Group Competitors BMW, Volkswagen, Hyundai and Fiat Revenue Comparison for the year 2018. Download it immediately and use it for your business.
-
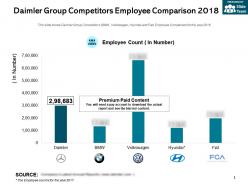 Daimler group competitors employee comparison 2018
This is a professionally designed visual chart for Daimler Group Competitors Employee Comparison 2018. This is part of our Data and Statistics products selection, and you will need a Paid account to download the actual report with accurate data and sources. Downloaded report will contain the editable graph with accurate data, an excel table with the actual data, the exact source of the data and the release date. This slide shows Daimler Group Competitors BMW, Volkswagen, Hyundai and Fiat Employee Comparison for the year 2018. Download it immediately and use it for your business.
-
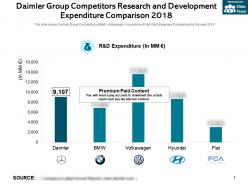 Daimler group competitors research and development expenditure comparison 2018
This is a professionally designed visual chart for Daimler Group Competitors Research And Development Expenditure Comparison 2018. This is part of our Data and Statistics products selection, and you will need a Paid account to download the actual report with accurate data and sources. Downloaded report will contain the editable graph with accurate data, an excel table with the actual data, the exact source of the data and the release date. This slide shows Daimler Group Competitors BMW, Volkswagen, Hyundai and Fiat R and D Expenses Comparison for the year 2018. Download it immediately and use it for your business.
-
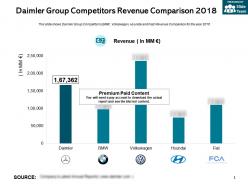 Daimler group competitors revenue comparison 2018
This is a professionally designed visual chart for Daimler Group Competitors Revenue Comparison 2018. This is part of our Data and Statistics products selection, and you will need a Paid account to download the actual report with accurate data and sources. Downloaded report will contain the editable graph with accurate data, an excel table with the actual data, the exact source of the data and the release date. This slide shows Daimler Group Competitors BMW, Volkswagen, Hyundai and Fiat Revenue Comparison for the year 2018. Download it immediately and use it for your business.
-
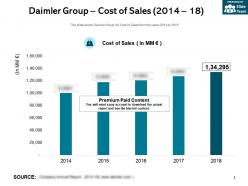 Daimler group cost of sales 2014-18
This is a professionally designed visual chart for Daimler Group Cost Of Sales 2014 to 18. This is part of our Data and Statistics products selection, and you will need a Paid account to download the actual report with accurate data and sources. Downloaded report will contain the editable graph with accurate data, an excel table with the actual data, the exact source of the data and the release date. This slide shows Daimler Group AG Cost of Sales from the years 2014 to 2018. Download it immediately and use it for your business.
-
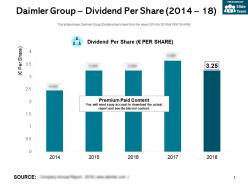 Daimler group dividend per share 2014-18
This is a professionally designed visual chart for Daimler Group Dividend Per Share 2014 to 18. This is part of our Data and Statistics products selection, and you will need a Paid account to download the actual report with accurate data and sources. Downloaded report will contain the editable graph with accurate data, an excel table with the actual data, the exact source of the data and the release date. This slide shows Daimler Group Dividend per share from the years 2014 to 2018 JPY PER SHARE. Download it immediately and use it for your business.
-
 Daimler group ebit by divisions 2014-2018
This is a professionally designed visual chart for Daimler Group Ebit By Divisions 2014 to 2018. This is part of our Data and Statistics products selection, and you will need a Paid account to download the actual report with accurate data and sources. Downloaded report will contain the editable graph with accurate data, an excel table with the actual data, the exact source of the data and the release date. This slide shows Daimler Group EBIT earnings before interest and taxes by Divisions from the years 2014 to 18. Download it immediately and use it for your business.
-
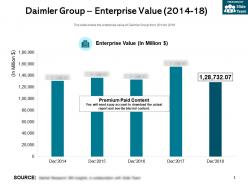 Daimler group enterprise value 2014-18
This is a professionally designed visual chart for Daimler Group Enterprise Value 2014 to 18. This is part of our Data and Statistics products selection, and you will need a Paid account to download the actual report with accurate data and sources. Downloaded report will contain the editable graph with accurate data, an excel table with the actual data, the exact source of the data and the release date. This slide shows the enterprise value of Daimler Group from 2014 to 2018. Download it immediately and use it for your business.
-
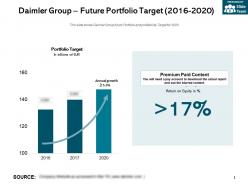 Daimler group future portfolio target 2016-2020
This is a professionally designed visual chart for Daimler Group Future Portfolio Target 2016 to 2020. This is part of our Data and Statistics products selection, and you will need a Paid account to download the actual report with accurate data and sources. Downloaded report will contain the editable graph with accurate data, an excel table with the actual data, the exact source of the data and the release date. This slide shows Daimler Group future Portfolio and profitability Target for 2020. Download it immediately and use it for your business.
-
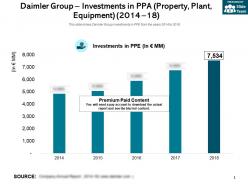 Daimler group investments in ppa property plant equipment 2014-18
This is a professionally designed visual chart for Daimler Group Investments In PPA Property Plant Equipment 2014 to 18. This is part of our Data and Statistics products selection, and you will need a Paid account to download the actual report with accurate data and sources. Downloaded report will contain the editable graph with accurate data, an excel table with the actual data, the exact source of the data and the release date. This slide shows Daimler Group investments in PPE from the years 2014 to 2018. Download it immediately and use it for your business.
-
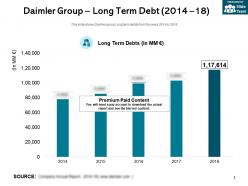 Daimler group long term debt 2014-18
This is a professionally designed visual chart for Daimler Group Long Term Debt 2014 to 18. This is part of our Data and Statistics products selection, and you will need a Paid account to download the actual report with accurate data and sources. Downloaded report will contain the editable graph with accurate data, an excel table with the actual data, the exact source of the data and the release date. This slide shows Daimler group Long term debts from the years 2014 to 2018. Download it immediately and use it for your business.
-
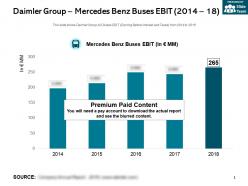 Daimler group mercedes benz buses ebit 2014-18
This is a professionally designed visual chart for Daimler Group Mercedes Benz Buses Ebit 2014 to 18. This is part of our Data and Statistics products selection, and you will need a Paid account to download the actual report with accurate data and sources. Downloaded report will contain the editable graph with accurate data, an excel table with the actual data, the exact source of the data and the release date. This slide shows Daimler Group AG Buses EBIT Earning Before Interest and Taxes from 2014 to 2018. Download it immediately and use it for your business.
-
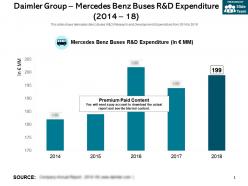 Daimler group mercedes benz buses r and d expenditure 2014-18
This is a professionally designed visual chart for Daimler Group Mercedes Benz Buses R And D Expenditure 2014 to 18. This is part of our Data and Statistics products selection, and you will need a Paid account to download the actual report with accurate data and sources. Downloaded report will contain the editable graph with accurate data, an excel table with the actual data, the exact source of the data and the release date. This slide shows Mercedes Benz Buses R and D Research and Development Expenditure from 2014 to 2018. Download it immediately and use it for your business.
-
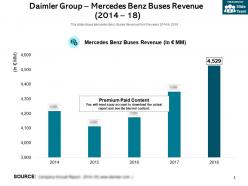 Daimler group mercedes benz buses revenue 2014-18
This is a professionally designed visual chart for Daimler Group Mercedes Benz Buses Revenue 2014 to 18. This is part of our Data and Statistics products selection, and you will need a Paid account to download the actual report with accurate data and sources. Downloaded report will contain the editable graph with accurate data, an excel table with the actual data, the exact source of the data and the release date. This slide shows Mercedes Benz Buses Revenue from the years 2014 to 2018. Download it immediately and use it for your business.
-
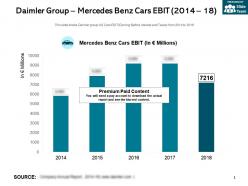 Daimler group mercedes benz cars ebit 2014-18
This is a professionally designed visual chart for Daimler Group Mercedes Benz Cars Ebit 2014 to 18. This is part of our Data and Statistics products selection, and you will need a Paid account to download the actual report with accurate data and sources. Downloaded report will contain the editable graph with accurate data, an excel table with the actual data, the exact source of the data and the release date. This slide shows Daimler group AG Cars EBIT Earning Before Interest and Taxes from 2014 to 2018. Download it immediately and use it for your business.
-
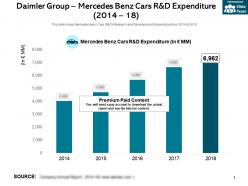 Daimler group mercedes benz cars r and d expenditure 2014-18
This is a professionally designed visual chart for Daimler Group Mercedes Benz Cars R And D Expenditure 2014 to 18. This is part of our Data and Statistics products selection, and you will need a Paid account to download the actual report with accurate data and sources. Downloaded report will contain the editable graph with accurate data, an excel table with the actual data, the exact source of the data and the release date. This slide shows Mercedes Benz Cars R and D Research and Development Expenditure from 2014 to 2018. Download it immediately and use it for your business.
-
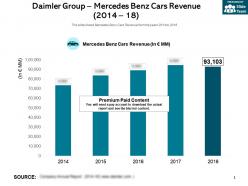 Daimler group mercedes benz cars revenue 2014-18
This is a professionally designed visual chart for Daimler Group Mercedes Benz Cars Revenue 2014 to 18. This is part of our Data and Statistics products selection, and you will need a Paid account to download the actual report with accurate data and sources. Downloaded report will contain the editable graph with accurate data, an excel table with the actual data, the exact source of the data and the release date. This slide shows Mercedes Benz Cars Revenue from the years 2014 to 2018. Download it immediately and use it for your business.
-
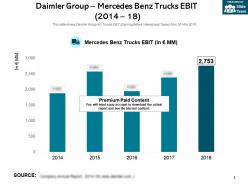 Daimler group mercedes benz trucks ebit 2014-18
This is a professionally designed visual chart for Daimler Group Mercedes Benz Trucks Ebit 2014 to 18. This is part of our Data and Statistics products selection, and you will need a Paid account to download the actual report with accurate data and sources. Downloaded report will contain the editable graph with accurate data, an excel table with the actual data, the exact source of the data and the release date. This slide shows Daimler Group AG Trucks EBIT Earning Before Interest and Taxes from 2014 to 2018. Download it immediately and use it for your business.
-
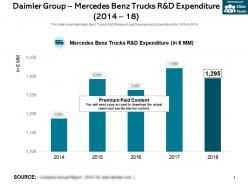 Daimler group mercedes benz trucks r and d expenditure 2014-18
This is a professionally designed visual chart for Daimler Group Mercedes Benz Trucks R And D Expenditure 2014 to 18. This is part of our Data and Statistics products selection, and you will need a Paid account to download the actual report with accurate data and sources. Downloaded report will contain the editable graph with accurate data, an excel table with the actual data, the exact source of the data and the release date. This slide shows Mercedes Benz Trucks R and D Research and Development Expenditure from 2014 to 2018. Download it immediately and use it for your business.
-
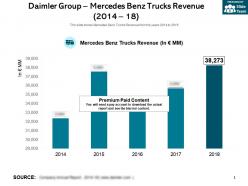 Daimler group mercedes benz trucks revenue 2014-18
This is a professionally designed visual chart for Daimler Group Mercedes Benz Trucks Revenue 2014 to 18. This is part of our Data and Statistics products selection, and you will need a Paid account to download the actual report with accurate data and sources. Downloaded report will contain the editable graph with accurate data, an excel table with the actual data, the exact source of the data and the release date. This slide shows Mercedes Benz Trucks Revenue from the years 2014 to 2018. Download it immediately and use it for your business.
-
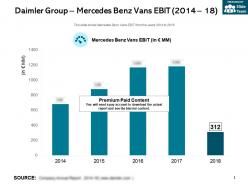 Daimler group mercedes benz vans ebit 2014-18
This is a professionally designed visual chart for Daimler Group Mercedes Benz Vans Ebit 2014 to 18. This is part of our Data and Statistics products selection, and you will need a Paid account to download the actual report with accurate data and sources. Downloaded report will contain the editable graph with accurate data, an excel table with the actual data, the exact source of the data and the release date. This slide shows Mercedes Benz Vans EBIT from the years 2014 to 2018. Download it immediately and use it for your business.
-
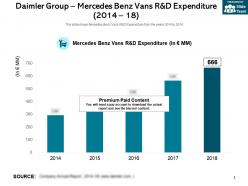 Daimler group mercedes benz vans r and d expenditure 2014-18
This is a professionally designed visual chart for Daimler Group Mercedes Benz Vans R And D Expenditure 2014 to 18. This is part of our Data and Statistics products selection, and you will need a Paid account to download the actual report with accurate data and sources. Downloaded report will contain the editable graph with accurate data, an excel table with the actual data, the exact source of the data and the release date. This slide shows Mercedes Benz Vans R and D Expenditure from the years 2014 to 2018. Download it immediately and use it for your business.
-
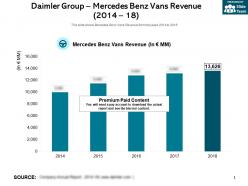 Daimler group mercedes benz vans revenue 2014-18
This is a professionally designed visual chart for Daimler Group Mercedes Benz Vans Revenue 2014 to 18. This is part of our Data and Statistics products selection, and you will need a Paid account to download the actual report with accurate data and sources. Downloaded report will contain the editable graph with accurate data, an excel table with the actual data, the exact source of the data and the release date. This slide shows Mercedes Benz Vans Revenue from the years 2014 to 2018. Download it immediately and use it for your business.
-
 Daimler group net income and margin 2014-18
This is a professionally designed visual chart for Daimler Group Net Income And Margin 2014 to 18. This is part of our Data and Statistics products selection, and you will need a Paid account to download the actual report with accurate data and sources. Downloaded report will contain the editable graph with accurate data, an excel table with the actual data, the exact source of the data and the release date. This slide shows Daimler group Net Income and Margin from the years 2014 to 2018 In Millions JPY. Download it immediately and use it for your business.
-
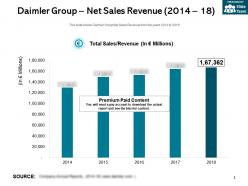 Daimler group net sales revenue 2014-18
This is a professionally designed visual chart for Daimler Group Net Sales Revenue 2014 to 18. This is part of our Data and Statistics products selection, and you will need a Paid account to download the actual report with accurate data and sources. Downloaded report will contain the editable graph with accurate data, an excel table with the actual data, the exact source of the data and the release date. This slide shows Daimler GroupNet Sales Revenue from the years 2014 to 2018. Download it immediately and use it for your business.
-
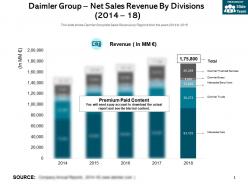 Daimler group net sales revenue by divisions 2014-18
This is a professionally designed visual chart for Daimler Group Net Sales Revenue By Divisions 2014 to 18. This is part of our Data and Statistics products selection, and you will need a Paid account to download the actual report with accurate data and sources. Downloaded report will contain the editable graph with accurate data, an excel table with the actual data, the exact source of the data and the release date. This slide shows Daimler GroupNet Sales Revenue by Regions from the years 2014 to 2018. Download it immediately and use it for your business.
-
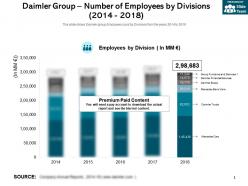 Daimler group number of employees by divisions 2014-2018
This is a professionally designed visual chart for Daimler Group Number Of Employees By Divisions 2014 to 2018. This is part of our Data and Statistics products selection, and you will need a Paid account to download the actual report with accurate data and sources. Downloaded report will contain the editable graph with accurate data, an excel table with the actual data, the exact source of the data and the release date. This slide shows Daimler group Employee count by Divisions from the years 2014 to 2018. Download it immediately and use it for your business.
-
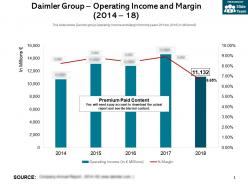 Daimler group operating income and margin 2014-18
This is a professionally designed visual chart for Daimler Group Operating Income And Margin 2014 to 18. This is part of our Data and Statistics products selection, and you will need a Paid account to download the actual report with accurate data and sources. Downloaded report will contain the editable graph with accurate data, an excel table with the actual data, the exact source of the data and the release date. This slide shows Daimler group Operating Income and Margin from the years 2014 to 2018 In Millions JPY. Download it immediately and use it for your business.
-
 Daimler group r and d expenditure 2014-18
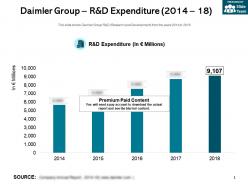
This is a professionally designed visual chart for Daimler Group R And D Expenditure 2014 to 18. This is part of our Data and Statistics products selection, and you will need a Paid account to download the actual report with accurate data and sources. Downloaded report will contain the editable graph with accurate data, an excel table with the actual data, the exact source of the data and the release date. This slide shows Daimler Group R and D Research and Development from the years 2014 to 2018. Download it immediately and use it for your business.
-
 Daimler group revenue split australia oceania 2014-18
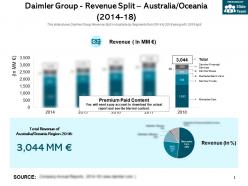
This is a professionally designed visual chart for Daimler Group Revenue Split Australia Oceania 2014 to 18. This is part of our Data and Statistics products selection, and you will need a Paid account to download the actual report with accurate data and sources. Downloaded report will contain the editable graph with accurate data, an excel table with the actual data, the exact source of the data and the release date. This slide shows Daimler Group Revenue Split in Australia by Segments from 2014 to 2018 along with 2018 split. Download it immediately and use it for your business.
-
 Daimler group segment revenue split africa 2014-18
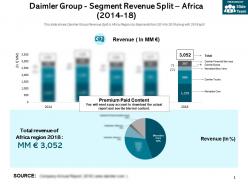
This is a professionally designed visual chart for Daimler Group Segment Revenue Split Africa 2014 to 18. This is part of our Data and Statistics products selection, and you will need a Paid account to download the actual report with accurate data and sources. Downloaded report will contain the editable graph with accurate data, an excel table with the actual data, the exact source of the data and the release date. This slide shows Daimler Group Revenue Split in Africa Region by Segments from 2014 to 2018 along with 2018 split. Download it immediately and use it for your business.
-
 Daimler group segment revenue split latin america 2014-18
This is a professionally designed visual chart for Daimler Group Segment Revenue Split Latin America 2014 to 18. This is part of our Data and Statistics products selection, and you will need a Paid account to download the actual report with accurate data and sources. Downloaded report will contain the editable graph with accurate data, an excel table with the actual data, the exact source of the data and the release date. This slide shows Daimler Group Revenue in Latin America Region by Segments from 2014 to 2018 along with 2018 split. Download it immediately and use it for your business.
-
 Daimler group selling expenses 2014-18
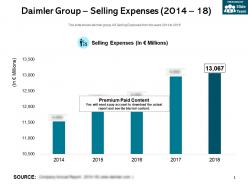
This is a professionally designed visual chart for Daimler Group Selling Expenses 2014 to 18. This is part of our Data and Statistics products selection, and you will need a Paid account to download the actual report with accurate data and sources. Downloaded report will contain the editable graph with accurate data, an excel table with the actual data, the exact source of the data and the release date. This slide shows daimler group AG Selling Expenses from the years 2014 to 2018. Download it immediately and use it for your business.
-
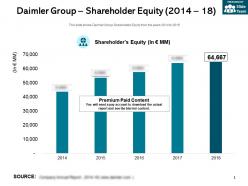 Daimler group shareholder equity 2014-18
This is a professionally designed visual chart for Daimler Group Shareholder Equity 2014 to 18. This is part of our Data and Statistics products selection, and you will need a Paid account to download the actual report with accurate data and sources. Downloaded report will contain the editable graph with accurate data, an excel table with the actual data, the exact source of the data and the release date. This slide shows Daimler Group Shareholder Equity from the years 2014 to 2018. Download it immediately and use it for your business.
-
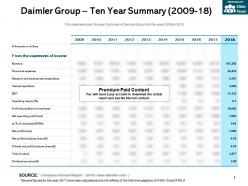 Daimler group ten year summary 2009-18
This is a professionally designed visual chart for Daimler Group Ten Year Summary 2009 to 18. This is part of our Data and Statistics products selection, and you will need a Paid account to download the actual report with accurate data and sources. Downloaded report will contain the editable graph with accurate data, an excel table with the actual data, the exact source of the data and the release date. This slide describes Ten year Summary of Daimler Group from the years 2009 to 2018. Download it immediately and use it for your business.
-
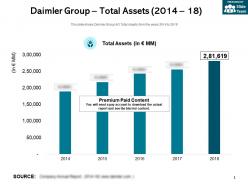 Daimler group total assets 2014-18
This is a professionally designed visual chart for Daimler Group Total Assets 2014 to 18. This is part of our Data and Statistics products selection, and you will need a Paid account to download the actual report with accurate data and sources. Downloaded report will contain the editable graph with accurate data, an excel table with the actual data, the exact source of the data and the release date. This slide shows Daimler Group AG Total Assets from the years 2014 to 2018. Download it immediately and use it for your business.
-
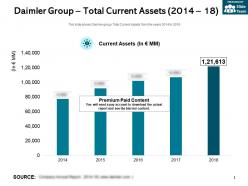 Daimler group total current assets 2014-18
This is a professionally designed visual chart for Daimler Group Total Current Assets 2014 to 18. This is part of our Data and Statistics products selection, and you will need a Paid account to download the actual report with accurate data and sources. Downloaded report will contain the editable graph with accurate data, an excel table with the actual data, the exact source of the data and the release date. This slide shows Daimler group Total Current Assets from the years 2014 to 2018. Download it immediately and use it for your business.
-
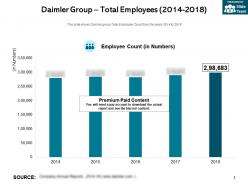 Daimler group total employees 2014-2018
This is a professionally designed visual chart for Daimler Group Total Employees 2014 to 2018. This is part of our Data and Statistics products selection, and you will need a Paid account to download the actual report with accurate data and sources. Downloaded report will contain the editable graph with accurate data, an excel table with the actual data, the exact source of the data and the release date. This slide shows Daimler group Total Employee Count from the years 2014 to 2018. Download it immediately and use it for your business.
-
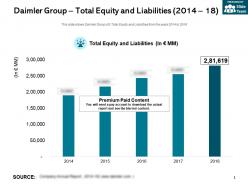 Daimler group total equity and liabilities 2014-18
This is a professionally designed visual chart for Daimler Group Total Equity And Liabilities 2014 to 18. This is part of our Data and Statistics products selection, and you will need a Paid account to download the actual report with accurate data and sources. Downloaded report will contain the editable graph with accurate data, an excel table with the actual data, the exact source of the data and the release date. This slide shows Daimler Group AG Total Equity and Liabilities from the years 2014 to 2018. Download it immediately and use it for your business.
-
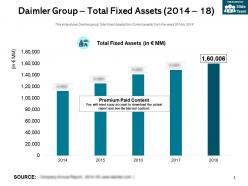 Daimler group total fixed assets 2014-18
This is a professionally designed visual chart for Daimler Group Total Fixed Assets 2014 to 18. This is part of our Data and Statistics products selection, and you will need a Paid account to download the actual report with accurate data and sources. Downloaded report will contain the editable graph with accurate data, an excel table with the actual data, the exact source of the data and the release date. This slide shows Daimler group Total Fixed Assets Non Current assets from the years 2014 to 2018. Download it immediately and use it for your business.
-
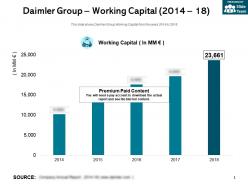 Daimler group working capital 2014-18
This is a professionally designed visual chart for Daimler Group Working Capital 2014 to 18. This is part of our Data and Statistics products selection, and you will need a Paid account to download the actual report with accurate data and sources. Downloaded report will contain the editable graph with accurate data, an excel table with the actual data, the exact source of the data and the release date. This slide shows Daimler Group Working Capital from the years 2014 to 2018. Download it immediately and use it for your business.


