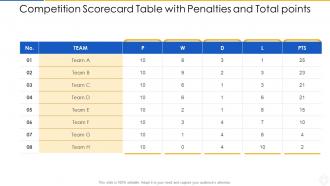
Competition scorecard table with penalties and total points

Rating:
80%
Competition scorecard table with penalties and total points
Slide 1 of 2
Favourites Favourites

Try Before you Buy Download Free Sample Product

Audience Impress Your
Audience
Editable 100%
Editable
Time Save Hours
of Time
The Biggest Sale is ending soon in
0
0
:
0
0
:
0
0
AI-Ready
Upload this template to AI and ask it to make any changes to content or color
100% editable Powerpoint Template for AI-assisted presentations. Finish your work in less time. Download Prompt Kit ​
Works with
Microsoft PowerPoint
Microsoft 365
Claude for PowerPoint
ChatGPT
Google Slides
Microsoft Copilot
Rating:
80%
Presenting our well structured Competition Scorecard Table With Penalties And Total Points. The topics discussed in this slide are Competition Scorecard Table With Penalties And Total Points. This is an instantly available PowerPoint presentation that can be edited conveniently. Download it right away and captivate your audience.

FAQs for Competition scorecard table with penalties

Key competition scorecard metrics include market share, pricing strategies, product features, customer satisfaction scores, financial performance, and digital presence analytics. These comprehensive indicators enable organizations to benchmark performance across retail, technology, and financial services sectors, ultimately delivering strategic insights that streamline competitive positioning and enhance market advantage through data-driven decision making.

A competition scorecard informs strategic decision-making by identifying competitor strengths, weaknesses, market positioning, pricing strategies, and performance gaps across key business metrics. Through comprehensive competitive analysis, organizations can prioritize resource allocation, adjust market positioning, and develop targeted strategies that capitalize on competitor vulnerabilities, ultimately delivering enhanced competitive advantage and strategic market differentiation.

Effective competition scorecard tools include Microsoft Excel, Google Sheets, Tableau, Airtable, and specialized platforms like Klipfolio or Competitive Intelligence software. These platforms streamline competitive analysis by enabling automated data collection, visual comparisons, and real-time tracking, with many organizations finding that integrated dashboards ultimately deliver faster strategic insights and enhanced competitive positioning.

A business should update its competition scorecard quarterly for comprehensive reviews, with monthly updates for key metrics and immediate updates when major competitive moves occur. This regular cadence enables organizations to track market shifts, pricing changes, and product launches effectively, while quarterly deep-dives assess strategic positioning, ultimately maintaining competitive advantage in increasingly dynamic markets.

Common pitfalls include relying on outdated data, focusing solely on direct competitors while ignoring emerging threats, oversimplifying complex competitive dynamics, and failing to weight criteria appropriately for strategic priorities. Many organizations find that successful competitive analysis requires regular data updates, comprehensive market scanning, and balanced scorecards that consider both quantitative metrics and qualitative factors, ultimately delivering more accurate strategic insights.

Businesses can customize competition scorecards by identifying industry-specific metrics, key performance indicators, competitive factors, and market dynamics unique to their sector. Financial services might track regulatory compliance and customer acquisition costs, while retail focuses on inventory turnover and customer experience metrics, ultimately delivering targeted competitive intelligence that drives strategic decision-making.

Qualitative data provides essential context and depth to quantitative competition scorecards by explaining the "why" behind numerical trends, customer sentiment drivers, and strategic positioning factors that numbers alone cannot capture. This combination enables organizations to understand competitor strengths, market perception gaps, and emerging opportunities, ultimately delivering more comprehensive competitive intelligence and strategic decision-making capabilities.

A competition scorecard provides focused competitor comparison across specific metrics like pricing, features, and market positioning, while a market analysis report examines broader industry trends, size, and growth opportunities. Scorecards enable quick strategic decisions through standardized competitor benchmarking, whereas market reports deliver comprehensive landscape insights, with many organizations finding that combining both approaches enhances competitive advantage and strategic planning.

Tracking competitor pricing strategies reveals market positioning trends, price elasticity patterns, promotional timing cycles, customer segment targeting approaches, and competitive response speeds. These insights enable organizations to optimize their own pricing models, identify market gaps, anticipate competitor moves, and develop strategic pricing advantages, with many businesses finding significant revenue improvements through data-driven competitive pricing intelligence.

A competition scorecard aids in identifying market gaps by systematically analyzing competitor strengths, weaknesses, pricing strategies, customer satisfaction levels, and service offerings across key performance indicators. Through comprehensive competitor mapping, businesses can pinpoint underserved customer segments, pricing inefficiencies, and service limitations, ultimately revealing strategic opportunities for differentiation and market positioning.

Data visualization techniques for competition scorecards include comparative bar charts, radar charts, heat maps, dashboard-style metrics displays, and side-by-side performance matrices. These visual approaches streamline complex competitive analysis by highlighting key differentiators, market positioning, and performance gaps across multiple criteria, ultimately enabling executives to quickly identify strategic opportunities and competitive advantages during high-stakes presentations.

SMEs can leverage competition scorecards by focusing on free tools like social media monitoring, website analysis, and customer feedback collection, while prioritizing 3-5 key competitors rather than exhaustive market coverage. Through strategic resource allocation and quarterly reviews instead of continuous monitoring, small businesses streamline competitive intelligence gathering, ultimately enabling data-driven decisions that enhance market positioning without overwhelming operational capacity.

Best practices for presenting competition scorecard findings include creating clear visual comparisons, focusing on actionable insights, prioritizing strategic opportunities, and tailoring presentations to specific stakeholder needs. These approaches enable organizations to transform competitive analysis into strategic advantage by highlighting market gaps, benchmark performance metrics, and growth opportunities, with many companies finding that structured presentations drive faster decision-making and resource allocation.

A competition scorecard tracks strategic changes by monitoring key competitor metrics across multiple periods, including market positioning, product launches, pricing adjustments, marketing campaigns, and resource allocation patterns. By establishing baseline measurements and conducting regular quarterly assessments, organizations can identify emerging competitive threats, strategic pivots, and market opportunities, ultimately enabling proactive strategic responses and maintaining competitive advantage in dynamic business environments.

Customer sentiment serves as a critical performance indicator, reflecting brand perception, loyalty levels, satisfaction ratings, and market positioning relative to competitors. Through social media monitoring, review analysis, and survey data, organizations can gauge competitive advantages in customer experience, service quality, and brand trust, ultimately revealing market share vulnerabilities and growth opportunities.

Ratings and Reviews

80% of 100
Review Form
Write a review
Most Relevant Reviews
  1. 80%

    by Danilo Woods

    Innovative and attractive designs.
  2. 80%

    by Chauncey Ramos

    Wonderful templates design to use in business meetings.
  3. 80%

    by Duncan Berry

    Qualitative and comprehensive slides.
  4. 80%

    by Liam Perez

    Innovative and Colorful designs.
  5. 80%

    by Brown Murphy

    Awesome use of colors and designs in product templates.

5 Item(s)

per page: