Coronavirus impact assessment and mitigation strategies in airlines industry complete deck
Our Coronavirus Impact Assessment And Mitigation Strategies In Airlines Industry Complete Deck are topically designed to provide an attractive backdrop to any subject. Use them to look like a presentation pro.
- Google Slides is a new FREE Presentation software from Google.
- All our content is 100% compatible with Google Slides.
- Just download our designs, and upload them to Google Slides and they will work automatically.
- Amaze your audience with SlideTeam and Google Slides.
-
Want Changes to This PPT Slide? Check out our Presentation Design Services
- WideScreen Aspect ratio is becoming a very popular format. When you download this product, the downloaded ZIP will contain this product in both standard and widescreen format.
-

- Some older products that we have may only be in standard format, but they can easily be converted to widescreen.
- To do this, please open the SlideTeam product in Powerpoint, and go to
- Design ( On the top bar) -> Page Setup -> and select "On-screen Show (16:9)” in the drop down for "Slides Sized for".
- The slide or theme will change to widescreen, and all graphics will adjust automatically. You can similarly convert our content to any other desired screen aspect ratio.
Compatible With Google Slides

Get This In WideScreen
You must be logged in to download this presentation.
PowerPoint presentation slides
It covers all the important concepts and has relevant templates which cater to your business needs. This complete deck has PPT slides on Coronavirus Impact Assessment And Mitigation Strategies In Airlines Industry Complete Deck with well suited graphics and subject driven content. This deck consists of total of seventy two slides. All templates are completely editable for your convenience. You can change the colour, text and font size of these slides. You can add or delete the content as per your requirement. Get access to this professionally designed complete deck presentation by clicking the download button below.
People who downloaded this PowerPoint presentation also viewed the following :
Content of this Powerpoint Presentation
Slide 1: This slide introduces Coronavirus Impact Assessment & Mitigation Strategies in Airlines Industry.
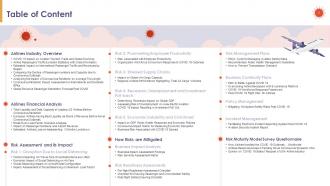
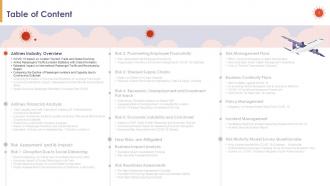
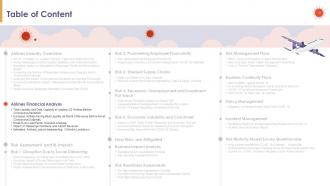
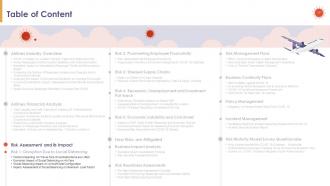
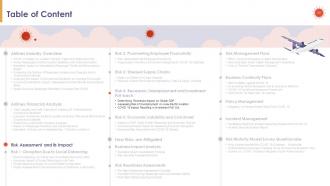
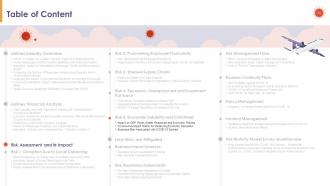
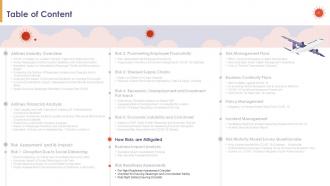
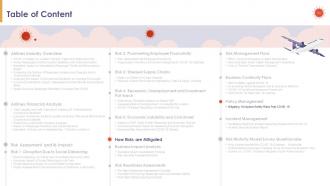
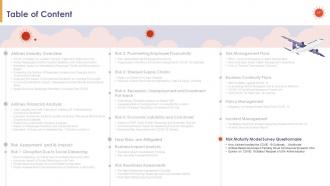
Slide 2: This slide displays the Table of Content, i.e., Airlines Industry Overview, Airlines Financial Analysis, Risk Assessment, and its Impact, How Risks are Mitigated, Risk Maturity Model Survey Questionnaire.
Slide 3: This slide provides further continuation to the Table of Content.
Slide 4: This slide highlights the COVID 19 Impact on Aviation Tourism Trade and Global Economy like Airline Passenger Traffic, Airlines, Trade, Global Economy, and Tourism.
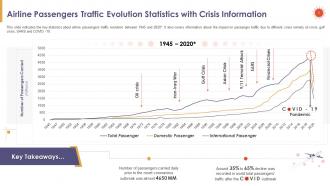
Slide 5: This slide shows the Airline Passengers Traffic Evolution Statistics with Crisis Information.
Slide 6: The Following slide portrays the region-wise estimated impact of coronavirus outbreak on international and domestic passenger traffic and revenues. Details covered in the slide are of capacity, passenger and revenue for North America, Latin America & the Caribbean, Europe, Africa, Asia & Pacific, Middle East.
Slide 7: This slide provides further continuation to the Estimated Impact on International and Domestic Passenger Traffic and Revenues by Region.
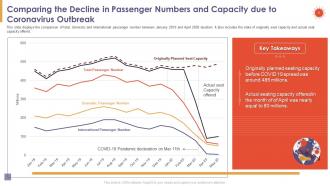
Slide 8: This slide compares total, domestic, and international passenger numbers between January 2019 and April 2020 to assess the decline. It also includes the stats of originally seat capacity and actual seat capacity offered.
Slide 9: This slide displays the Table of Content with emphasis on the Airlines Industry Overview.
Slide 10: The mentioned slide shows the COVID 19 outbreak impact on average trip length. The average trip length recorded was around 1880 km in 2020 compared to 2065 Km in 2019.
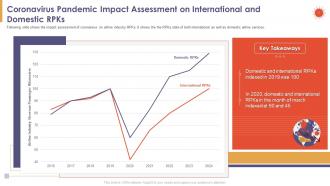
Slide 11: The following slide shows the impact assessment of coronavirus pandemic on airline industry RPKs. It shows the RPKs stats of both international as well as domestic airline services.
Slide 12: This slide illustrates the forecasting of global airline's revenue passenger kilometers post coronavirus. It also shows the stats of the Pre-COVID forecast, current baseline, and COVID setback scenario.
Slide 13: This slide displays the Table of Content with emphasis on the Airlines's Financial Analysis.
Slide 14: The purpose of this slide is to display information about the total liquidity and debt capacity of leading USA airlines pre-COVID outbreak.
Slide 15: European Airlines having Best Liquidity as Share of Revenue Before Novel Coronavirus Outbreak 15 The following slide portrays details about European airlines with the highest liquidity as a share of revenue before the pandemic outbreak. Wiz air has the highest liquidity, with Ryanair just behind it.
Slide 16: This slide elaborates on the break-even load factor and different scenarios like total capacity reduction, fuel costs, and weight load factor.
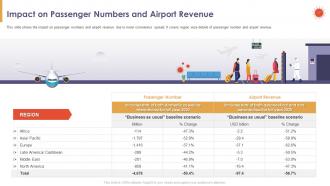
Slide 17: This slide talks about the impact on passenger numbers and airport revenue due to novel coronavirus spread. It covers region-wise details of passenger number and airport revenue.
Slide 18: This slide portrays estimated airlines' loss on three months lockdown implementation. It also includes the details about the region, Revenue passenger kilometers, and gross passenger revenue for complete 2020.
Slide 19: This slide showcases the Table of Content with a focus on Risk assessment and its impact.
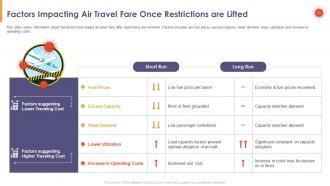
Slide 20: This slide covers information about the factors that impact air travel fare after restrictions are removed. Factors included are fuel prices, excess capacity, weak demand, lower utilization, and increased operating costs.
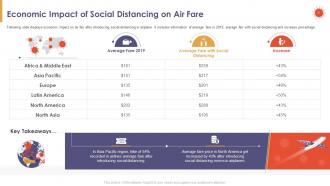
Slide 21: This slide shares the economic impact on airfare after introducing social distancing in airplanes. It includes information on the average fare in 2019, average fare with social distancing, and increase percentage.
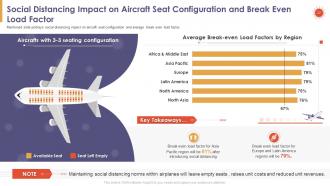
Slide 22: The Mentioned slide studies the social distancing impact on aircraft seat configuration and average break-even load factor.
Slide 23: The slide further mentions the social distancing impact on maximum load factor and per person traveling cost. It includes details about airplane models and shapes along with per-person cost with 80% load.
Slide 24: This slide showcases the Table of Content with a focus on Risk assessment and its impact.
Slide 25: In this slide, we cover the various risk that impacts on employee productivity. Risks covered in the slide are workforce, working capital, demand, and legal obligation. Workforce.
Slide 26: This slide illustrates different organizations' workforce concerns in response to the coronavirus outbreak. Here the organizations are categorized into resilient, reinvent and endure groups.
Slide 27: This slide showcases the Table of Content with a focus on Risk assessment and its impact.
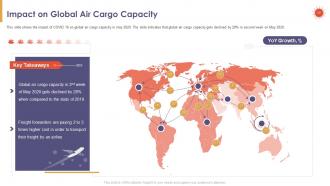
Slide 28: This slide shows the impact of COVID 19 on global air cargo capacity in May 2020. The slide indicates that global air cargo capacity declines by 28% in the second week of May 2020.
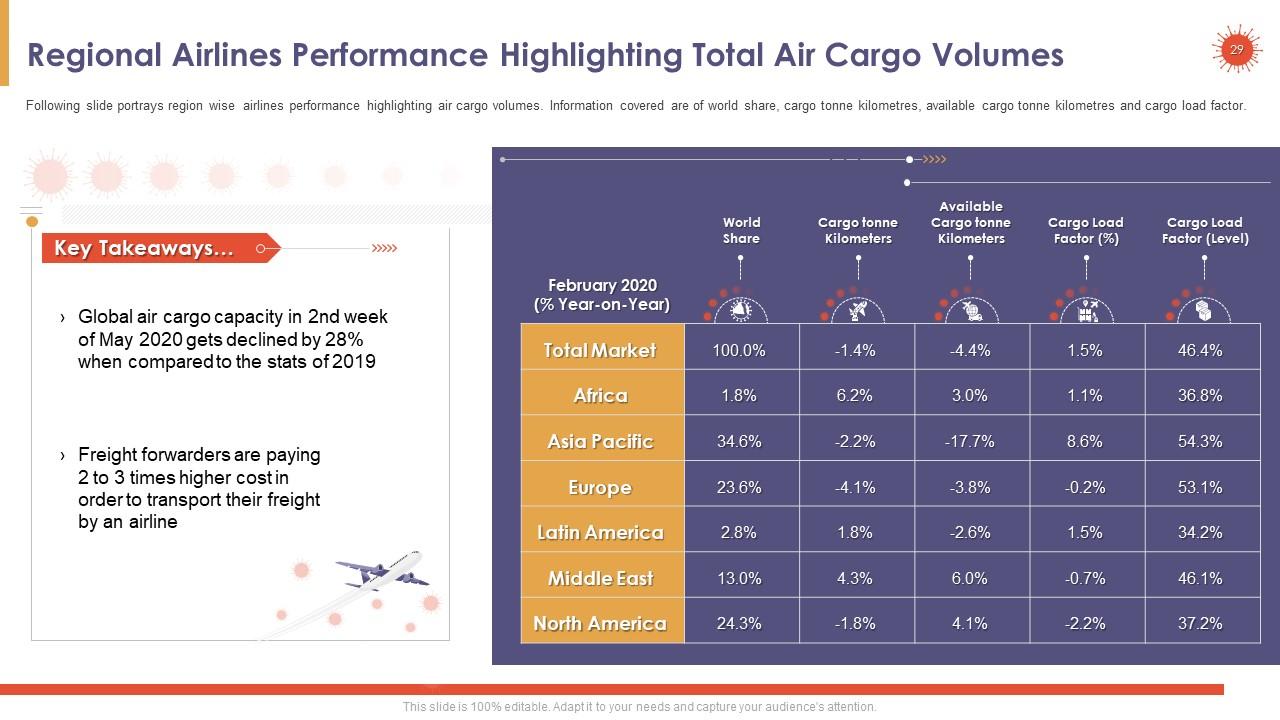
Slide 29: The purpose of this slide mentions the region-wise airlines' performance highlighting air cargo volumes. Information covered are of world share, cargo tonne-kilometers, available cargo tonne-kilometers, and cargo load factor.
Slide 30: This slide showcases the Table of Content with a focus on Risk assessment and its impact.
Slide 31: This slide determines recession impact on global GDP growth. Global GDP statistics provided here are of march and April months of 2020.
Slide 32: This slide elucidates the unemployment risk assessment on Asia-Pacific aviation. It covers country-wise information of % change in passenger demand, passenger demand impact, revenue impact, and potential jobs impact.
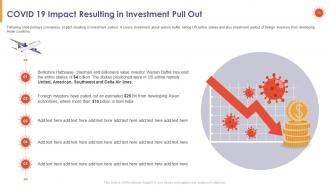
Slide 33: This slide explains the coronavirus impact resulting in investment pullout.
Slide 34: This slide showcases the Table of Content with a focus on Risk assessment and its impact.
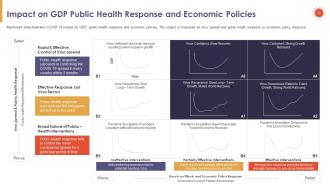
Slide 35: The mentioned slide illustrates COVID 19 impact on GDP, public health response, and economic policies.
Slide 36: This slide depicts the COVID 19 impact on economic disruption. It explains how the retail, airlines, and tourism industry will get the most damage.
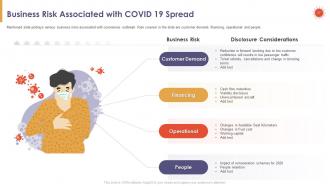
Slide 37: This slide talks about various business risks associated with the coronavirus outbreak. Risks covered in the slide are customer demand, financing, operational, and people.
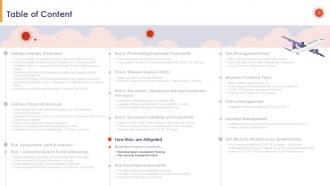
Slide 38: This slide depicts the Table of Content with special emphasis on How Risks are Mitigated.
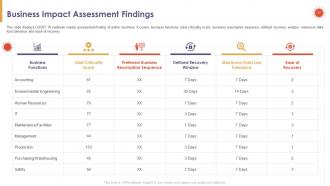
Slide 39: This slide displays the COVID 19 outbreak impact assessment findings of the airline business. It covers business functions, total criticality score, business resumption sequence, defined recovery window, maximum data loss tolerance, and ease of recovery.
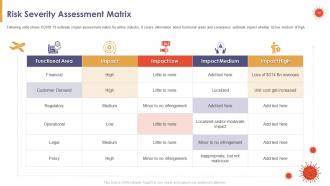
Slide 40: The following slide shows COVID 19 outbreak impact assessment matrix for the airline industry. It covers information about functional areas and coronavirus outbreak impact whether its low, medium or high.
Slide 41: This slide depicts the Table of Content with special emphasis on How Risks are Mitigated.
Slide 42: This slide covers the information about the pre-flight readiness assessment checklist for mitigating COVID19 spread.
Slide 43: This slide covers the checklist for ensuring passenger and crew members' safety against COVID 19 spread.
Slide 44: The purpose of this slide is to share post-flight safety ensuring checklist to mitigate coronavirus spread if found in any passenger.
Slide 45: This slide depicts the Table of Content with special emphasis on How Risks are Mitigated.
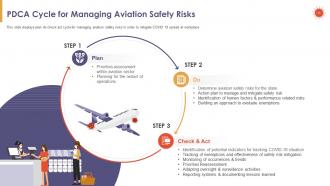
Slide 46: This slide essentially exhibits the PDCA Cycle for Managing Aviation Safety Risks.
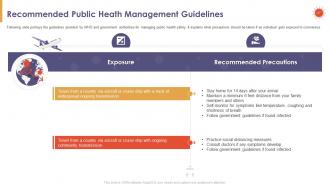
Slide 47: This slide focuses on the guidelines provided by WHO and government authorities for managing public health safety. It explains what precautions should be taken if an individual gets exposed to coronavirus.
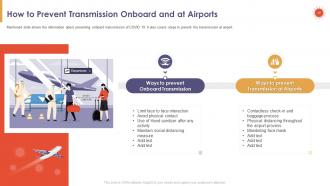
Slide 48: The purpose of this slide is to elaborate on the information about preventing onboard transmission of COVID 19. It also covers steps to prevent transmission at the airport.
Slide 49: This slide depicts the Table of Content with special emphasis on How Risks are Mitigated.
Slide 50: This slide explains the path to tackle COVID 19 outbreak. It includes five horizons, namely resolves, resilience, return, reimagination and reform.
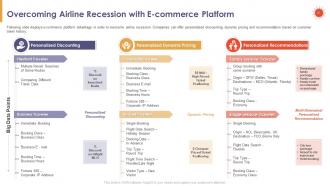
Slide 51: This slide highlights the e-commerce platform advantage to overcome the airline recession. Companies can offer personalized discounting, dynamic pricing, and recommendation based on customer travel history.
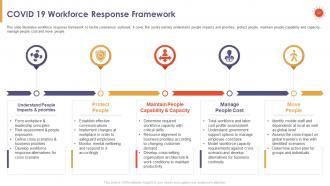
Slide 52: This slide draws the workforce response framework to tackle the coronavirus outbreak. It covers five points, namely, understands people's impacts and priorities, protects people, maintains people's capability and capacity, manages people's costs, and move people.
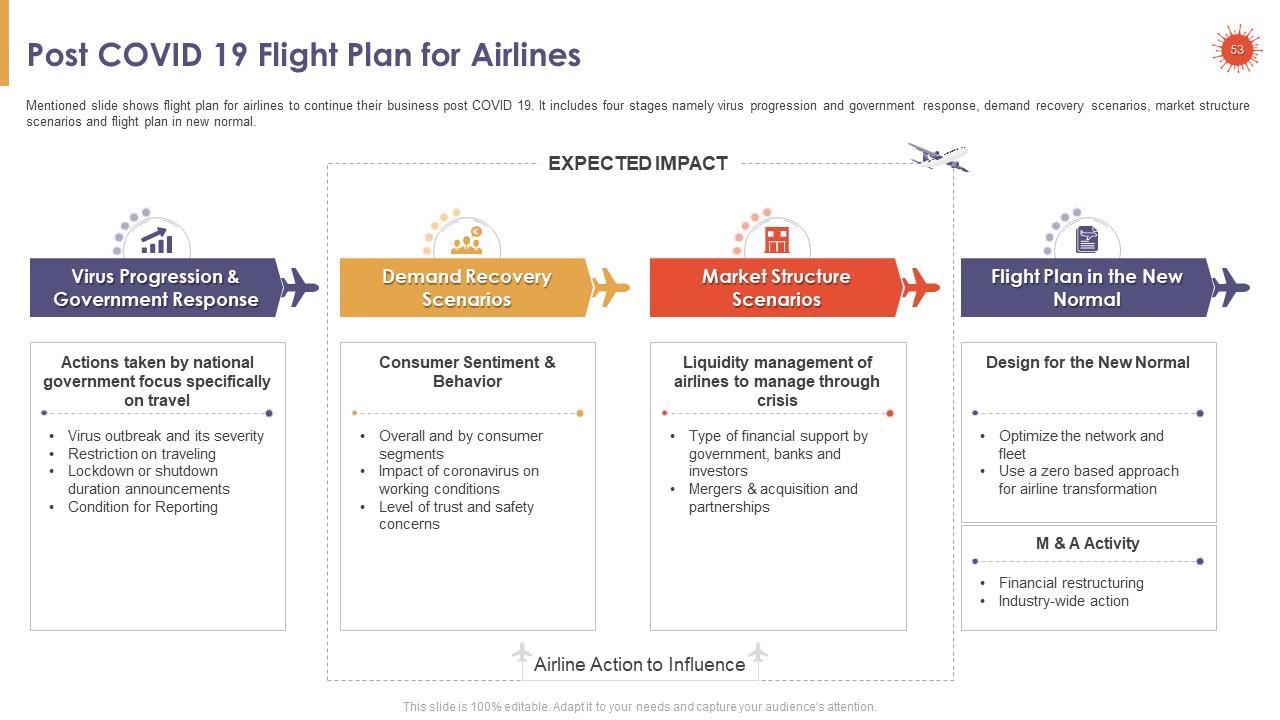
Slide 53: This slide provides a flight plan for airlines to continue their business post-COVID 19. It includes four stages, namely virus progression, and government response, demand recovery scenarios, market structure scenarios, and flight plans in new normal.
Slide 54: This slide depicts the Table of Content with special emphasis on How Risks are Mitigated.
Slide 55: This slide mentions the Mitigating Workplace Safety Risks Post COVID 19. It includes measures for personnel health and safety measures, physical workplace, staffing and attendance, HR policies, travel policies, and external interaction.
Slide 56: This slide depicts the Table of Content with special emphasis on How Risks are Mitigated.
Slide 57: The following slide showcases the framework for Facilitating Electronic Incident Reporting System Post COVID 19.
Slide 58: This slide introduces the aviation security incident report. It includes five sections: incident details, category security incident, incident assessment, aircraft information, and incident description.
Slide 59: This slide depicts the Table of Content with a focus on the Risk Maturity Model Survey Questionnaire.
Slide 60: This slide analyzes the survey result on how airlines handled coronavirus outbreaks at the global level.
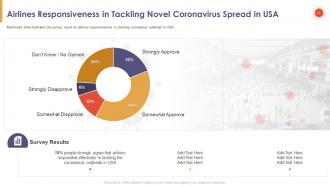
Slide 61: This slide illustrates the survey result on airlines' responsiveness in tackling coronavirus outbreaks in the USA.
Slide 62: This slide displays the survey result of people's opinions on the coronavirus bailout request of the US airline industry.
Slide 63: Icons Slide for Coronavirus Impact Assessment and Mitigation Strategies in Airlines Industry 63
Slide 64: The purpose of this slide is to give an introduction to additional slides.
Slide 65: This slide conveys the company's vision, mission, and goals in an attractive yet informative manner.
Slide 66: This is an About Us slide to showcase the company's details.
Slide 67: This slide introduces the company team with their proper designations.
Slide 68: The following slide displays the Timeline to carry out a project efficiently.
Slide 69: This is a slide demonstrating the Venn chart for focusing on the interrelationship between various elements.
Slide 70: This slide shows the Idea Generation process.
Slide 71: This slide exhibits the Bar Chart for comparison of your products.
Slide 72: This is a Thank You slide with contact, address, and email details.
Coronavirus impact assessment and mitigation strategies in airlines industry complete deck with all 72 slides:
Use our Coronavirus Impact Assessment And Mitigation Strategies In Airlines Industry Complete Deck to effectively help you save your valuable time. They are readymade to fit into any presentation structure.
-
The Designed Graphic are very professional and classic.
-
Unique research projects to present in meeting.
-
Attractive design and informative presentation.
-
Wonderful templates design to use in business meetings.
-
Really like the color and design of the presentation.


