Financial Planning And Analysis Best Practices Powerpoint Presentation Slides
Over the last few years, CFOs are being asked to provide relevant business insights to executive level managers for quick decision making. Thats where our financial planning and analysis presentation comes into play and will assist the businesses in monitoring the organizations overall financial health and provide accurate advice to business leaders. Grab our professionally designed Financial Planning and Analysis Best Practices PowerPoint presentation, which covers sections such as introduction to financial planning and defining the capabilities of the financial planning and analysis team. Afterward, the deck caters to a section through which managers can select the best financial planning and analysis software tool for reporting and forecasting. The PPT also covers a section of the financial analysis course which will assist the employees in analyzing the balance sheet and assessing the financial position. Furthermore, the module includes a section on the development and execution of a contingency plan which can be used to overcome financial risks. Going forward, the company can monitor its financial health using various tools such as financial statements and accounting ratios. At last, it covers a few dashboards which will allow the finance and accounting teams to track the organizations revenue and profitability. Get access now
You must be logged in to download this presentation.
PowerPoint presentation slides
Deliver this complete deck to your team members and other collaborators. Encompassed with stylized slides presenting various concepts, this Financial Planning And Analysis Best Practices Powerpoint Presentation Slides is the best tool you can utilize. Personalize its content and graphics to make it unique and thought-provoking. All the fifty five slides are editable and modifiable, so feel free to adjust them to your business setting. The font, color, and other components also come in an editable format making this PPT design the best choice for your next presentation. So, download now.
People who downloaded this PowerPoint presentation also viewed the following :
Content of this Powerpoint Presentation
Slide 1: This slide introduces Financial Planning and Analysis Best Practices. State your company name and begin.
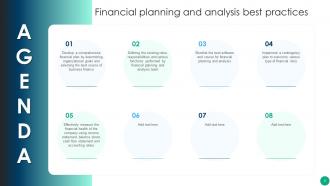
Slide 2: This slide states Agenda of the presentation.
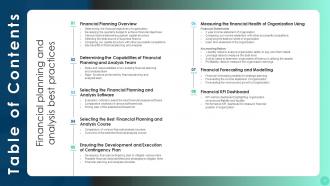
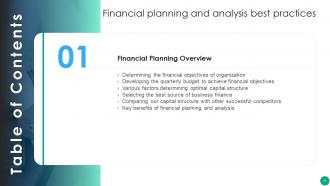
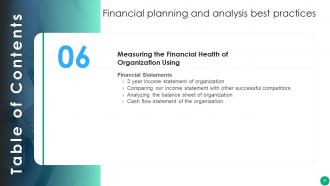
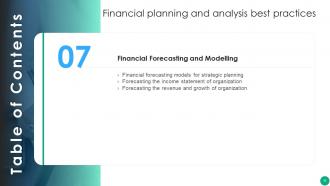
Slide 3: This slide shows Table of Content for the presentation.
Slide 4: This slide highlights title for topics that are to be covered next in the template.
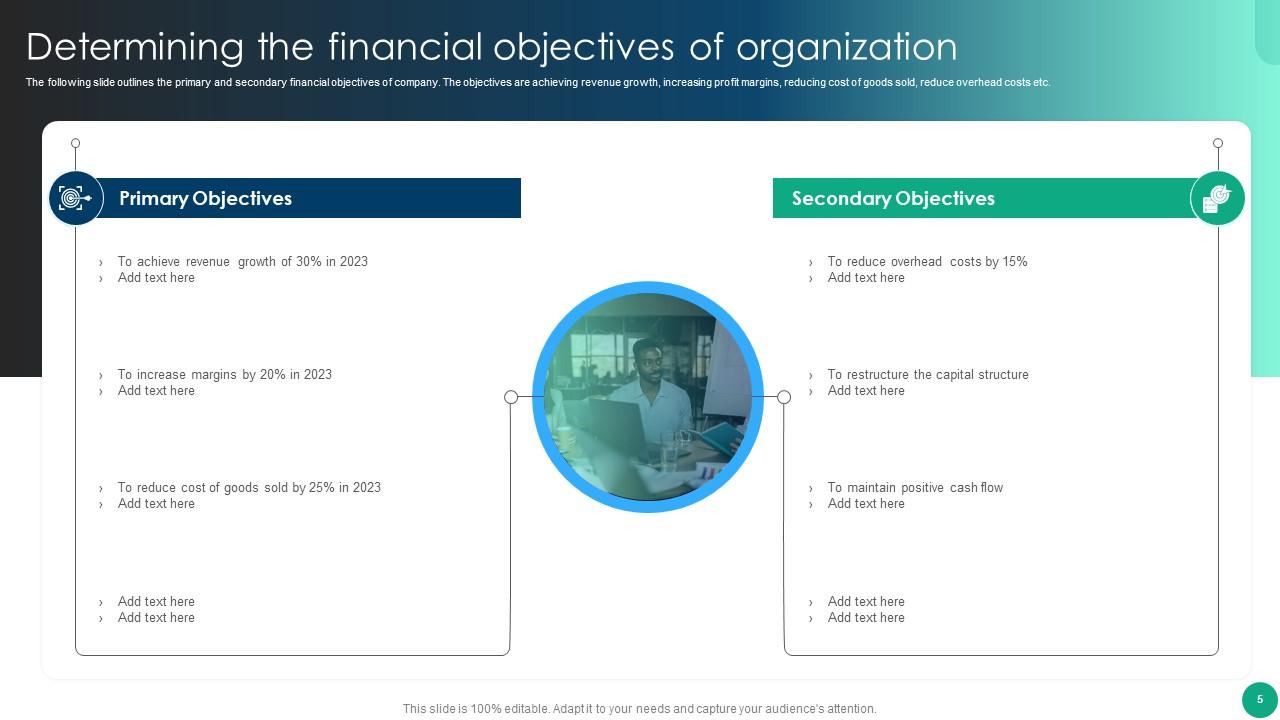
Slide 5: The following slide outlines the primary and secondary financial objectives of company.
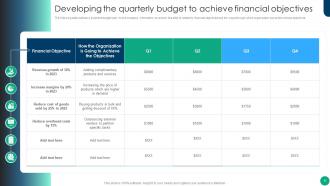
Slide 6: The following slide outlines a projected budget plan for the company.
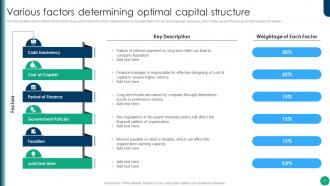
Slide 7: The following slide outlines different factors which can be used to select the optimal capital structure for the organization.
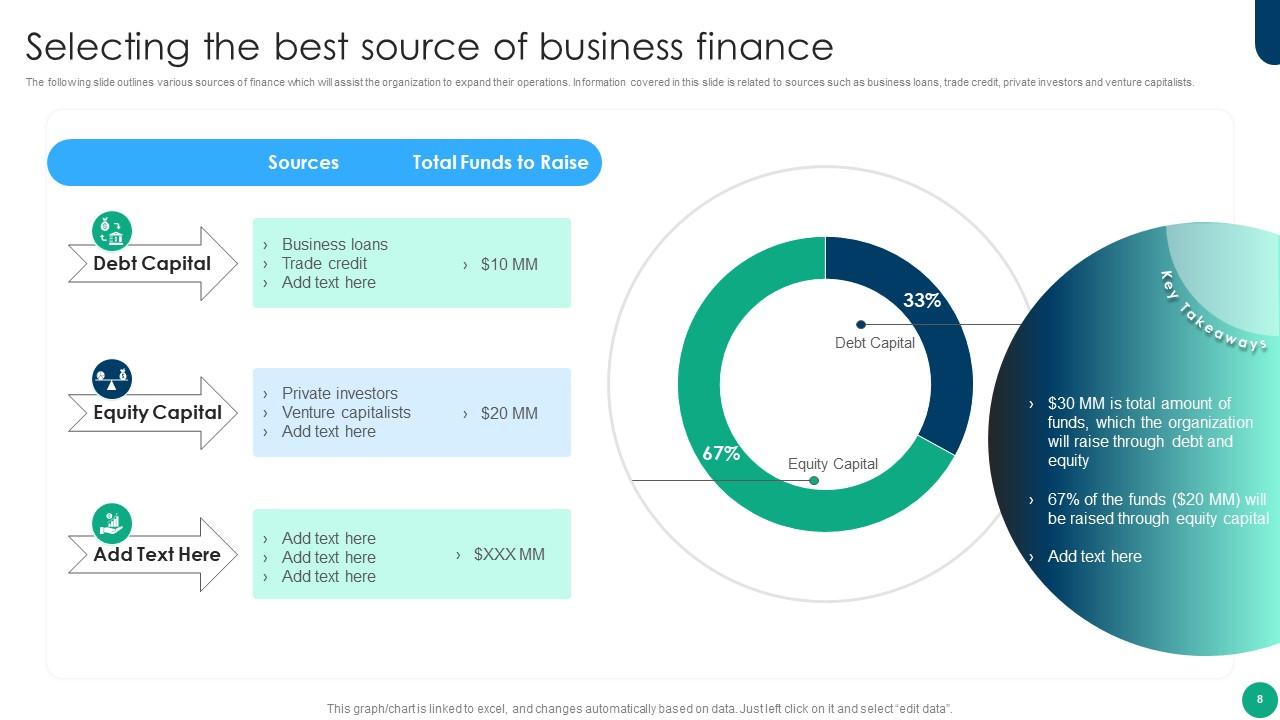
Slide 8: The following slide outlines various sources of finance which will assist the organization to expand their operations.
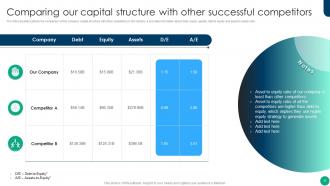
Slide 9: The following slide outlines the comparison of the company capital structure with other competitors in the industry.
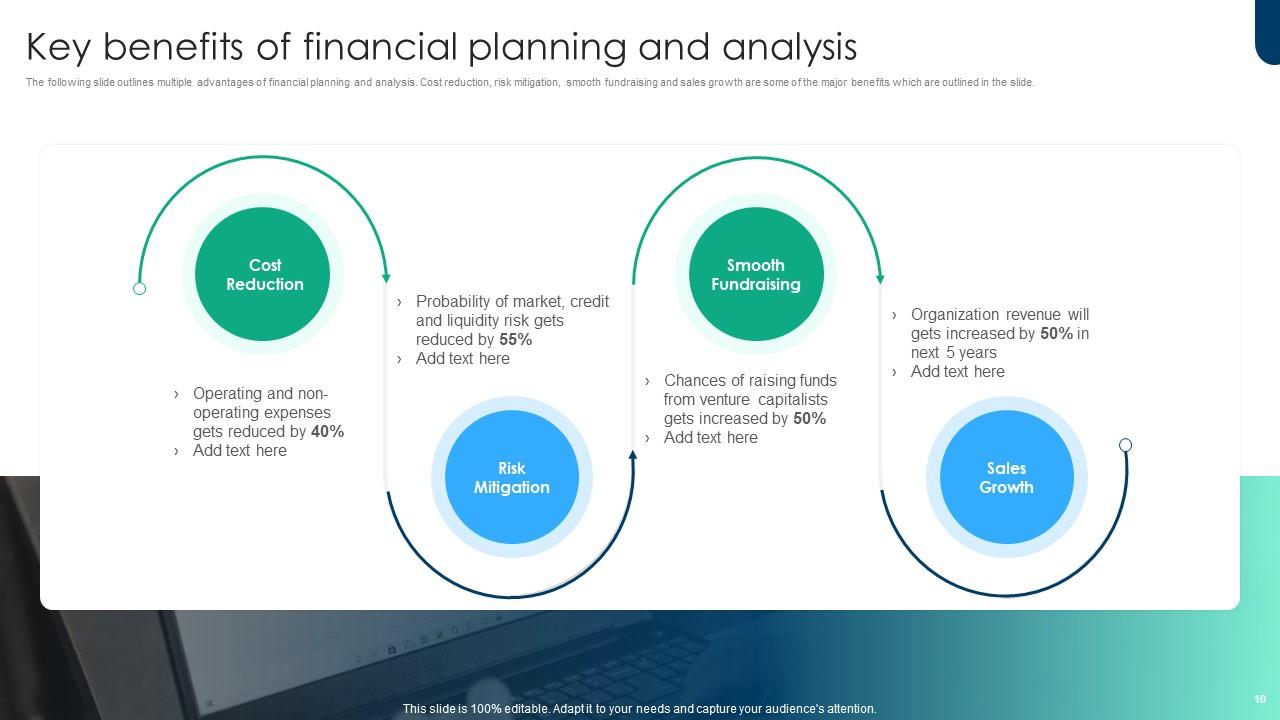
Slide 10: The following slide outlines multiple advantages of financial planning and analysis.
Slide 11: This slide exhibit table of content- Determining the Capabilities of Financial Planning and Analysis Team.
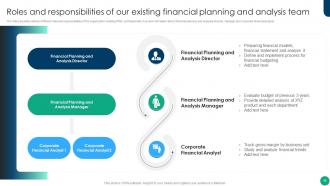
Slide 12: The following slide outlines different roles and responsibilities of the organization existing FP&A professionals.
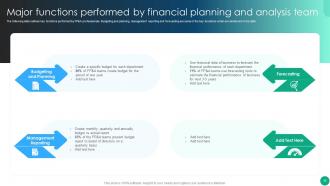
Slide 13: The following slide outlines key functions performed by FP&A professionals.
Slide 14: This slide highlights title for topics that are to be covered next in the template.
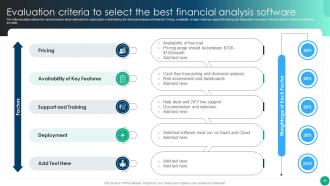
Slide 15: The following slide outlines the various factors which will assist the organization in determining the financial analysis software tool.
Slide 16: The following slide outlines comparative assessment of different financial analysis software tools.
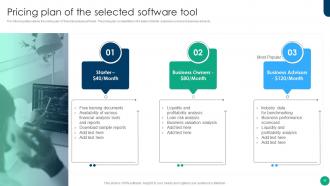
Slide 17: The following slide outlines the pricing plan of financial analysis software.
Slide 18: This slide highlights title for topics that are to be covered next in the template.
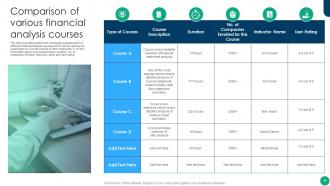
Slide 19: The following slide outlines the comparative assessment of different financial analysis courses.
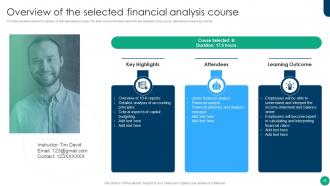
Slide 20: The following slide outlines the glimpse of financial analysis course.
Slide 21: This slide highlights title for topics that are to be covered next in the template.
Slide 22: The following slide outlines a contingency plan which will assist the company to overcome financial crisis.
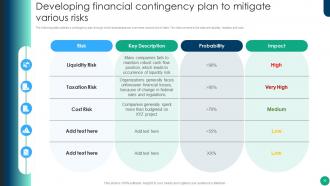
Slide 23: The following slide outlines a contingency plan through which businesses can overcome various kind of risks.
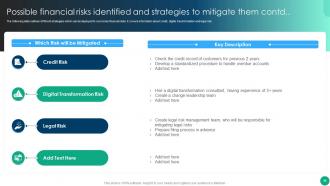
Slide 24: The following slide outlines different strategies which can be deployed to overcome financial risks.
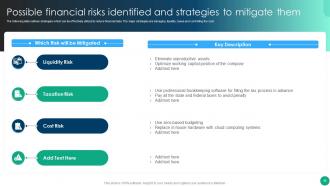
Slide 25: The following slide outlines strategies which can be effectively utilized to reduce financial risks.
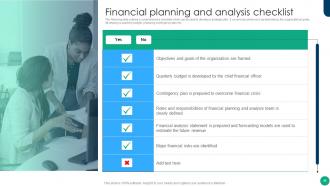
Slide 26: The following slide outlines a comprehensive checklist which can be used to develop a strategic plan.
Slide 27: This slide highlights title for topics that are to be covered next in the template.
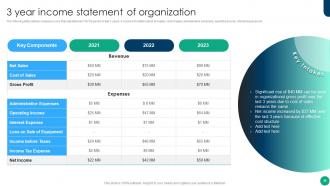
Slide 28: The following slide outlines company’s core financial statement for the period of last 3 years.
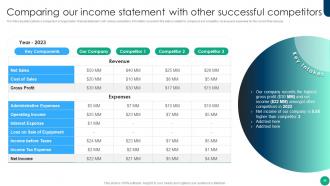
Slide 29: The following slide outlines a comparison of organization financial statement with various competitors.
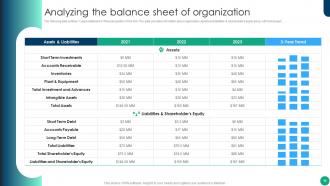
Slide 30: The following slide outlines 3 years statement of financial position of the firm.
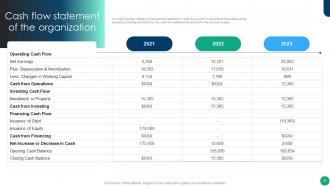
Slide 31: The following slide outlines a comprehensive statement of cash flows.
Slide 32: This slide highlights title for topics that are to be covered next in the template.
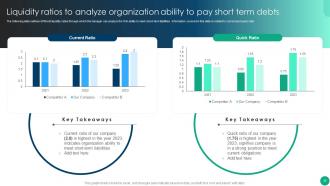
Slide 33: The following slide outlines different liquidity ratios through which the manager can analyze the firm ability to meet short-term liabilities.
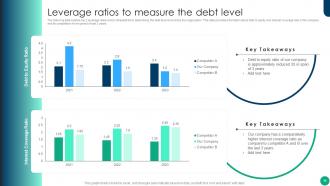
Slide 34: The following slide outlines top 2 leverage ratios which will assist the in determining the debt level incurred by the organization.
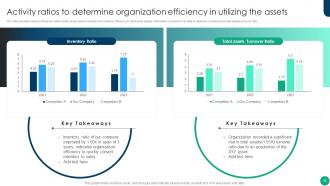
Slide 35: The following slide outlines efficiency ratios which can be used to indicate the company efficiency in utilizing the assets.
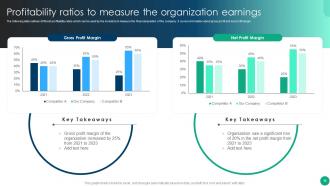
Slide 36: The following slide outlines different profitability ratios which can be used by the investors to measure the financial position of the company.
Slide 37: This slide highlights title for topics that are to be covered next in the template.
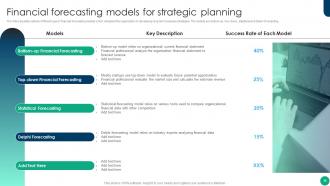
Slide 38: The following slide outlines different type of financial forecasting models.
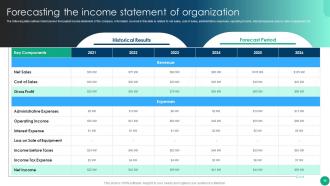
Slide 39: The following slide outlines historical and forecasted income statement of the company.
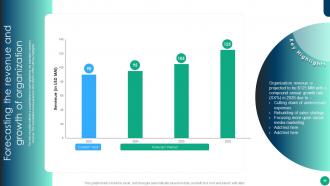
Slide 40: The following slide outlines a comprehensive chart highlighting the estimated company revenue.
Slide 41: This slide highlights title for topics that are to be covered next in the template.
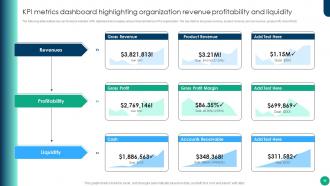
Slide 42: The following slide outlines key performance indicator (KPI) dashboard showcasing various financial metrics of the organization.
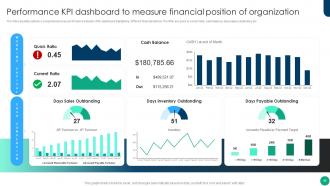
Slide 43: The following slide outlines a comprehensive key performance indicator (KPI) dashboard highlighting different financial metrics.
Slide 44: This slide contains all the icons used in this presentation.
Slide 45: This slide is titled as Additional Slides for moving forward.
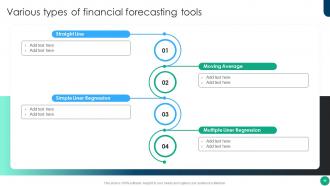
Slide 46: This slide presents Various types of financial forecasting tools.
Slide 47: This is About Us slide to show company specifications etc.
Slide 48: This is Our Mission slide with related imagery and text.
Slide 49: This is Our Team slide with names and designation.
Slide 50: This is Our Goal slide. State your firm's goals here.
Slide 51: This slide shows Post It Notes. Post your important notes here.
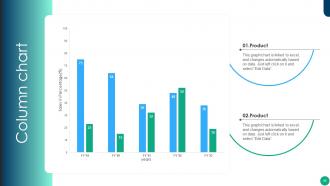
Slide 52: This slide displays Column chart with two products comparison.
Slide 53: This slide depicts Venn diagram with text boxes.
Slide 54: This is a Timeline slide. Show data related to time intervals here.
Slide 55: This is a Thank You slide with address, contact numbers and email address.
Financial Planning And Analysis Best Practices Powerpoint Presentation Slides with all 60 slides:
Use our Financial Planning And Analysis Best Practices Powerpoint Presentation Slides to effectively help you save your valuable time. They are readymade to fit into any presentation structure.
-
A big thanks to SlideTeam! An incredible and diverse library of templates helped me with my business project presentation.
-
Wonderful ideas and visuals. I'm really pleased with the templates, which are unique and up to date.


