Customer Satisfaction Survey Feedback Expected Vs Actual Result
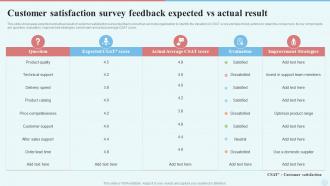
This slide showcases expected and actual result of customer satisfaction survey feedback score that can help organization to identify the deviation in CSAT score and take timely actions to retain the consumers. Its key components are question, evaluation, improvement strategies, benchmark and actual average CSAT score.
You must be logged in to download this presentation.
PowerPoint presentation slides
This slide showcases expected and actual result of customer satisfaction survey feedback score that can help organization to identify the deviation in CSAT score and take timely actions to retain the consumers. Its key components are question, evaluation, improvement strategies, benchmark and actual average CSAT score. Introducing our Customer Satisfaction Survey Feedback Expected Vs Actual Result set of slides. The topics discussed in these slides are Product Quality, Delivery Speed, Customer Support. This is an immediately available PowerPoint presentation that can be conveniently customized. Download it and convince your audience.
People who downloaded this PowerPoint presentation also viewed the following :
Customer Satisfaction Survey Feedback Expected Vs Actual Result with all 6 slides:
Use our Customer Satisfaction Survey Feedback Expected Vs Actual Result to effectively help you save your valuable time. They are readymade to fit into any presentation structure.
-
It is my first time working with them and that too on a friend's recommendation. I would say, I am not expecting such a worldly service at this low price.
-
Easily Editable.


