Data Statistics PowerPoint Templates, PowerPoint Statistics Slides
- Sub Categories
-
- Agriculture
- Chemicals and Resources
- Construction
- Consumer Goods and FMCG
- E-Commerce
- Energy and Environmental Services
- Finance Insurance and Real Estate
- Health and Pharmaceuticals
- Internet
- Life
- Media and Advertising
- Metals and Electronics
- Retail and Trade
- Services
- Society
- Sports and Recreation
- Survey
- Technology and Telecommunications
- Transportation and Logistics
- Travel Tourism and Hospitality
- USA
-
 Cisco systems inc fixed assets 2014-2018
This is a professionally designed visual chart for Cisco Systems Inc Fixed Assets 2014 to 2018. This is part of our Data and Statistics products selection, and you will need a Paid account to download the actual report with accurate data and sources. Downloaded report will contain the editable graph with accurate data, an excel table with the actual data, the exact source of the data and the release date. This slide provides a graph of fixed assets plant, machinery, goodwill, building etc. in JPY MM of Cisco Systems, Inc for the years 2014 to 18. Download it immediately and use it for your business.
-
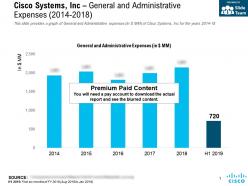 Cisco systems inc general and administrative expenses 2014-2018
This is a professionally designed visual chart for Cisco Systems Inc General And Administrative Expenses 2014 to 2018. This is part of our Data and Statistics products selection, and you will need a Paid account to download the actual report with accurate data and sources. Downloaded report will contain the editable graph with accurate data, an excel table with the actual data, the exact source of the data and the release date. This slide provides a graph of General and Administrative expenses in JPY MM of Cisco Systems, Inc for the years 2014 to 18. Download it immediately and use it for your business.
-
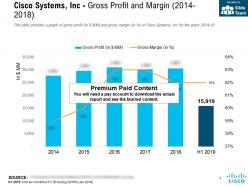 Cisco systems inc gross profit and margin 2014-2018
This is a professionally designed visual chart for Cisco Systems Inc Gross Profit And Margin 2014 to 2018. This is part of our Data and Statistics products selection, and you will need a Paid account to download the actual report with accurate data and sources. Downloaded report will contain the editable graph with accurate data, an excel table with the actual data, the exact source of the data and the release date. This slide provides a graph of gross profit in JPY MM and gross margin in percent of Cisco Systems, Inc for the years 2014 to 18. Download it immediately and use it for your business.
-
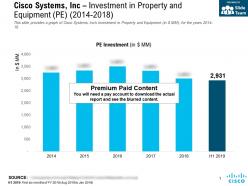 Cisco systems inc investment in property and equipment pe 2014-2018
This is a professionally designed visual chart for Cisco Systems Inc Investment In Property And Equipment Pe 2014 to 2018. This is part of our Data and Statistics products selection, and you will need a Paid account to download the actual report with accurate data and sources. Downloaded report will contain the editable graph with accurate data, an excel table with the actual data, the exact source of the data and the release date. This slide provides a graph of Cisco Systems, Incs investment in Property and Equipment in JPY MM for the years 2014 to 18. Download it immediately and use it for your business.
-
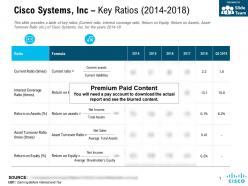 Cisco systems inc key ratios 2014-2018
This is a professionally designed visual chart for Cisco Systems Inc Key Ratios 2014 to 2018. This is part of our Data and Statistics products selection, and you will need a Paid account to download the actual report with accurate data and sources. Downloaded report will contain the editable graph with accurate data, an excel table with the actual data, the exact source of the data and the release date. This slide provides a table of key ratios Current ratio, interest coverage ratio, Return on Equity, Return on Assets, Asset Turnover Ratio etc. of Cisco Systems, Inc for the years 2014 to 18. Download it immediately and use it for your business.
-
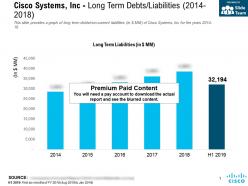 Cisco systems inc long term debts liabilities 2014-2018
This is a professionally designed visual chart for Cisco Systems Inc Long Term Debts Liabilities 2014 to 2018. This is part of our Data and Statistics products selection, and you will need a Paid account to download the actual report with accurate data and sources. Downloaded report will contain the editable graph with accurate data, an excel table with the actual data, the exact source of the data and the release date. This slide provides a graph of long term debts non current liabilities in JPY MM of Cisco Systems, Inc for the years 2014 to 18. Download it immediately and use it for your business.
-
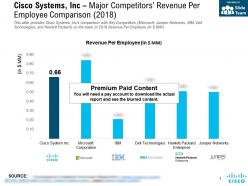 Cisco systems inc major competitors revenue per employee comparison 2018
This is a professionally designed visual chart for Cisco Systems Inc Major Competitors Revenue Per Employee Comparison 2018. This is part of our Data and Statistics products selection, and you will need a Paid account to download the actual report with accurate data and sources. Downloaded report will contain the editable graph with accurate data, an excel table with the actual data, the exact source of the data and the release date. This slide provides Cisco Systems, Incs comparison with Key Competitors Microsoft, Juniper Networks, IBM, Dell Technologies and Hewlett Packard on the basis of 2018 Revenue Per Employee in JPY MM. Download it immediately and use it for your business.
-
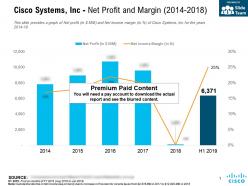 Cisco systems inc net profit and margin 2014-2018
This is a professionally designed visual chart for Cisco Systems Inc Net Profit And Margin 2014 to2018. This is part of our Data and Statistics products selection, and you will need a Paid account to download the actual report with accurate data and sources. Downloaded report will contain the editable graph with accurate data, an excel table with the actual data, the exact source of the data and the release date. This slide provides a graph of Net profit in JPY MM and Net income margin in percent of Cisco Systems, Inc for the years 2014 to 18. Download it immediately and use it for your business.
-
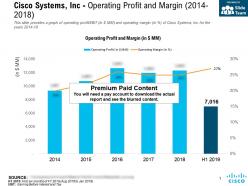 Cisco systems inc operating profit and margin 2014-2018
This is a professionally designed visual chart for Cisco Systems Inc Operating Profit And Margin 2014 to 2018. This is part of our Data and Statistics products selection, and you will need a Paid account to download the actual report with accurate data and sources. Downloaded report will contain the editable graph with accurate data, an excel table with the actual data, the exact source of the data and the release date. This slide provides a graph of operating profit EBIT in JPY MM and operating margin in percent of Cisco Systems, Inc for the years 2014 to 18. Download it immediately and use it for your business.
-
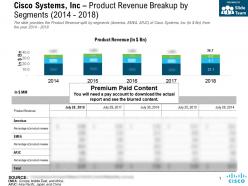 Cisco systems inc product revenue breakup by segments 2014-2018
This is a professionally designed visual chart for Cisco Systems Inc Product Revenue Breakup By Segments 2014 to 2018. This is part of our Data and Statistics products selection, and you will need a Paid account to download the actual report with accurate data and sources. Downloaded report will contain the editable graph with accurate data, an excel table with the actual data, the exact source of the data and the release date. The slide provides the Product Revenue split by segments America, EMEA, APJC of Cisco Systems, Inc in JPY Bn from the year 2014 to 2018. Download it immediately and use it for your business.
-
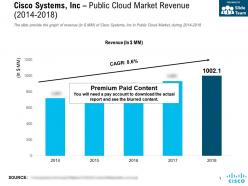 Cisco systems inc public cloud market revenue 2014-2018
This is a professionally designed visual chart for Cisco Systems Inc Public Cloud Market Revenue 2014 to 2018. This is part of our Data and Statistics products selection, and you will need a Paid account to download the actual report with accurate data and sources. Downloaded report will contain the editable graph with accurate data, an excel table with the actual data, the exact source of the data and the release date. The slide provide the graph of revenue in JPY MM of Cisco Systems, Inc in Public Cloud Market, during 2014 to 2018. Download it immediately and use it for your business.
-
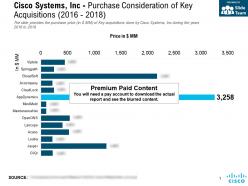 Cisco systems inc purchase consideration of key acquisitions 2016-2018
This is a professionally designed visual chart for Cisco Systems Inc Purchase Consideration Of Key Acquisitions 2016 to 2018. This is part of our Data and Statistics products selection, and you will need a Paid account to download the actual report with accurate data and sources. Downloaded report will contain the editable graph with accurate data, an excel table with the actual data, the exact source of the data and the release date. The slide provides the purchase price in JPY MM of Key acquisitions done by Cisco Systems, Inc during the years 2016 to 2018. Download it immediately and use it for your business.
-
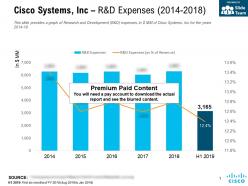 Cisco systems inc r and d expenses 2014-2018
This is a professionally designed visual chart for Cisco Systems Inc R And D Expenses 2014 to 2018. This is part of our Data and Statistics products selection, and you will need a Paid account to download the actual report with accurate data and sources. Downloaded report will contain the editable graph with accurate data, an excel table with the actual data, the exact source of the data and the release date. This slide provides a graph of Research and Development R and D expenses in JPY MM of Cisco Systems, Inc for the years 2014 to 18. Download it immediately and use it for your business.
-
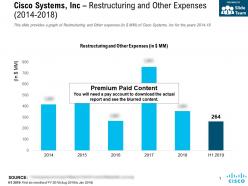 Cisco systems inc restructuring and other expenses 2014-2018
This is a professionally designed visual chart for Cisco Systems Inc Restructuring And Other Expenses 2014 to 2018. This is part of our Data and Statistics products selection, and you will need a Paid account to download the actual report with accurate data and sources. Downloaded report will contain the editable graph with accurate data, an excel table with the actual data, the exact source of the data and the release date. This slide provides a graph of Restructuring and Other expenses in JPY MM of Cisco Systems, Inc for the years 2014 to 18. Download it immediately and use it for your business.
-
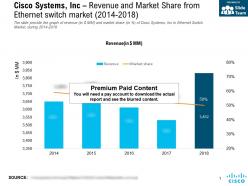 Cisco systems inc revenue and market share from ethernet switch market 2014-2018
This is a professionally designed visual chart for Cisco Systems Inc Revenue And Market Share From Ethernet Switch Market 2014 to 2018. This is part of our Data and Statistics products selection, and you will need a Paid account to download the actual report with accurate data and sources. Downloaded report will contain the editable graph with accurate data, an excel table with the actual data, the exact source of the data and the release date. The slide provide the graph of revenue in JPY MM and market share in percent of Cisco Systems, Inc in Ethernet Switch Market, during 2014 to 2018. Download it immediately and use it for your business.
-
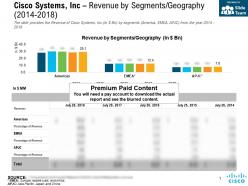 Cisco systems inc revenue by segments geography 2014-2018
This is a professionally designed visual chart for Cisco Systems Inc Revenue By Segments Geography 2014 to 2018. This is part of our Data and Statistics products selection, and you will need a Paid account to download the actual report with accurate data and sources. Downloaded report will contain the editable graph with accurate data, an excel table with the actual data, the exact source of the data and the release date. The slide provides the Revenue of Cisco Systems, Inc in JPY Bn by segments America, EMEA, APJC from the year 2014 to 2018. Download it immediately and use it for your business.
-
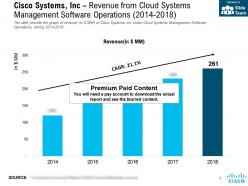 Cisco systems inc revenue from cloud systems management software operations 2014-2018
This is a professionally designed visual chart for Cisco Systems Inc Revenue From Cloud Systems Management Software Operations 2014 to 2018. This is part of our Data and Statistics products selection, and you will need a Paid account to download the actual report with accurate data and sources. Downloaded report will contain the editable graph with accurate data, an excel table with the actual data, the exact source of the data and the release date. The slide provide the graph of revenue in JPY MM of Cisco Systems, Inc under Cloud Systems Management Software Operations, during 2014 to 2018. Download it immediately and use it for your business.
-
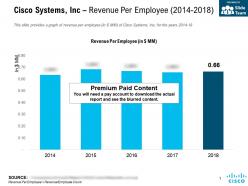 Cisco systems inc revenue per employee 2014-2018
This is a professionally designed visual chart for Cisco Systems Inc Revenue Per Employee 2014 to 2018. This is part of our Data and Statistics products selection, and you will need a Paid account to download the actual report with accurate data and sources. Downloaded report will contain the editable graph with accurate data, an excel table with the actual data, the exact source of the data and the release date. This slide provides a graph of revenue per employee in JPY MM of Cisco Systems, Inc for the years 2014 to 18. Download it immediately and use it for your business.
-
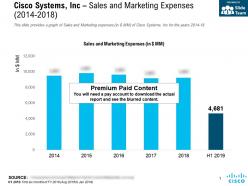 Cisco systems inc sales and marketing expenses 2014-2018
This is a professionally designed visual chart for Cisco Systems Inc Sales And Marketing Expenses 2014 to 2018. This is part of our Data and Statistics products selection, and you will need a Paid account to download the actual report with accurate data and sources. Downloaded report will contain the editable graph with accurate data, an excel table with the actual data, the exact source of the data and the release date. This slide provides a graph of Sales and Marketing expenses in JPY MM of Cisco Systems, Inc for the years 2014 to 18. Download it immediately and use it for your business.
-
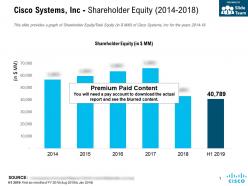 Cisco systems inc shareholder equity 2014-2018
This is a professionally designed visual chart for Cisco Systems Inc Shareholder Equity 2014 to 2018. This is part of our Data and Statistics products selection, and you will need a Paid account to download the actual report with accurate data and sources. Downloaded report will contain the editable graph with accurate data, an excel table with the actual data, the exact source of the data and the release date. This slide provides a graph of Shareholder Equity Total Equity in JPY MM of Cisco Systems, Inc for the years 2014 to 18. Download it immediately and use it for your business.
-
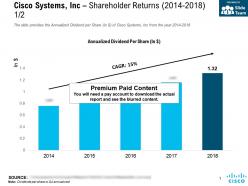 Cisco systems inc shareholder returns 2014-2018
This is a professionally designed visual chart for Cisco Systems Inc Shareholder Returns 2014 to 2018. This is part of our Data and Statistics products selection, and you will need a Paid account to download the actual report with accurate data and sources. Downloaded report will contain the editable graph with accurate data, an excel table with the actual data, the exact source of the data and the release date. The slide provides the Annualized Dividend per Share in JPY of Cisco Systems, Inc from the year 2014 to 2018. Download it immediately and use it for your business.
-
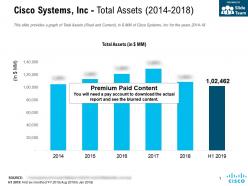 Cisco systems inc total assets 2014-2018
This is a professionally designed visual chart for Cisco Systems Inc Total Assets 2014 to 2018. This is part of our Data and Statistics products selection, and you will need a Paid account to download the actual report with accurate data and sources. Downloaded report will contain the editable graph with accurate data, an excel table with the actual data, the exact source of the data and the release date. This slide provides a graph of Total Assets Fixed and Current in JPY MM of Cisco Systems, Inc for the years 2014 to 18. Download it immediately and use it for your business.
-
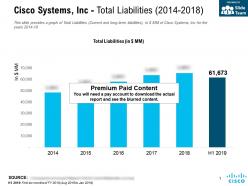 Cisco systems inc total liabilities 2014-2018
This is a professionally designed visual chart for Cisco Systems Inc Total Liabilities 2014 to 2018. This is part of our Data and Statistics products selection, and you will need a Paid account to download the actual report with accurate data and sources. Downloaded report will contain the editable graph with accurate data, an excel table with the actual data, the exact source of the data and the release date. This slide provides a graph of Total Liabilities Current and long term liabilities in JPY MM of Cisco Systems, Inc for the years 2014 to 18. Download it immediately and use it for your business.
-
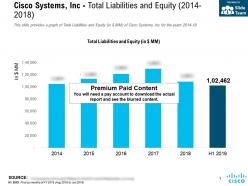 Cisco systems inc total liabilities and equity 2014-2018
This is a professionally designed visual chart for Cisco Systems Inc Total Liabilities And Equity 2014 to 2018. This is part of our Data and Statistics products selection, and you will need a Paid account to download the actual report with accurate data and sources. Downloaded report will contain the editable graph with accurate data, an excel table with the actual data, the exact source of the data and the release date. This slide provides a graph of Total Liabilities and Equity in JPY MM of Cisco Systems, Inc for the years 2014 to 18. Download it immediately and use it for your business.
-
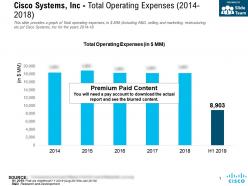 Cisco systems inc total operating expenses 2014-2018
This is a professionally designed visual chart for Cisco Systems Inc Total Operating Expenses 2014 to 2018. This is part of our Data and Statistics products selection, and you will need a Paid account to download the actual report with accurate data and sources. Downloaded report will contain the editable graph with accurate data, an excel table with the actual data, the exact source of the data and the release date. This slide provides a graph of Total operating expenses in JPY MM including R and D, selling and marketing, restructuring etc.of Cisco Systems, Inc for the years 2014 to 18. Download it immediately and use it for your business.
-
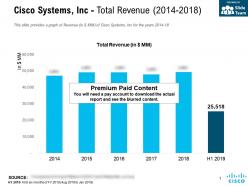 Cisco systems inc total revenue 2014-2018
This is a professionally designed visual chart for Cisco Systems Inc Total Revenue 2014 to 2018. This is part of our Data and Statistics products selection, and you will need a Paid account to download the actual report with accurate data and sources. Downloaded report will contain the editable graph with accurate data, an excel table with the actual data, the exact source of the data and the release date. This slide provides a graph of Revenue in JPY MM of Cisco Systems, Inc for the years 2014 to 18. Download it immediately and use it for your business.
-
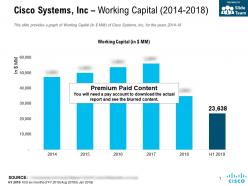 Cisco systems inc working capital 2014-2018
This is a professionally designed visual chart for Cisco Systems Inc Working Capital 2014 to 2018. This is part of our Data and Statistics products selection, and you will need a Paid account to download the actual report with accurate data and sources. Downloaded report will contain the editable graph with accurate data, an excel table with the actual data, the exact source of the data and the release date. This slide provides a graph of Working Capital in JPY MM of Cisco Systems, Inc for the years 2014 to 18. Download it immediately and use it for your business.
-
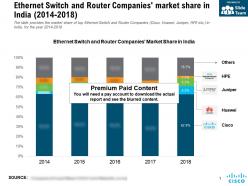 Ethernet switch and router companies market share in india 2014-2018
This is a professionally designed visual chart for Ethernet Switch And Router Companies Market Share In India 2014 to 2018. This is part of our Data and Statistics products selection, and you will need a Paid account to download the actual report with accurate data and sources. Downloaded report will contain the editable graph with accurate data, an excel table with the actual data, the exact source of the data and the release date. The slide provides the market share of top Ethernet Switch and Router Companies Cisco, Huawei, Juniper, HPE etc. in India for the year 2014 to 2018. Download it immediately and use it for your business.
-
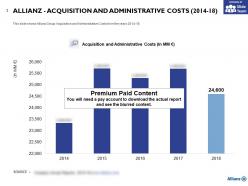 Allianz acquisition and administrative costs 2014-18
This is a professionally designed visual chart for Allianz Acquisition And Administrative Costs 2014 to 18. This is part of our Data and Statistics products selection, and you will need a Paid account to download the actual report with accurate data and sources. Downloaded report will contain the editable graph with accurate data, an excel table with the actual data, the exact source of the data and the release date. This slide shows Allianz Group Acquisition and Administrative Costs from the years 2014 to 18. Download it immediately and use it for your business.
-
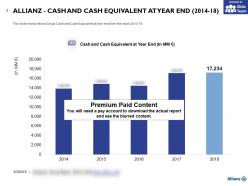 Allianz cash and cash equivalent at year end 2014-18
This is a professionally designed visual chart for Allianz Cash And Cash Equivalent At Year End 2014 to 18. This is part of our Data and Statistics products selection, and you will need a Paid account to download the actual report with accurate data and sources. Downloaded report will contain the editable graph with accurate data, an excel table with the actual data, the exact source of the data and the release date. This slide shows Allianz Group Cash and Cash Equivalent at year end from the years 2014 to 18. Download it immediately and use it for your business.
-
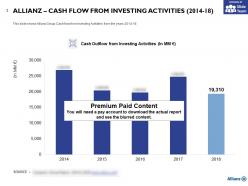 Allianz cash flow from investing activities 2014-18
This is a professionally designed visual chart for Allianz Cash Flow From Investing Activities 2014 to 18. This is part of our Data and Statistics products selection, and you will need a Paid account to download the actual report with accurate data and sources. Downloaded report will contain the editable graph with accurate data, an excel table with the actual data, the exact source of the data and the release date. This slide shows Allianz Group Cash flow from Investing Activities from the years 2014 to 18. Download it immediately and use it for your business.
-
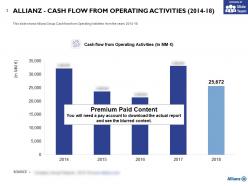 Allianz cash flow from operating activities 2014-18
This is a professionally designed visual chart for Allianz Cash Flow From Operating Activities 2014 to 18. This is part of our Data and Statistics products selection, and you will need a Paid account to download the actual report with accurate data and sources. Downloaded report will contain the editable graph with accurate data, an excel table with the actual data, the exact source of the data and the release date. This slide shows Allianz Group Cash flow from Operating Activities from the years 2014 to 18. Download it immediately and use it for your business.
-
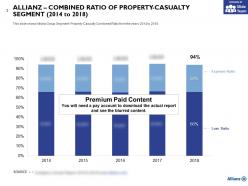 Allianz combined ratio of property casualty segment 2014-2018
This is a professionally designed visual chart for Allianz Combined Ratio Of Property Casualty Segment 2014 to 2018. This is part of our Data and Statistics products selection, and you will need a Paid account to download the actual report with accurate data and sources. Downloaded report will contain the editable graph with accurate data, an excel table with the actual data, the exact source of the data and the release date. This slide shows Allianz Group Segment Property Casualty Combined Ratio from the years 2014 to 2018. Download it immediately and use it for your business.
-
 Allianz enterprise value for five years 2014-18
This is a professionally designed visual chart for Allianz Enterprise Value For Five Years 2014 to 18. This is part of our Data and Statistics products selection, and you will need a Paid account to download the actual report with accurate data and sources. Downloaded report will contain the editable graph with accurate data, an excel table with the actual data, the exact source of the data and the release date. This slide shows Allianz Group Enterprise Value from the years 2014 to 18. Download it immediately and use it for your business.
-
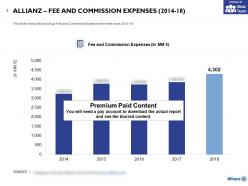 Allianz fee and commission expenses 2014-18
This is a professionally designed visual chart for Allianz Fee And Commission Expenses 2014 to 18. This is part of our Data and Statistics products selection, and you will need a Paid account to download the actual report with accurate data and sources. Downloaded report will contain the editable graph with accurate data, an excel table with the actual data, the exact source of the data and the release date. This slide shows Allianz Group Fee and Commission Expenses from the years 2014 to 18. Download it immediately and use it for your business.
-
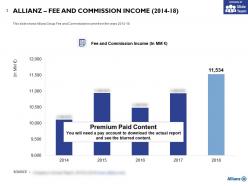 Allianz fee and commission income 2014-18
This is a professionally designed visual chart for Allianz Fee And Commission Income 2014 to 18. This is part of our Data and Statistics products selection, and you will need a Paid account to download the actual report with accurate data and sources. Downloaded report will contain the editable graph with accurate data, an excel table with the actual data, the exact source of the data and the release date. This slide shows Allianz Group Fee and Commission Income from the years 2014 to 18. Download it immediately and use it for your business.
-
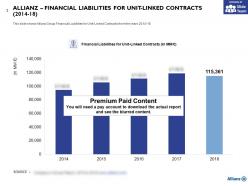 Allianz financial liabilities for unit linked contracts 2014-18
This is a professionally designed visual chart for Allianz Financial Liabilities For Unit Linked Contracts 2014 to 18. This is part of our Data and Statistics products selection, and you will need a Paid account to download the actual report with accurate data and sources. Downloaded report will contain the editable graph with accurate data, an excel table with the actual data, the exact source of the data and the release date. This slide shows Allianz Group Financial Liabilities for Unit Linked Contracts from the years 2014 to 18. Download it immediately and use it for your business.
-
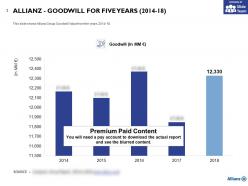 Allianz goodwill for five years 2014-18
This is a professionally designed visual chart for Allianz Goodwill For Five Years 2014 to 18. This is part of our Data and Statistics products selection, and you will need a Paid account to download the actual report with accurate data and sources. Downloaded report will contain the editable graph with accurate data, an excel table with the actual data, the exact source of the data and the release date. This slide shows Allianz Group Goodwill Value from the years 2014 to 18. Download it immediately and use it for your business.
-
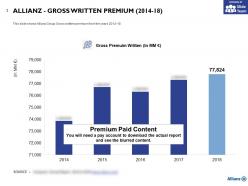 Allianz gross written premium 2014-18
This is a professionally designed visual chart for Allianz Gross Written Premium 2014 to 18. This is part of our Data and Statistics products selection, and you will need a Paid account to download the actual report with accurate data and sources. Downloaded report will contain the editable graph with accurate data, an excel table with the actual data, the exact source of the data and the release date. This slide shows Allianz Group Gross written premium from the years 2014 to 18. Download it immediately and use it for your business.
-
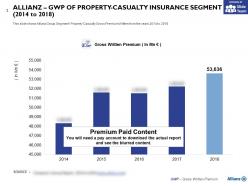 Allianz gwp of property casualty insurance segment 2014-2018
This is a professionally designed visual chart for Allianz GWP Of Property Casualty Insurance Segment 2014 to 2018. This is part of our Data and Statistics products selection, and you will need a Paid account to download the actual report with accurate data and sources. Downloaded report will contain the editable graph with accurate data, an excel table with the actual data, the exact source of the data and the release date. This slide shows Allianz Group Segment Property Casualty Gross Premium Written from the years 2014 to 2018. Download it immediately and use it for your business.
-
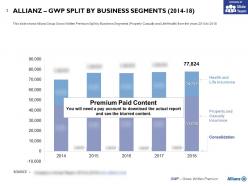 Allianz gwp split by business segments 2014-18
This is a professionally designed visual chart for Allianz GWP Split By Business Segments 2014to 18. This is part of our Data and Statistics products selection, and you will need a Paid account to download the actual report with accurate data and sources. Downloaded report will contain the editable graph with accurate data, an excel table with the actual data, the exact source of the data and the release date. This slide shows Allianz Group Gross Written Premium Split by Business Segments Property Casualty and Life Health from the years 2014 to 2018. Download it immediately and use it for your business.
-
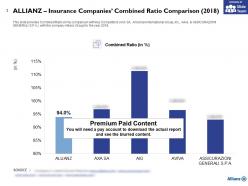 Allianz insurance companies combined ratio comparison 2018
This is a professionally designed visual chart for Allianz Insurance Companies Combined Ratio Comparison 2018. This is part of our Data and Statistics products selection, and you will need a Paid account to download the actual report with accurate data and sources. Downloaded report will contain the editable graph with accurate data, an excel table with the actual data, the exact source of the data and the release date. This slide provides Combined Ratio in percent comparison with Key Competitors AXA SA, American International Group, Inc. Aviva and ASSICURAZIONI GENERALI S.P.A. with the company Allianz Group for the year 2018. Download it immediately and use it for your business.
-
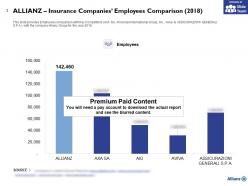 Allianz insurance companies employees comparison 2018
This is a professionally designed visual chart for Allianz Insurance Companies Employees Comparison 2018. This is part of our Data and Statistics products selection, and you will need a Paid account to download the actual report with accurate data and sources. Downloaded report will contain the editable graph with accurate data, an excel table with the actual data, the exact source of the data and the release date. This slide provides Employees comparison with Key Competitors AXA SA, American International Group, Inc. Aviva and ASSICURAZIONI GENERALI S.P.A. with the company Allianz Group for the year 2018. Download it immediately and use it for your business.
-
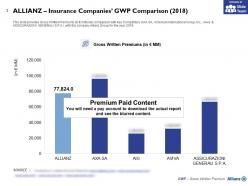 Allianz insurance companies gwp comparison 2018
This is a professionally designed visual chart for Allianz Insurance Companies GWP Comparison 2018. This is part of our Data and Statistics products selection, and you will need a Paid account to download the actual report with accurate data and sources. Downloaded report will contain the editable graph with accurate data, an excel table with the actual data, the exact source of the data and the release date. This slide provides Gross Written Premiums in JPY millions comparison with Key Competitors AXA SA, American International Group, Inc. Aviva and ASSICURAZIONI GENERALI S.P.A. with the company Allianz Group for the year 2018. Download it immediately and use it for your business.
-
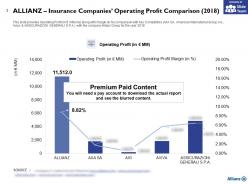 Allianz insurance companies operating profit comparison 2018
This is a professionally designed visual chart for Allianz Insurance Companies Operating Profit Comparison 2018. This is part of our Data and Statistics products selection, and you will need a Paid account to download the actual report with accurate data and sources. Downloaded report will contain the editable graph with accurate data, an excel table with the actual data, the exact source of the data and the release date. This slide provides Operating Profit in JPY millions along with margin in percent comparison with Key Competitors AXA SA, American International Group, Inc. Aviva and ASSICURAZIONI GENERALI S.P.A. with the company Allianz Group for the year 2018. Download it immediately and use it for your business.
-
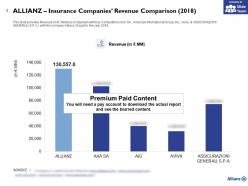 Allianz insurance companies revenue comparison 2018
This is a professionally designed visual chart for Allianz Insurance Companies Revenue Comparison 2018. This is part of our Data and Statistics products selection, and you will need a Paid account to download the actual report with accurate data and sources. Downloaded report will contain the editable graph with accurate data, an excel table with the actual data, the exact source of the data and the release date. This slide provides Revenue in JPY millions comparison with Key Competitors AXA SA, American International Group, Inc. Aviva and ASSICURAZIONI GENERALI S.P.A. with the company Allianz Group for the year 2018. Download it immediately and use it for your business.
-
 Allianz interest and similar income 2014-18
This is a professionally designed visual chart for Allianz Interest And Similar Income 2014 to 18. This is part of our Data and Statistics products selection, and you will need a Paid account to download the actual report with accurate data and sources. Downloaded report will contain the editable graph with accurate data, an excel table with the actual data, the exact source of the data and the release date. This slide shows Allianz Group Interest and Similar Income from the years 2014 to 18. Download it immediately and use it for your business.
-
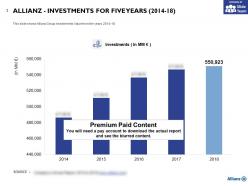 Allianz investments for five years 2014-18
This is a professionally designed visual chart for Allianz Investments For Five Years 2014 to 18. This is part of our Data and Statistics products selection, and you will need a Paid account to download the actual report with accurate data and sources. Downloaded report will contain the editable graph with accurate data, an excel table with the actual data, the exact source of the data and the release date. This slide shows Allianz Group Investments Value from the years 2014 to 18. Download it immediately and use it for your business.
-
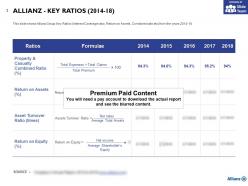 Allianz key ratios 2014-18
This is a professionally designed visual chart for Allianz Key Ratios 2014 to 18. This is part of our Data and Statistics products selection, and you will need a Paid account to download the actual report with accurate data and sources. Downloaded report will contain the editable graph with accurate data, an excel table with the actual data, the exact source of the data and the release date. This slide shows Allianz Group Key Ratios Interest Coverage ratio, Return on Assets, Combined ratio etc. from the years 2014 to 18. Download it immediately and use it for your business.
-
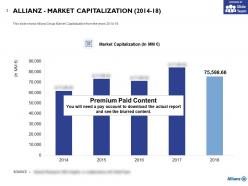 Allianz market capitalization 2014-18
This is a professionally designed visual chart for Allianz Market Capitalization 2014 to 18. This is part of our Data and Statistics products selection, and you will need a Paid account to download the actual report with accurate data and sources. Downloaded report will contain the editable graph with accurate data, an excel table with the actual data, the exact source of the data and the release date. This slide shows Allianz Group Market Capitalization from the years 2014 to 18. Download it immediately and use it for your business.
-
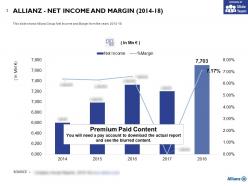 Allianz net income and margin 2014-18
This is a professionally designed visual chart for Allianz Net Income And Margin 2014 to 18. This is part of our Data and Statistics products selection, and you will need a Paid account to download the actual report with accurate data and sources. Downloaded report will contain the editable graph with accurate data, an excel table with the actual data, the exact source of the data and the release date. This slide shows Allianz Group Net Income and Margin from the years 2014 to 18. Download it immediately and use it for your business.
-
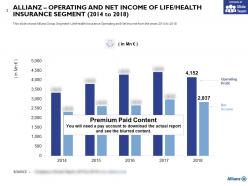 Allianz operating and net income of life health insurance segment 2014-2018
This is a professionally designed visual chart for Allianz Operating And Net Income Of Life Health Insurance Segment 2014 to 2018. This is part of our Data and Statistics products selection, and you will need a Paid account to download the actual report with accurate data and sources. Downloaded report will contain the editable graph with accurate data, an excel table with the actual data, the exact source of the data and the release date. This slide shows Allianz Group Segment Life Health Insurance Operating and Net Income from the years 2014 to 2018. Download it immediately and use it for your business.
-
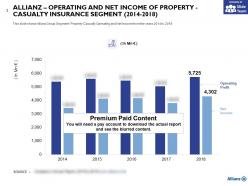 Allianz operating and net income of property casualty insurance segment 2014-2018
This is a professionally designed visual chart for Allianz Operating And Net Income Of Property Casualty Insurance Segment 2014 to 2018. This is part of our Data and Statistics products selection, and you will need a Paid account to download the actual report with accurate data and sources. Downloaded report will contain the editable graph with accurate data, an excel table with the actual data, the exact source of the data and the release date. This slide shows Allianz Group Segment Property Casualty Operating and Net Income from the years 2014 to 2018. Download it immediately and use it for your business.
-
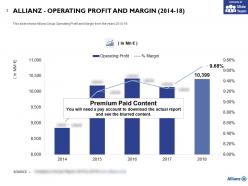 Allianz operating profit and margin 2014-18
This is a professionally designed visual chart for Allianz Operating Profit And Margin 2014 to 18. This is part of our Data and Statistics products selection, and you will need a Paid account to download the actual report with accurate data and sources. Downloaded report will contain the editable graph with accurate data, an excel table with the actual data, the exact source of the data and the release date. This slide shows Allianz Group Operating Profit and Margin from the years 2014 to 18. Download it immediately and use it for your business.
-
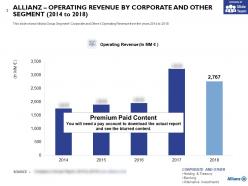 Allianz operating revenue by corporate and other segment 2014-2018
This is a professionally designed visual chart for Allianz Operating Revenue By Corporate And Other Segment 2014 to 2018. This is part of our Data and Statistics products selection, and you will need a Paid account to download the actual report with accurate data and sources. Downloaded report will contain the editable graph with accurate data, an excel table with the actual data, the exact source of the data and the release date. This slide shows Allianz Group Segment Corporate and Others Operating Revenue from the years 2014 to 2018. Download it immediately and use it for your business.
-
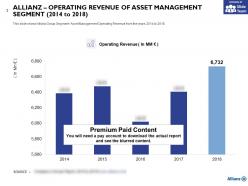 Allianz operating revenue of asset management segment 2014-2018
This is a professionally designed visual chart for Allianz Operating Revenue Of Asset Management Segment 2014 to 2018. This is part of our Data and Statistics products selection, and you will need a Paid account to download the actual report with accurate data and sources. Downloaded report will contain the editable graph with accurate data, an excel table with the actual data, the exact source of the data and the release date. This slide shows Allianz Group Segment Asset Management Operating Revenue from the years 2014 to 2018. Download it immediately and use it for your business.
-
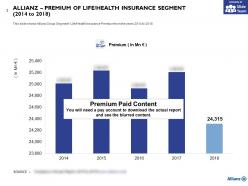 Allianz premium of life health insurance segment 2014-2018
This is a professionally designed visual chart for Allianz Premium Of Life Health Insurance Segment 2014 to 2018. This is part of our Data and Statistics products selection, and you will need a Paid account to download the actual report with accurate data and sources. Downloaded report will contain the editable graph with accurate data, an excel table with the actual data, the exact source of the data and the release date. This slide shows Allianz Group Segment Life Health Insurance Premium from the years 2014 to 2018. Download it immediately and use it for your business.
-
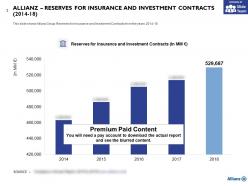 Allianz reserves for insurance and investment contracts 2014-18
This is a professionally designed visual chart for Allianz Reserves For Insurance And Investment Contracts 2014 to 18. This is part of our Data and Statistics products selection, and you will need a Paid account to download the actual report with accurate data and sources. Downloaded report will contain the editable graph with accurate data, an excel table with the actual data, the exact source of the data and the release date. This slide shows Allianz Group Reserves for Insurance and Investment Contracts from the years 2014 to 18. Download it immediately and use it for your business.
-
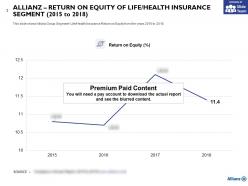 Allianz return on equity of life health insurance segment 2015-2018
This is a professionally designed visual chart for Allianz Return On Equity Of Life Health Insurance Segment 2015 to 2018. This is part of our Data and Statistics products selection, and you will need a Paid account to download the actual report with accurate data and sources. Downloaded report will contain the editable graph with accurate data, an excel table with the actual data, the exact source of the data and the release date. This slide shows Allianz Group Segment Life Health Insurance Return on Equity from the years 2015 to 2018. Download it immediately and use it for your business.
-
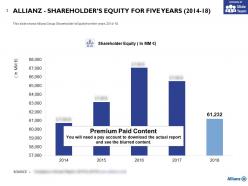 Allianz shareholders equity for five years 2014-18
This is a professionally designed visual chart for Allianz Shareholders Equity For Five Years 2014 to 18. This is part of our Data and Statistics products selection, and you will need a Paid account to download the actual report with accurate data and sources. Downloaded report will contain the editable graph with accurate data, an excel table with the actual data, the exact source of the data and the release date. This slide shows Allianz Group Shareholders Equity from the years 2014 to 18. Download it immediately and use it for your business.


