Consumer Goods and FMCG Data Statistics PowerPoint Templates, PowerPoint Statistics Slides
- Sub Categories
-
- Agriculture
- Chemicals and Resources
- Construction
- Consumer Goods and FMCG
- E-Commerce
- Energy and Environmental Services
- Finance Insurance and Real Estate
- Health and Pharmaceuticals
- Internet
- Life
- Media and Advertising
- Metals and Electronics
- Retail and Trade
- Services
- Society
- Sports and Recreation
- Survey
- Technology and Telecommunications
- Transportation and Logistics
- Travel Tourism and Hospitality
- USA
-
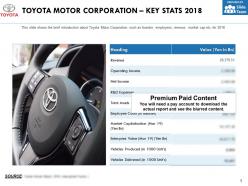 Toyota motor corporation key stats 2018
The information presented in this slide has been researched by our team of professional business analysts. This is part of our Company Profiles products selection, and you will need a Paid account to download the actual report with accurate data and sources. Downloaded report will be in Powerpoint and will contain the actual editable slides with the actual data and sources for each data. This slide shows the brief introduction about Toyota Motor Corporation such as founder, employees, revenue, market cap etc. for 2018. Download it immediately and use it for your business.
-
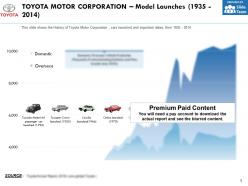 Toyota motor corporation model launches 1935-2014
The information presented in this slide has been researched by our team of professional business analysts. This is part of our Company Profiles products selection, and you will need a Paid account to download the actual report with accurate data and sources. Downloaded report will be in Powerpoint and will contain the actual editable slides with the actual data and sources for each data. This slide shows the History of Toyota Motor Corporation, cars launched and important dates, from 1935 to 2014. Download it immediately and use it for your business.
-
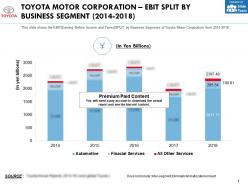 Toyota motor corporation ebit split by business segment 2014-2018
This is a professionally designed visual chart for Toyota Motor Corporation Ebit Split By Business Segment 2014 to 2018. This is part of our Data and Statistics products selection, and you will need a Paid account to download the actual report with accurate data and sources. Downloaded report will contain the editable graph with accurate data, an excel table with the actual data, the exact source of the data and the release date. This slide shows the EBIT Earning Before Income and Taxes SPLIT by Business Segments of Toyota Motor Corporation from 2014 to 2018. Download it immediately and use it for your business.
-
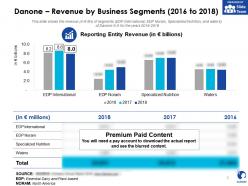 Danone revenue by business segments 2016-2018
This is a professionally designed visual chart for Danone Revenue By Business Segments 2016 to 2018. This is part of our Data and Statistics products selection, and you will need a Paid account to download the actual report with accurate data and sources. Downloaded report will contain the editable graph with accurate data, an excel table with the actual data, the exact source of the data and the release date. This slide shows the revenue in JPY Bn of segments EDP International, EDP Noram, Specialized Nutrition, and waters of Danone S.A for the years 2016 to 2018. Download it immediately and use it for your business.
-
 Danone sa net profit and margin 2014-2018
This is a professionally designed visual chart for Danone SA Net Profit And Margin 2014 to 2018. This is part of our Data and Statistics products selection, and you will need a Paid account to download the actual report with accurate data and sources. Downloaded report will contain the editable graph with accurate data, an excel table with the actual data, the exact source of the data and the release date. This slide provides a graph of net income in JPY MM and net income margin in percent of Danone S.A for the years 2014 to 18. Download it immediately and use it for your business.
-
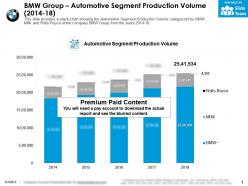 Bmw group automotive segment production volume 2014-18
This is a professionally designed visual chart for BMW Group Automotive Segment Production Volume 2014 to 18. This is part of our Data and Statistics products selection, and you will need a Paid account to download the actual report with accurate data and sources. Downloaded report will contain the editable graph with accurate data, an excel table with the actual data, the exact source of the data and the release date. This slide provides a stack chart showing the Automotive Segment Production Volume categorized by BMW, MINI and Rolls-Royce of the company BMW Group from the years 2014 to 18. Download it immediately and use it for your business.
-
 Bmw group automotive segment sales volume by region 2017-2018
This is a professionally designed visual chart for BMW Group Automotive Segment Sales Volume By Region 2017 to 2018. This is part of our Data and Statistics products selection, and you will need a Paid account to download the actual report with accurate data and sources. Downloaded report will contain the editable graph with accurate data, an excel table with the actual data, the exact source of the data and the release date. This slide provides a pie chart showing the Automotive Segment Sales Volume by Region including Americas, Europe, Mainland China etc. in Percentage of the company BMW Group for the years 2017 to 2018. Download it immediately and use it for your business.
-
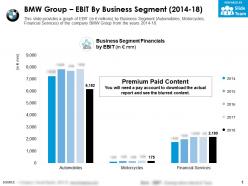 Bmw group ebit by business segment 2014-18
This is a professionally designed visual chart for BMW Group EBIT By Business Segment 2014 to 18. This is part of our Data and Statistics products selection, and you will need a Paid account to download the actual report with accurate data and sources. Downloaded report will contain the editable graph with accurate data, an excel table with the actual data, the exact source of the data and the release date. This slide provides a graph of EBIT in JPY millions by Business Segment Automobiles, Motorcycles, Financial Services of the company BMW Group from the years 2014 to 18. Download it immediately and use it for your business.
-
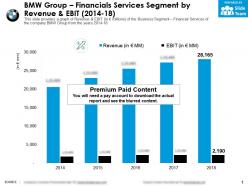 Bmw group financials services segment by revenue and ebit 2014-18
This is a professionally designed visual chart for BMW Group Financials Services Segment By Revenue And EBIT 2014 to 18. This is part of our Data and Statistics products selection, and you will need a Paid account to download the actual report with accurate data and sources. Downloaded report will contain the editable graph with accurate data, an excel table with the actual data, the exact source of the data and the release date. This slide provides a graph of Revenue and EBIT in JPY millions of the Business Segment Financial Services of the company BMW Group from the years 2014 to 18. Download it immediately and use it for your business.
-
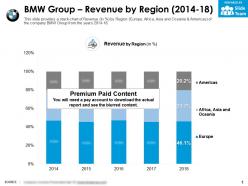 Bmw group revenue by region 2014-18
This is a professionally designed visual chart for BMW Group Revenue By Region 2014 to 18. This is part of our Data and Statistics products selection, and you will need a Paid account to download the actual report with accurate data and sources. Downloaded report will contain the editable graph with accurate data, an excel table with the actual data, the exact source of the data and the release date. This slide provides a stack chart of Revenue in Percentage by Region Europe, Africa, Asia and Oceania and Americas of the company BMW Group from the years 2014 to 18. Download it immediately and use it for your business.
-
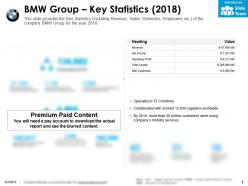 Bmw group key statistics 2018
The information presented in this slide has been researched by our team of professional business analysts. This is part of our Company Profiles products selection, and you will need a Paid account to download the actual report with accurate data and sources. Downloaded report will be in Powerpoint and will contain the actual editable slides with the actual data and sources for each data. This slide provides the Key Statistics including Revenue, Sales, Deliveries, Employees etc. of the company BMW Group for the year 2018. Download it immediately and use it for your business.
-
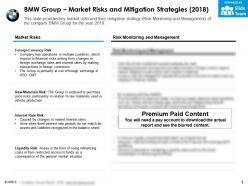 Bmw group market risks and mitigation strategies 2018
The information presented in this slide has been researched by our team of professional business analysts. This is part of our Company Profiles products selection, and you will need a Paid account to download the actual report with accurate data and sources. Downloaded report will be in Powerpoint and will contain the actual editable slides with the actual data and sources for each data. This slide provides key market risks and their mitigation strategy Risk Monitoring and Management of the company BMW Group for the year 2018. Download it immediately and use it for your business.
-
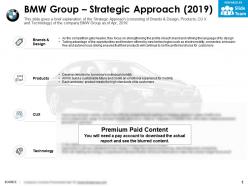 Bmw group strategic approach 2019
The information presented in this slide has been researched by our team of professional business analysts. This is part of our Company Profiles products selection, and you will need a Paid account to download the actual report with accurate data and sources. Downloaded report will be in Powerpoint and will contain the actual editable slides with the actual data and sources for each data. This slide gives a brief explanation of the Strategic Approach consisting of Brands and Design, Products, CU X and Technology of the company BMW Group as of Apr, 2019. Download it immediately and use it for your business.
-
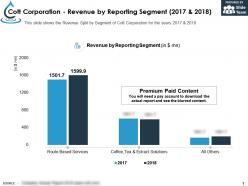 Cott corporation revenue by reporting segment 2017-2018
This is a professionally designed visual chart for Cott Corporation Revenue By Reporting Segment 2017 to 2018. This is part of our Data and Statistics products selection, and you will need a Paid account to download the actual report with accurate data. Downloaded report will contain the editable graph with accurate data, an excel table with the actual data, the exact source of the data and the release date. This slide shows the Revenue Split by Segment of Cott Corporation for the years 2017 to 2018. Download it immediately and use it for your business.
-
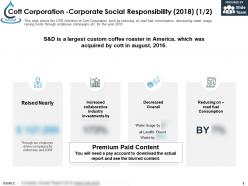 Cott corporation corporate social responsibility 2018
The information presented in this slide has been researched by our team of professional business analysts. This is part of our Company Profiles products selection, and you will need a Paid account to download the actual report with accurate data and sources. Downloaded report will be in Powerpoint and will contain the actual editable slides with the actual data and sources for each data. This slide shows the CSR Activities of Cott Corporation such as reducing on road fuel consumption, decreasing water usage, raising funds through employee campaigns etc. for the year 2018. Download it immediately and use it for your business.
-
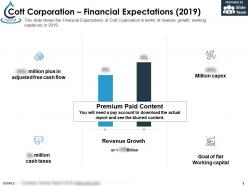 Cott corporation financial expectations 2019
The information presented in this slide has been researched by our team of professional business analysts. This is part of our Company Profiles products selection, and you will need a Paid account to download the actual report with accurate data and sources. Downloaded report will be in Powerpoint and will contain the actual editable slides with the actual data and sources for each data. This slide shows the Financial Expectations of Cott Corporation in terms of revenue growth, working capital etc in 2019. Download it immediately and use it for your business.
-
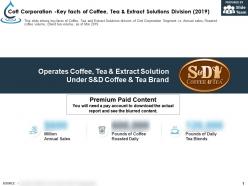 Cott corporation key facts of coffee tea and extract solutions division 2019
The information presented in this slide has been researched by our team of professional business analysts. This is part of our Company Profiles products selection, and you will need a Paid account to download the actual report with accurate data and sources. Downloaded report will be in Powerpoint and will contain the actual editable slides with the actual data and sources for each data. This slide shows key facts of Coffee, Tea and Extract Solutions division of Cott Corporation Segment i.e. Annual sales, Roasted coffee volume, Blend tea volume, as of Mar 2019. Download it immediately and use it for your business.
-
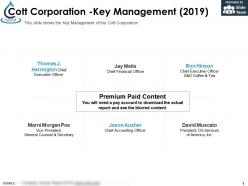 Cott corporation key management 2019
The information presented in this slide has been researched by our team of professional business analysts. This is part of our Company Profiles products selection, and you will need a Paid account to download the actual report with accurate data and sources. Downloaded report will be in Powerpoint and will contain the actual editable slides with the actual data and sources for each data. This slide shows the Key Management of the Cott Corporation. Download it immediately and use it for your business.
-
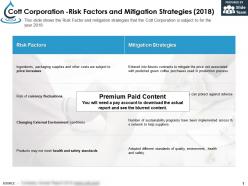 Cott corporation risk factors and mitigation strategies 2018
The information presented in this slide has been researched by our team of professional business analysts. This is part of our Company Profiles products selection, and you will need a Paid account to download the actual report with accurate data and sources. Downloaded report will be in Powerpoint and will contain the actual editable slides with the actual data and sources for each data. This slide shows the Risk Factor and mitigation strategies that the Cott Corporation is subject to for the year 2018. Download it immediately and use it for your business.
-
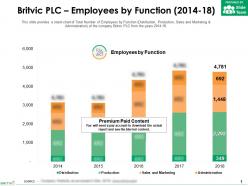 Britvic plc employees by function 2014-18
This is a professionally designed visual chart for Britvic Plc Employees By Function 2014 to 18. This is part of our Data and Statistics products selection, and you will need a Paid account to download the actual report with accurate data and sources. Downloaded report will contain the editable graph with accurate data, an excel table with the actual data, the exact source of the data and the release date. This slide provides a stack chart of Total Number of Employees by Function Distribution, Production, Sales and Marketing and Administration of the company Britvic PLC from the years 2014 to 18. Download it immediately and use it for your business.
-
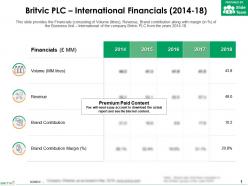 Britvic plc international financials 2014-18
This is a professionally designed visual chart for Britvic Plc International Financials 2014 to 18. This is part of our Data and Statistics products selection, and you will need a Paid account to download the actual report with accurate data and sources. Downloaded report will contain the editable graph with accurate data, an excel table with the actual data, the exact source of the data and the release date. This slide provides the Financials consisting of Volume litres, Revenue, Brand contribution along with margin in percent of the Business Unit International of the company Britvic PLC from the years 2014 to 18. Download it immediately and use it for your business.
-
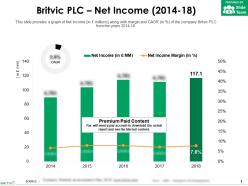 Britvic plc net income 2014-18
This is a professionally designed visual chart for Britvic Plc Net Income 2014 to 18. This is part of our Data and Statistics products selection, and you will need a Paid account to download the actual report with accurate data and sources. Downloaded report will contain the editable graph with accurate data, an excel table with the actual data, the exact source of the data and the release date. This slide provides a graph of Net Income in JPY millions along with margin and CAGR in percent of the company Britvic PLC from the years 2014 to 18. Download it immediately and use it for your business.
-
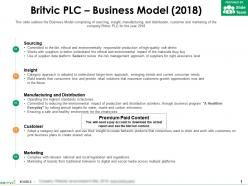 Britvic plc business model 2018
The information presented in this slide has been researched by our team of professional business analysts. This is part of our Company Profiles products selection, and you will need a Paid account to download the actual report with accurate data and sources. Downloaded report will be in Powerpoint and will contain the actual editable slides with the actual data and sources for each data. This slide outlines the Business Model comprising of sourcing, insight, manufacturing and distribution, customer and marketing of the company Britvic PLC for the year 2018. Download it immediately and use it for your business.
-
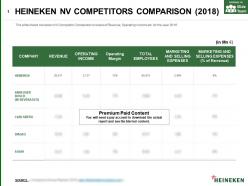 Heineken nv competitors comparison 2018
This is a professionally designed visual chart for Heineken Nv Competitors Comparison 2018. This is part of our Data and Statistics products selection, and you will need a Paid account to download the actual report with accurate data and sources. Downloaded report will contain the editable graph with accurate data, an excel table with the actual data, the exact source of the data and the release date. This slide shows Heineken NV Competitor Comparison on basis of Revenue, Operating Income etc. for the year 2018. Download it immediately and use it for your business.
-
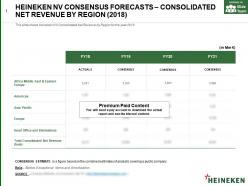 Heineken nv consensus forecasts consolidated net revenue by region 2018
The information presented in this slide has been researched by our team of professional business analysts. This is part of our Company Profiles products selection, and you will need a Paid account to download the actual report with accurate data and sources. Downloaded report will be in Powerpoint and will contain the actual editable slides with the actual data and sources for each data. This slide shows Heineken NV Consolidated Net Revenue by Region for the year 2018. Download it immediately and use it for your business.
-
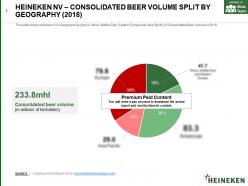 Heineken nv consolidated beer volume split by geography 2018
The information presented in this slide has been researched by our team of professional business analysts. This is part of our Company Profiles products selection, and you will need a Paid account to download the actual report with accurate data and sources. Downloaded report will be in Powerpoint and will contain the actual editable slides with the actual data and sources for each data. This slide shows Heineken NVs Geographical Split in Africa, Middle East, Eastern Europe and Asia Pacific of Consolidated Beer Volume in 2018. Download it immediately and use it for your business.
-
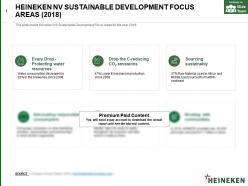 Heineken nv sustainable development focus areas 2018
The information presented in this slide has been researched by our team of professional business analysts. This is part of our Company Profiles products selection, and you will need a Paid account to download the actual report with accurate data and sources. Downloaded report will be in Powerpoint and will contain the actual editable slides with the actual data and sources for each data. This slide shows Heineken NV Sustainable Development Focus Areas for the year 2018. Download it immediately and use it for your business.
-
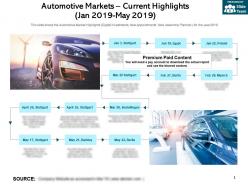 Automotive markets current highlights jan 2019 may 2019
The information presented in this slide has been researched by our team of professional business analysts. This is part of our Company Profiles products selection, and you will need a Paid account to download the actual report with accurate data and sources. Downloaded report will be in Powerpoint and will contain the actual editable slides with the actual data and sources for each data. This slide shows the Automotive Market Highlights Digital Investments, New Appointments, New Assembly Plant etc. for the year 2019. Download it immediately and use it for your business.
-
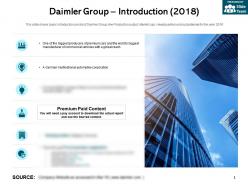 Daimler group introduction 2018
The information presented in this slide has been researched by our team of professional business analysts. This is part of our Company Profiles products selection, and you will need a Paid account to download the actual report with accurate data and sources. Downloaded report will be in Powerpoint and will contain the actual editable slides with the actual data and sources for each data. This slide shows basic Introduction points of Daimler Group like Production output, Market cap, Headquarters and subsidiaries for the year 2018. Download it immediately and use it for your business.
-
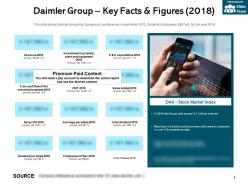 Daimler group key facts and figures 2018
The information presented in this slide has been researched by our team of professional business analysts. This is part of our Company Profiles products selection, and you will need a Paid account to download the actual report with accurate data and sources. Downloaded report will be in Powerpoint and will contain the actual editable slides with the actual data and sources for each data. This slide shows Daimler Group Key figures such as Revenue, Investments, EPS, Dividend, Employees, EBIT etc. for the year 2018. Download it immediately and use it for your business.
-
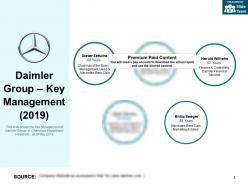 Daimler group key management 2019
The information presented in this slide has been researched by our team of professional business analysts. This is part of our Company Profiles products selection, and you will need a Paid account to download the actual report with accurate data and sources. Downloaded report will be in Powerpoint and will contain the actual editable slides with the actual data and sources for each data. This slide shows the Key Management of Daimler Group i.e. Chairman, Department Heads etc. as of May 2019. Download it immediately and use it for your business.
-
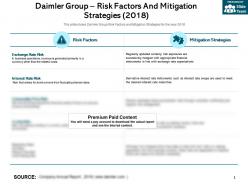 Daimler group risk factors and mitigation strategies 2018
The information presented in this slide has been researched by our team of professional business analysts. This is part of our Company Profiles products selection, and you will need a Paid account to download the actual report with accurate data and sources. Downloaded report will be in Powerpoint and will contain the actual editable slides with the actual data and sources for each data. This slide shows Daimler Group Risk Factors and Mitigation Strategies for the year 2018. Download it immediately and use it for your business.
-
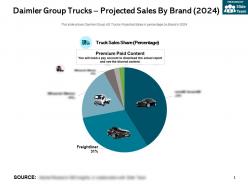 Daimler group trucks projected sales by brand 2024
The information presented in this slide has been researched by our team of professional business analysts. This is part of our Company Profiles products selection, and you will need a Paid account to download the actual report with accurate data and sources. Downloaded report will be in Powerpoint and will contain the actual editable slides with the actual data and sources for each data. This slide shows Daimler Group AG Trucks Projected Sales in percentage by Brand in 2024. Download it immediately and use it for your business.
-
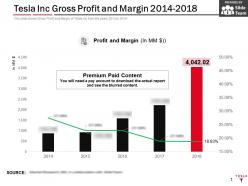 Tesla inc gross profit and margin 2014-2018
This is a professionally designed visual chart for Tesla Inc Gross Profit And Margin 2014 to 2018. This is part of our Data and Statistics products selection, and you will need a Paid account to download the actual report with accurate data and sources. Downloaded report will contain the editable graph with accurate data, an excel table with the actual data, the exact source of the data and the release date. This slide shows Gross Profit and Margin of Tesla Inc from the years 2014 to 2018. Download it immediately and use it for your business.
-
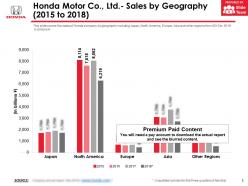 Honda motor co ltd sales by geography 2015-2018
This is a professionally designed visual chart for Honda Motor Co Ltd Sales By Geography 2015 to 2018. This is part of our Data and Statistics products selection, and you will need a Paid account to download the actual report with accurate data and sources. Downloaded report will contain the editable graph with accurate data, an excel table with the actual data, the exact source of the data and the release date. This slide covers the sales of Honda company by geography including Japan, North America, Europe, Asia and other regions from 2015 to 2018 in billions JPY. Download it immediately and use it for your business.
-
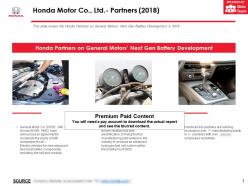 Honda motor co ltd partners 2018
The information presented in this slide has been researched by our team of professional business analysts. This is part of our Company Profiles products selection, and you will need a Paid account to download the actual report with accurate data and sources. Downloaded report will be in Powerpoint and will contain the actual editable slides with the actual data and sources for each data. This slide covers the Honda Partners on General Motors Next Gen Battery Development in 2018. Download it immediately and use it for your business.
-
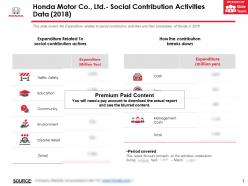 Honda motor co ltd social contribution activities data 2018
The information presented in this slide has been researched by our team of professional business analysts. This is part of our Company Profiles products selection, and you will need a Paid account to download the actual report with accurate data and sources. Downloaded report will be in Powerpoint and will contain the actual editable slides with the actual data and sources for each data. This slide covers the Expenditure related to social contribution activities and their breakdown of Honda in 2018. Download it immediately and use it for your business.
-
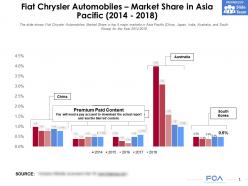 Fiat chrysler automobiles market share in asia pacific 2014-2018
This is a professionally designed visual chart for Fiat Chrysler Automobiles Market Share In Asia Pacific 2014 to 2018. This is part of our Data and Statistics products selection, and you will need a Paid account to download the actual report with accurate data and sources. Downloaded report will contain the editable graph with accurate data, an excel table with the actual data, the exact source of the data and the release date. The slide shows Fiat Chrysler Automobiles Market Share in top 5 major markets in Asia Pacific China, Japan, India, Australia, and South Korea for the Year 2014 to 2018. Download it immediately and use it for your business.
-
 Fiat chrysler automobiles market share in brazil 2014-2018
This is a professionally designed visual chart for Fiat Chrysler Automobiles Market Share In Brazil 2014 to 2018. This is part of our Data and Statistics products selection, and you will need a Paid account to download the actual report with accurate data and sources. Downloaded report will contain the editable graph with accurate data, an excel table with the actual data, the exact source of the data and the release date. The slide shows Fiat Chrysler Automobiles Market Share in Brazil Comparing to its competitors in the market General Motors, Volkswagen and Ford for the Year 2014 to 2018. Download it immediately and use it for your business.
-
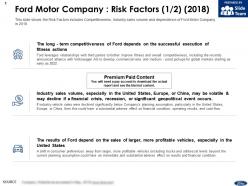 Ford motor company risk factors 2018
The information presented in this slide has been researched by our team of professional business analysts. This is part of our Company Profiles products selection, and you will need a Paid account to download the actual report with accurate data and sources. Downloaded report will be in Powerpoint and will contain the actual editable slides with the actual data and sources for each data. This slide shows the Risk Factors includes Competitiveness, Industry sales volume and dependence of Ford Motor Company in 2018. Download it immediately and use it for your business.
-
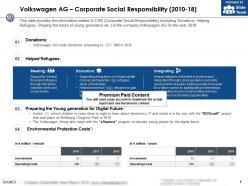 Volkswagen ag corporate social responsibility 2010-18
The information presented in this slide has been researched by our team of professional business analysts. This is part of our Company Profiles products selection, and you will need a Paid account to download the actual report with accurate data and sources. Downloaded report will be in Powerpoint and will contain the actual editable slides with the actual data and sources for each data. This slide provides the information related to CSR Corporate Social Responsibility including Donations, Helping Refugees, Shaping the future of young generation etc. of the company Volkswagen AG for the year 2018. Download it immediately and use it for your business.
-
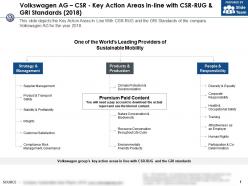 Volkswagen ag csr key action areas in line with csr rug and gri standards 2018
The information presented in this slide has been researched by our team of professional business analysts. This is part of our Company Profiles products selection, and you will need a Paid account to download the actual report with accurate data and sources. Downloaded report will be in Powerpoint and will contain the actual editable slides with the actual data and sources for each data. This slide depicts the Key Action Areas In Line With CSR RUG and the GRI Standards of the company Volkswagen AG for the year 2018. Download it immediately and use it for your business.
-
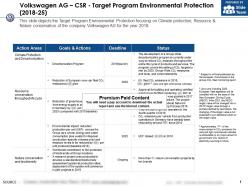 Volkswagen ag csr target program environmental protection 2018-25
The information presented in this slide has been researched by our team of professional business analysts. This is part of our Company Profiles products selection, and you will need a Paid account to download the actual report with accurate data and sources. Downloaded report will be in Powerpoint and will contain the actual editable slides with the actual data and sources for each data. This slide depicts the Target Program Environmental Protection focusing on Climate protection, Resource and Nature conservation of the company Volkswagen AG for the year 2018. Download it immediately and use it for your business.
-
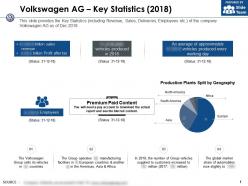 Volkswagen ag key statistics 2018
The information presented in this slide has been researched by our team of professional business analysts. This is part of our Company Profiles products selection, and you will need a Paid account to download the actual report with accurate data and sources. Downloaded report will be in Powerpoint and will contain the actual editable slides with the actual data and sources for each data. This slide provides the Key Statistics including Revenue, Sales, Deliveries, Employees etc. of the company Volkswagen AG as of Dec 2018. Download it immediately and use it for your business.
-
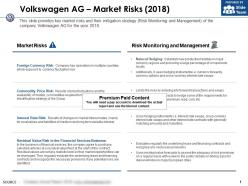 Volkswagen ag market risks 2018
The information presented in this slide has been researched by our team of professional business analysts. This is part of our Company Profiles products selection, and you will need a Paid account to download the actual report with accurate data and sources. Downloaded report will be in Powerpoint and will contain the actual editable slides with the actual data and sources for each data. This slide provides key market risks and their mitigation strategy Risk Monitoring and Management of the company Volkswagen AG for the year 2018. Download it immediately and use it for your business.
-
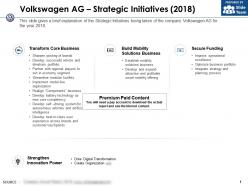 Volkswagen ag strategic initiatives 2018
The information presented in this slide has been researched by our team of professional business analysts. This is part of our Company Profiles products selection, and you will need a Paid account to download the actual report with accurate data and sources. Downloaded report will be in Powerpoint and will contain the actual editable slides with the actual data and sources for each data. This slide gives a brief explanation of the Strategic Initiatives being taken of the company Volkswagen AG for the year 2018. Download it immediately and use it for your business.
-
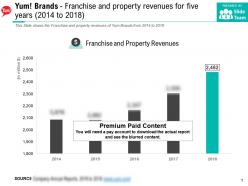 Yum brands franchise and property revenues for five years 2014-2018
This is a professionally designed visual chart for Yum Brands Franchise And Property Revenues For Five Years 2014 to 2018. This is part of our Data and Statistics products selection, and you will need a Paid account to download the actual report with accurate data and sources. Downloaded report will contain the editable graph with accurate data, an excel table with the actual data, the exact source of the data and the release date. This Slide shows the Franchise and property revenues of Yum Brands from 2014 to 2018. Download it immediately and use it for your business.
-
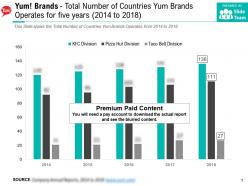 Yum brands total number of countries yum brands operates for five years 2014-2018
This is a professionally designed visual chart for Yum Brands Total Number Of Countries Yum Brands Operates For Five Years 2014 to 2018. This is part of our Data and Statistics products selection, and you will need a Paid account to download the actual report with accurate data and sources. Downloaded report will contain the editable graph with accurate data, an excel table with the actual data, the exact source of the data and the release date. This Slide shows the Total Number of Countries Yum Brands Operates from 2014 to 2018. Download it immediately and use it for your business.
-
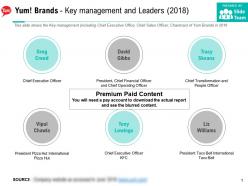 Yum brands key management and leaders 2018
The information presented in this slide has been researched by our team of professional business analysts. This is part of our Company Profiles products selection, and you will need a Paid account to download the actual report with accurate data and sources. Downloaded report will be in Powerpoint and will contain the actual editable slides with the actual data and sources for each data. This slide shows the Key management including Chief Executive Office, Chief Sales Officer, Chairman of Yum Brands in 2018. Download it immediately and use it for your business.
-
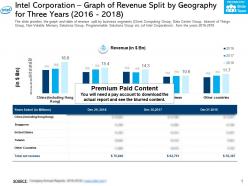 Intel corporation graph of revenue split by geography for three years 2016-2018
This is a professionally designed visual chart for Intel Corporation Graph Of Revenue Split By Geography For Three Years 2016 to 2018. This is part of our Data and Statistics products selection, and you will need a Paid account to download the actual report with accurate data and sources. Downloaded report will contain the editable graph with accurate data, an excel table with the actual data, the exact source of the data and the release date. The slide provides the graph and table of revenue split by business segments Client Computing Group Data Center Group Internet of Things Group Non-Volatile Memory Solutions Group Programmable Solutions Group etc of Intel Corporations from the years 2016 to 2018. Download it immediately and use it for your business.
-
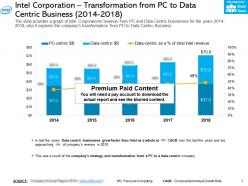 Intel corporation transformation from pc to data centric business 2014-2018
This is a professionally designed visual chart for Intel Corporation Transformation From Pc To Data Centric Business 2014 to 2018. This is part of our Data and Statistics products selection, and you will need a Paid account to download the actual report with accurate data and sources. Downloaded report will contain the editable graph with accurate data, an excel table with the actual data, the exact source of the data and the release date. The slide provides a graph of Intel Corporations revenue from PC and Data Centric businesses for the years 2014 to 2018 also it explains the companys transformation from PC to Data Centric Business. Download it immediately and use it for your business.
-
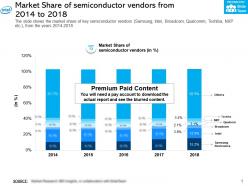 Market share of semiconductor vendors from 2014-2018
This is a professionally designed visual chart for Market Share Of Semiconductor Vendors From 2014 to 2018. This is part of our Data and Statistics products selection, and you will need a Paid account to download the actual report with accurate data and sources. Downloaded report will contain the editable graph with accurate data, an excel table with the actual data, the exact source of the data and the release date. The slide shows the market share of key semiconductor vendors Samsung, Intel Broadcom Qualcomm Toshiba NXP etc from the years 2014 to 2018. Download it immediately and use it for your business.
-
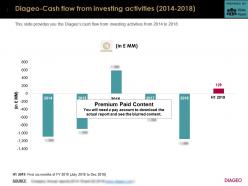 Diageo cash flow from investing activities 2014-2018
This is a professionally designed visual chart for Diageo Cash Flow From Investing Activities 2014 to 2018. This is part of our Data and Statistics products selection, and you will need a Paid account to download the actual report with accurate data and sources. Downloaded report will contain the editable graph with accurate data, an excel table with the actual data, the exact source of the data and the release date. This slide provides you the Diageos cash flow from investing activities from 2014 to 2018. Download it immediately and use it for your business.
-
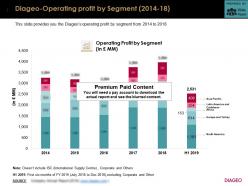 Diageo operating profit by segment 2014-18
This is a professionally designed visual chart for Diageo Operating Profit By Segment 2014 to 18. This is part of our Data and Statistics products selection, and you will need a Paid account to download the actual report with accurate data and sources. Downloaded report will contain the editable graph with accurate data, an excel table with the actual data, the exact source of the data and the release date. This slide provides you the Diageos operating profit by segment from 2014 to 2018. Download it immediately and use it for your business.
-
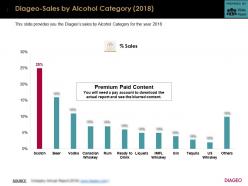 Diageo sales by alcohol category 2018
This is a professionally designed visual chart for Diageo Sales By Alcohol Category 2018. This is part of our Data and Statistics products selection, and you will need a Paid account to download the actual report with accurate data and sources. Downloaded report will contain the editable graph with accurate data, an excel table with the actual data, the exact source of the data and the release date. This slide provides you the Diageos sales by Alcohol Category for the year 2018. Download it immediately and use it for your business.
-
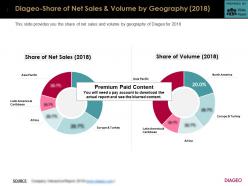 Diageo share of net sales and volume by geography 2018
This is a professionally designed visual chart for Diageo Share Of Net Sales And Volume By Geography 2018. This is part of our Data and Statistics products selection, and you will need a Paid account to download the actual report with accurate data and sources. Downloaded report will contain the editable graph with accurate data, an excel table with the actual data, the exact source of the data and the release date. This slide provides you the share of net sales and volume by geography of Diageo for 2018. Download it immediately and use it for your business.
-
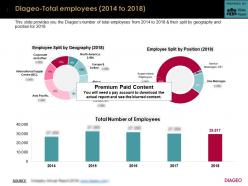 Diageo total employees 2014-2018
This is a professionally designed visual chart for Diageo Total Employees 2014 to 2018. This is part of our Data and Statistics products selection, and you will need a Paid account to download the actual report with accurate data and sources. Downloaded report will contain the editable graph with accurate data, an excel table with the actual data, the exact source of the data and the release date. This slide provides you the Diageos number of total employees from 2014 to 2018 and their split by geography and position for 2018. Download it immediately and use it for your business.
-
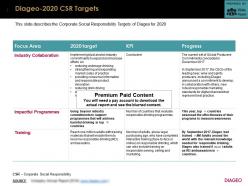 Diageo 2020 csr targets
The information presented in this slide has been researched by our team of professional business analysts. This is part of our Company Profiles products selection, and you will need a Paid account to download the actual report with accurate data and sources. Downloaded report will be in Powerpoint and will contain the actual editable slides with the actual data and sources for each data. This slide describes the Corporate Social Responsibility Targets of Diageo for 2020. Download it immediately and use it for your business.
-
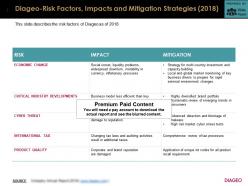 Diageo risk factors impacts and mitigation strategies 2018
The information presented in this slide has been researched by our team of professional business analysts. This is part of our Company Profiles products selection, and you will need a Paid account to download the actual report with accurate data and sources. Downloaded report will be in Powerpoint and will contain the actual editable slides with the actual data and sources for each data. This slide describes the risk factors of Diageo as of 2018. Download it immediately and use it for your business.
-
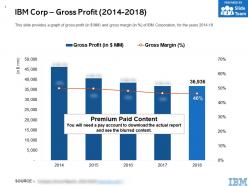 Ibm corp gross profit 2014-2018
This is a professionally designed visual chart for IBM Corp Gross Profit 2014 to 2018. This is part of our Data and Statistics products selection, and you will need a Paid account to download the actual report with accurate data and sources. Downloaded report will contain the editable graph with accurate data, an excel table with the actual data, the exact source of the data and the release date. This slide provides a graph of gross profit in JPY MM and gross margin in percent of IBM Corporation for the years 2014 to 18. Download it immediately and use it for your business.


