E-Commerce Data Statistics PowerPoint Templates, PowerPoint Statistics Slides
- Sub Categories
-
- Agriculture
- Chemicals and Resources
- Construction
- Consumer Goods and FMCG
- E-Commerce
- Energy and Environmental Services
- Finance Insurance and Real Estate
- Health and Pharmaceuticals
- Internet
- Life
- Media and Advertising
- Metals and Electronics
- Retail and Trade
- Services
- Society
- Sports and Recreation
- Survey
- Technology and Telecommunications
- Transportation and Logistics
- Travel Tourism and Hospitality
- USA
-
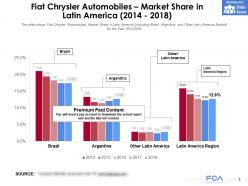 Fiat chrysler automobiles market share in latin america 2014-2018
This is a professionally designed visual chart for Fiat Chrysler Automobiles Market Share In Latin America 2014 to 2018. This is part of our Data and Statistics products selection, and you will need a Paid account to download the actual report with accurate data and sources. Downloaded report will contain the editable graph with accurate data, an excel table with the actual data, the exact source of the data and the release date. The slide shows Fiat Chrysler Automobiles Market Share in Latin America including Brazil, Argentina, and Other Latin America Market for the Year 2014 to 2018. Download it immediately and use it for your business.
-
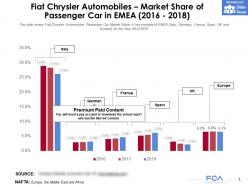 Fiat chrysler automobiles market share of passenger car in emea 2016-2018
This is a professionally designed visual chart for Fiat Chrysler Automobiles Market Share Of Passenger Car In EMEA 2016 to 2018. This is part of our Data and Statistics products selection, and you will need a Paid account to download the actual report with accurate data and sources. Downloaded report will contain the editable graph with accurate data, an excel table with the actual data, the exact source of the data and the release date. This slide shows Fiat Chrysler Automobiles Passenger Car Market Share in key markets of EMEA Italy, Germany, France, Spain, UK and Europe for the Year 2014 to 2018. Download it immediately and use it for your business.
-
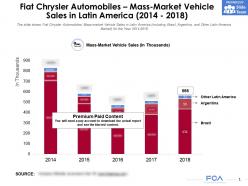 Fiat chrysler automobiles mass market vehicle sales in latin america 2014-2018
This is a professionally designed visual chart for Fiat Chrysler Automobiles Mass Market Vehicle Sales In Latin America 2014 to 2018. This is part of our Data and Statistics products selection, and you will need a Paid account to download the actual report with accurate data and sources. Downloaded report will contain the editable graph with accurate data, an excel table with the actual data, the exact source of the data and the release date. This slide shows Fiat Chrysler Automobiles Mass-market Vehicle Sales in Latin America including Brazil, Argentina, and Other Latin America Market for the Year 2014 to 2018. Download it immediately and use it for your business.
-
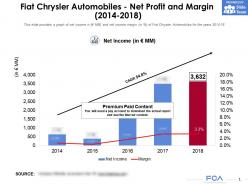 Fiat chrysler automobiles net profit and margin 2014-2018
This is a professionally designed visual chart for Fiat Chrysler Automobiles Net Profit And Margin 2014 to 2018. This is part of our Data and Statistics products selection, and you will need a Paid account to download the actual report with accurate data and sources. Downloaded report will contain the editable graph with accurate data, an excel table with the actual data, the exact source of the data and the release date. This slide provides a graph of net income in JPY MM and net income margin in percent of Fiat Chrysler Automobiles for the years 2014 to 18. Download it immediately and use it for your business.
-
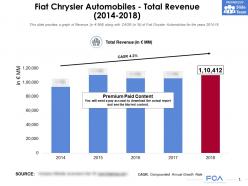 Fiat chrysler automobiles total revenue 2014-2018
This is a professionally designed visual chart for Fiat Chrysler Automobiles Total Revenue 2014 to 2018. This is part of our Data and Statistics products selection, and you will need a Paid account to download the actual report with accurate data and sources. Downloaded report will contain the editable graph with accurate data, an excel table with the actual data, the exact source of the data and the release date. This slide provides a graph of Revenue in JPY MM along with CAGR in percent of Fiat Chrysler Automobiles for the years 2014 to 18. Download it immediately and use it for your business.
-
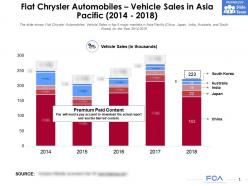 Fiat chrysler automobiles vehicle sales in asia pacific 2014-2018
This is a professionally designed visual chart for Fiat Chrysler Automobiles Vehicle Sales In Asia Pacific 2014 to 2018. This is part of our Data and Statistics products selection, and you will need a Paid account to download the actual report with accurate data and sources. Downloaded report will contain the editable graph with accurate data, an excel table with the actual data, the exact source of the data and the release date. The slide shows Fiat Chrysler Automobiles Vehicle Sales in top 5 major markets in Asia Pacific China, Japan, India, Australia, and South Korea for the Year 2014 to 2018. Download it immediately and use it for your business.
-
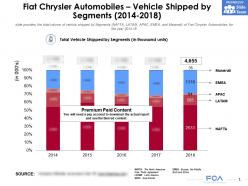 Fiat chrysler automobiles vehicle shipped by segments 2014-2018
This is a professionally designed visual chart for Fiat Chrysler Automobiles Vehicle Shipped By Segments 2014 to 2018. This is part of our Data and Statistics products selection, and you will need a Paid account to download the actual report with accurate data and sources. Downloaded report will contain the editable graph with accurate data, an excel table with the actual data, the exact source of the data and the release date. This slide provides the total volume of vehicle shipped by Segments NAFTA, LATAM, APAC, EMEA, and Maserati of Fiat Chrysler Automobiles, for the year 2014 to 18. Download it immediately and use it for your business.
-
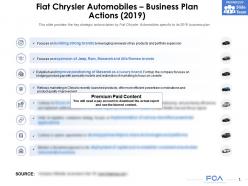 Fiat chrysler automobiles business plan actions 2019
The information presented in this slide has been researched by our team of professional business analysts. This is part of our Company Profiles products selection, and you will need a Paid account to download the actual report with accurate data and sources. Downloaded report will be in Powerpoint and will contain the actual editable slides with the actual data and sources for each data. This slide provides the key strategic actions taken by Fiat Chrysler Automobiles specific to its 2019 business plan. Download it immediately and use it for your business.
-
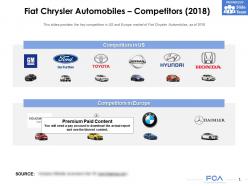 Fiat chrysler automobiles competitors 2018
The information presented in this slide has been researched by our team of professional business analysts. This is part of our Company Profiles products selection, and you will need a Paid account to download the actual report with accurate data and sources. Downloaded report will be in Powerpoint and will contain the actual editable slides with the actual data and sources for each data. This slides provides the key competitors in US and Europe market of Fiat Chrysler Automobiles as of 2018. Download it immediately and use it for your business.
-
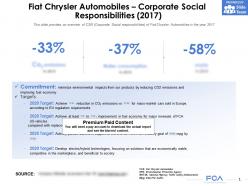 Fiat chrysler automobiles corporate social responsibilities 2017
The information presented in this slide has been researched by our team of professional business analysts. This is part of our Company Profiles products selection, and you will need a Paid account to download the actual report with accurate data and sources. Downloaded report will be in Powerpoint and will contain the actual editable slides with the actual data and sources for each data. This slide provides an overview of CSR Corporate Social responsibilities of Fiat Chrysler Automobiles in the year 2017. Download it immediately and use it for your business.
-
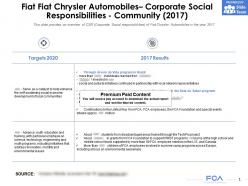 Fiat chrysler automobiles corporate social responsibilities community 2017
The information presented in this slide has been researched by our team of professional business analysts. This is part of our Company Profiles products selection, and you will need a Paid account to download the actual report with accurate data and sources. Downloaded report will be in Powerpoint and will contain the actual editable slides with the actual data and sources for each data. This slide provides an overview of CSR Corporate Social responsibilities of Fiat Chrysler Automobiles in the year 2017. Download it immediately and use it for your business.
-
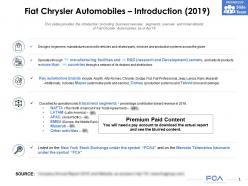 Fiat chrysler automobiles introduction 2019
The information presented in this slide has been researched by our team of professional business analysts. This is part of our Company Profiles products selection, and you will need a Paid account to download the actual report with accurate data and sources. Downloaded report will be in Powerpoint and will contain the actual editable slides with the actual data and sources for each data. This slides provides the introduction including business overview segments overview and ticker details of Fiat Chrysler Automobiles as of Apr 19. Download it immediately and use it for your business.
-
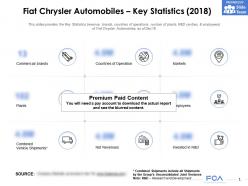 Fiat chrysler automobiles key statistics 2018
The information presented in this slide has been researched by our team of professional business analysts. This is part of our Company Profiles products selection, and you will need a Paid account to download the actual report with accurate data and sources. Downloaded report will be in Powerpoint and will contain the actual editable slides with the actual data and sources for each data. This slides provides the Key Statistics revenue brands countries of operations number of plants R and D centres and employees of Fiat Chrysler Automobiles as of Dec 18. Download it immediately and use it for your business.
-
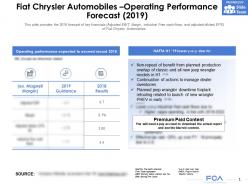 Fiat chrysler automobiles operating performance forecast 2019
The information presented in this slide has been researched by our team of professional business analysts. This is part of our Company Profiles products selection, and you will need a Paid account to download the actual report with accurate data and sources. Downloaded report will be in Powerpoint and will contain the actual editable slides with the actual data and sources for each data. This slide provides the 2019 forecast of key financials Adjusted EBIT Margin industrial Free cash flows and adjusted diluted EPS of Fiat Chrysler Automobiles. Download it immediately and use it for your business.
-
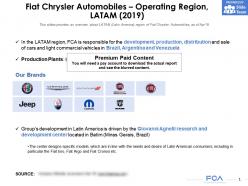 Fiat chrysler automobiles operating region latam 2019
The information presented in this slide has been researched by our team of professional business analysts. This is part of our Company Profiles products selection, and you will need a Paid account to download the actual report with accurate data and sources. Downloaded report will be in Powerpoint and will contain the actual editable slides with the actual data and sources for each data. This slides provides an overview about LATAM Latin America region of Fiat Chrysler Automobiles as of Apr 19. Download it immediately and use it for your business.
-
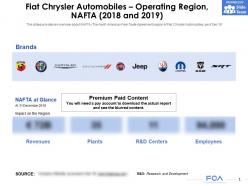 Fiat chrysler automobiles operating region nafta 2018-2019
The information presented in this slide has been researched by our team of professional business analysts. This is part of our Company Profiles products selection, and you will need a Paid account to download the actual report with accurate data and sources. Downloaded report will be in Powerpoint and will contain the actual editable slides with the actual data and sources for each data. This slides provides an overview about NAFTA The North American Free Trade Agreement region of Fiat Chrysler Automobiles as of Dec 18. Download it immediately and use it for your business.
-
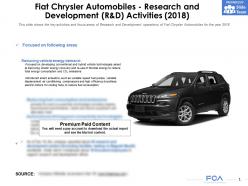 Fiat chrysler automobiles research and development r and d activities 2018
The information presented in this slide has been researched by our team of professional business analysts. This is part of our Company Profiles products selection, and you will need a Paid account to download the actual report with accurate data and sources. Downloaded report will be in Powerpoint and will contain the actual editable slides with the actual data and sources for each data. This slide shows the key activities and focus areas of Research and Development operations of Fiat Chrysler Automobiles for the year 2018. Download it immediately and use it for your business.
-
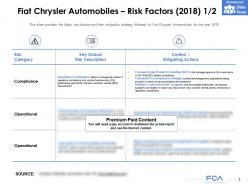 Fiat chrysler automobiles risk factors 2018
The information presented in this slide has been researched by our team of professional business analysts. This is part of our Company Profiles products selection, and you will need a Paid account to download the actual report with accurate data and sources. Downloaded report will be in Powerpoint and will contain the actual editable slides with the actual data and sources for each data. This slide provides the Major risk factors and their mitigation strategy followed by Fiat Chrysler Automobiles for the year 2018. Download it immediately and use it for your business.
-
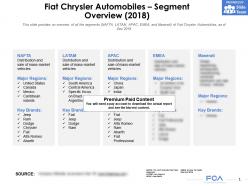 Fiat chrysler automobiles segment overview 2018
The information presented in this slide has been researched by our team of professional business analysts. This is part of our Company Profiles products selection, and you will need a Paid account to download the actual report with accurate data and sources. Downloaded report will be in Powerpoint and will contain the actual editable slides with the actual data and sources for each data. This slide provides an overview of all the segments NAFTA LATAM APAC EMEA and Maserati of Fiat Chrysler Automobiles as of Dec 2018. Download it immediately and use it for your business.
-
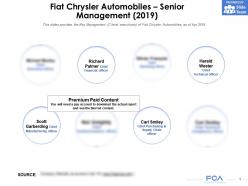 Fiat chrysler automobiles senior management 2019
The information presented in this slide has been researched by our team of professional business analysts. This is part of our Company Profiles products selection, and you will need a Paid account to download the actual report with accurate data and sources. Downloaded report will be in Powerpoint and will contain the actual editable slides with the actual data and sources for each data. This slides provides the Key Management C level executives of Fiat Chrysler Automobiles as of Apr 2019. Download it immediately and use it for your business.
-
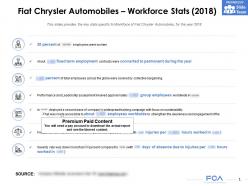 Fiat chrysler automobiles workforce stats 2018
The information presented in this slide has been researched by our team of professional business analysts. This is part of our Company Profiles products selection, and you will need a Paid account to download the actual report with accurate data and sources. Downloaded report will be in Powerpoint and will contain the actual editable slides with the actual data and sources for each data. This slides provides the key stats specific to Workforce of Fiat Chrysler Automobiles for the year 2018. Download it immediately and use it for your business.
-
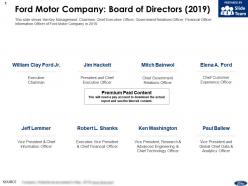 Ford motor company board of directors 2019
The information presented in this slide has been researched by our team of professional business analysts. This is part of our Company Profiles products selection, and you will need a Paid account to download the actual report with accurate data and sources. Downloaded report will be in Powerpoint and will contain the actual editable slides with the actual data and sources for each data. This slide shows the Key Management, Chairman, Chief Executive Officer, Government Relations Officer, Financial Officer, Information Officer of Ford Motor Company in 2019. Download it immediately and use it for your business.
-
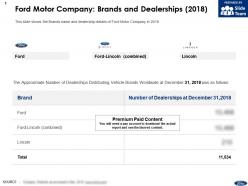 Ford motor company brands and dealerships 2018
The information presented in this slide has been researched by our team of professional business analysts. This is part of our Company Profiles products selection, and you will need a Paid account to download the actual report with accurate data and sources. Downloaded report will be in Powerpoint and will contain the actual editable slides with the actual data and sources for each data. This slide shows the Brands name and dealership details of Ford Motor Company in 2018. Download it immediately and use it for your business.
-
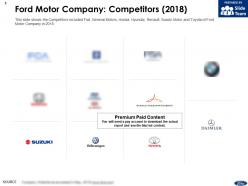 Ford motor company competitors 2018
The information presented in this slide has been researched by our team of professional business analysts. This is part of our Company Profiles products selection, and you will need a Paid account to download the actual report with accurate data and sources. Downloaded report will be in Powerpoint and will contain the actual editable slides with the actual data and sources for each data. This slide shows the Competitors included Fiat, General Motors, Honda, Hyundai, Renault, Suzuki Motor and Toyota of Ford Motor Company in 2018. Download it immediately and use it for your business.
-
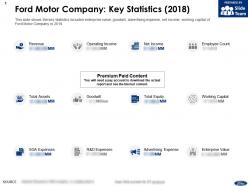 Ford motor company key statistics 2018
The information presented in this slide has been researched by our team of professional business analysts. This is part of our Company Profiles products selection, and you will need a Paid account to download the actual report with accurate data and sources. Downloaded report will be in Powerpoint and will contain the actual editable slides with the actual data and sources for each data. This slide shows the key statistics included enterprise value, goodwill, advertising expense, net income, working capital of Ford Motor Company in 2018. Download it immediately and use it for your business.
-
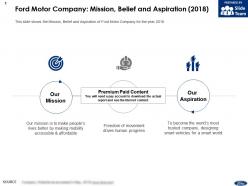 Ford motor company mission belief and aspiration 2018
The information presented in this slide has been researched by our team of professional business analysts. This is part of our Company Profiles products selection, and you will need a Paid account to download the actual report with accurate data and sources. Downloaded report will be in Powerpoint and will contain the actual editable slides with the actual data and sources for each data. This slide shows the Mission, Belief and Aspiration of Ford Motor Company for the year 2018. Download it immediately and use it for your business.
-
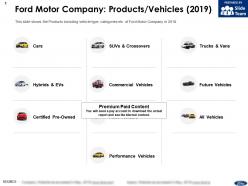 Ford motor company products vehicles 2019
The information presented in this slide has been researched by our team of professional business analysts. This is part of our Company Profiles products selection, and you will need a Paid account to download the actual report with accurate data and sources. Downloaded report will be in Powerpoint and will contain the actual editable slides with the actual data and sources for each data. This slide shows the Products including vehicle type, categories etc. of Ford Motor Company in 2019. Download it immediately and use it for your business.
-
 Ford motor company properties 2018
The information presented in this slide has been researched by our team of professional business analysts. This is part of our Company Profiles products selection, and you will need a Paid account to download the actual report with accurate data and sources. Downloaded report will be in Powerpoint and will contain the actual editable slides with the actual data and sources for each data. This slide shows the plants by region of automotive business units of Ford Motor Company in 2018. Download it immediately and use it for your business.
-
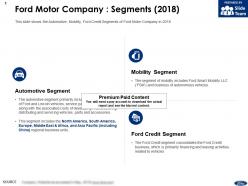 Ford motor company segments 2018
The information presented in this slide has been researched by our team of professional business analysts. This is part of our Company Profiles products selection, and you will need a Paid account to download the actual report with accurate data and sources. Downloaded report will be in Powerpoint and will contain the actual editable slides with the actual data and sources for each data. This slide shows the Automotive, Mobility, Ford Credit Segments of Ford Motor Company in 2018. Download it immediately and use it for your business.
-
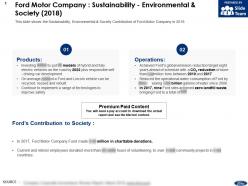 Ford motor company sustainability environmental and society 2018
The information presented in this slide has been researched by our team of professional business analysts. This is part of our Company Profiles products selection, and you will need a Paid account to download the actual report with accurate data and sources. Downloaded report will be in Powerpoint and will contain the actual editable slides with the actual data and sources for each data. This slide shows the Sustainability, Environmental and Society Contribution of Ford Motor Company in 2018. Download it immediately and use it for your business.
-
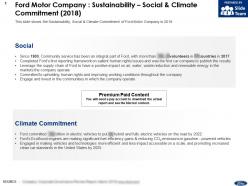 Ford motor company sustainability social and climate commitment 2018
The information presented in this slide has been researched by our team of professional business analysts. This is part of our Company Profiles products selection, and you will need a Paid account to download the actual report with accurate data and sources. Downloaded report will be in Powerpoint and will contain the actual editable slides with the actual data and sources for each data. This slide shows the Sustainability, Social and Climate Commitment of Ford Motor Company in 2018. Download it immediately and use it for your business.
-
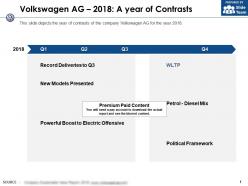 Volkswagen ag 2018 a year of contrasts
The information presented in this slide has been researched by our team of professional business analysts. This is part of our Company Profiles products selection, and you will need a Paid account to download the actual report with accurate data and sources. Downloaded report will be in Powerpoint and will contain the actual editable slides with the actual data and sources for each data. This slide depicts the year of contrasts of the company Volkswagen AG for the year 2018. Download it immediately and use it for your business.
-
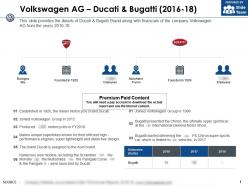 Volkswagen ag ducati and bugatti 2016-18
The information presented in this slide has been researched by our team of professional business analysts. This is part of our Company Profiles products selection, and you will need a Paid account to download the actual report with accurate data and sources. Downloaded report will be in Powerpoint and will contain the actual editable slides with the actual data and sources for each data. This slide provides the details of Ducati and Bugatti Brand along with financials of the company Volkswagen AG from the years 2016 to 18. Download it immediately and use it for your business.
-
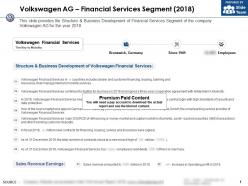 Volkswagen ag financial services segment 2018
The information presented in this slide has been researched by our team of professional business analysts. This is part of our Company Profiles products selection, and you will need a Paid account to download the actual report with accurate data and sources. Downloaded report will be in Powerpoint and will contain the actual editable slides with the actual data and sources for each data. This slide provides the Structure and Business Development of Financial Services Segment of the company Volkswagen AG for the year 2018. Download it immediately and use it for your business.
-
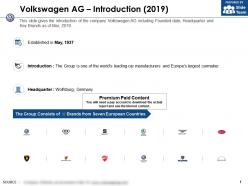 Volkswagen ag introduction 2019
The information presented in this slide has been researched by our team of professional business analysts. This is part of our Company Profiles products selection, and you will need a Paid account to download the actual report with accurate data and sources. Downloaded report will be in Powerpoint and will contain the actual editable slides with the actual data and sources for each data. This slide gives the introduction of the company Volkswagen AG including Founded date, Headquarter and Key Brands as of Mar 2019. Download it immediately and use it for your business.
-
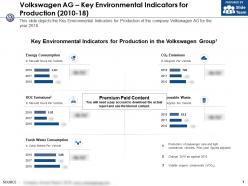 Volkswagen ag key environmental indicators for production 2010-18
The information presented in this slide has been researched by our team of professional business analysts. This is part of our Company Profiles products selection, and you will need a Paid account to download the actual report with accurate data and sources. Downloaded report will be in Powerpoint and will contain the actual editable slides with the actual data and sources for each data. This slide depicts the Key Environmental Indicators for Production of the company Volkswagen AG for the year 2018. Download it immediately and use it for your business.
-
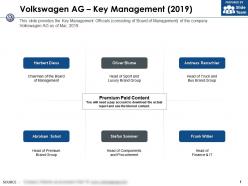 Volkswagen ag key management 2019
The information presented in this slide has been researched by our team of professional business analysts. This is part of our Company Profiles products selection, and you will need a Paid account to download the actual report with accurate data and sources. Downloaded report will be in Powerpoint and will contain the actual editable slides with the actual data and sources for each data. This slide provides the Key Management Officials consisting of Board of Management of the company Volkswagen AG as of Mar 2019. Download it immediately and use it for your business.
-
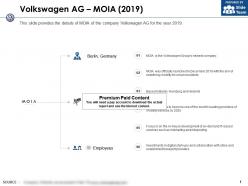 Volkswagen ag moia 2019
The information presented in this slide has been researched by our team of professional business analysts. This is part of our Company Profiles products selection, and you will need a Paid account to download the actual report with accurate data and sources. Downloaded report will be in Powerpoint and will contain the actual editable slides with the actual data and sources for each data. This slide provides the details of MOIA of the company Volkswagen AG for the year 2019. Download it immediately and use it for your business.
-
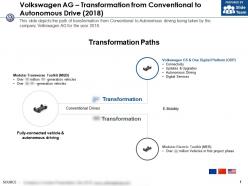 Volkswagen ag transformation from conventional to autonomous drive 2018
The information presented in this slide has been researched by our team of professional business analysts. This is part of our Company Profiles products selection, and you will need a Paid account to download the actual report with accurate data and sources. Downloaded report will be in Powerpoint and will contain the actual editable slides with the actual data and sources for each data. This slide depicts the path of transformation from Conventional to Autonomous driving being taken by the company Volkswagen AG for the year 2018. Download it immediately and use it for your business.
-
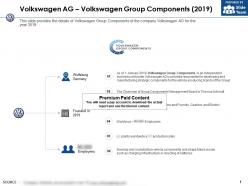 Volkswagen ag volkswagen group components 2019
The information presented in this slide has been researched by our team of professional business analysts. This is part of our Company Profiles products selection, and you will need a Paid account to download the actual report with accurate data and sources. Downloaded report will be in Powerpoint and will contain the actual editable slides with the actual data and sources for each data. This slide provides the details of Volkswagen Group Components of the company Volkswagen AG for the year 2019. Download it immediately and use it for your business.
-
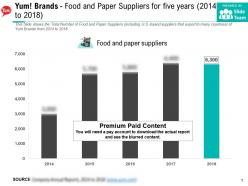 Yum brands food and paper suppliers for five years 2014-2018
This is a professionally designed visual chart for Yum Brands Food And Paper Suppliers For Five Years 2014 to 2018. This is part of our Data and Statistics products selection, and you will need a Paid account to download the actual report with accurate data and sources. Downloaded report will contain the editable graph with accurate data, an excel table with the actual data, the exact source of the data and the release date. This Slide shows the Total Number of Food and Paper Suppliers including U.S based suppliers that export to many countries of Yum Brands from 2014 to 2018 . Download it immediately and use it for your business.
-
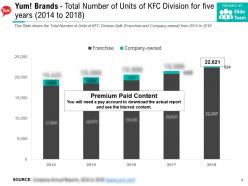 Yum brands total number of units of kfc division for five years 2014-2018
This is a professionally designed visual chart for Yum Brands Total Number Of Units Of KFC Division For Five Years 2014 to 2018. This is part of our Data and Statistics products selection, and you will need a Paid account to download the actual report with accurate data and sources. Downloaded report will contain the editable graph with accurate data, an excel table with the actual data, the exact source of the data and the release date. This Slide shows the Total Number of Units of KFC Division Split Franchise and Company owned from 2014 to 2018. Download it immediately and use it for your business.
-
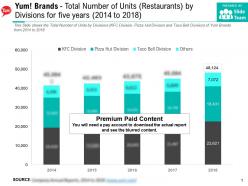 Yum brands total number of units restaurants by divisions for five years 2014-2018
This is a professionally designed visual chart for Yum Brands Total Number Of Units Restaurants By Divisions For Five Years 2014 to 2018. This is part of our Data and Statistics products selection, and you will need a Paid account to download the actual report with accurate data and sources. Downloaded report will contain the editable graph with accurate data, an excel table with the actual data, the exact source of the data and the release date. This Slide shows the Total Number of Units by Divisions KFC Division, Pizza Hut Division and Taco Bell Division of Yum Brands from 2014 to 2018. Download it immediately and use it for your business.
-
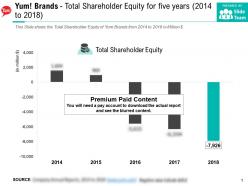 Yum brands total shareholder equity for five years 2014-2018
This is a professionally designed visual chart for Yum Brands Total Shareholder Equity For Five Years 2014 to 2018. This is part of our Data and Statistics products selection, and you will need a Paid account to download the actual report with accurate data and sources. Downloaded report will contain the editable graph with accurate data, an excel table with the actual data, the exact source of the data and the release date. This Slide shows the Total Shareholder Equity of Yum Brands from 2014 to 2018 in Million JPY. Download it immediately and use it for your business.
-
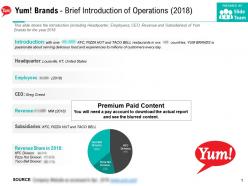 Yum brands brief introduction of operations 2018
The information presented in this slide has been researched by our team of professional business analysts. This is part of our Company Profiles products selection, and you will need a Paid account to download the actual report with accurate data and sources. Downloaded report will be in Powerpoint and will contain the actual editable slides with the actual data and sources for each data. This slide shows the Introduction including Headquarter, Employees, CEO, Revenue and Subsidiaries of Yum Brands for the year 2018. Download it immediately and use it for your business.
-
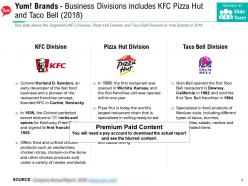 Yum brands business divisions includes kfc pizza hut and taco bell 2018
The information presented in this slide has been researched by our team of professional business analysts. This is part of our Company Profiles products selection, and you will need a Paid account to download the actual report with accurate data and sources. Downloaded report will be in Powerpoint and will contain the actual editable slides with the actual data and sources for each data. This slide shows the Segments KFC Division, Pizza Hut Division and Taco Bell Division of Yum Brands in 2018. Download it immediately and use it for your business.
-
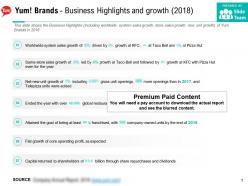 Yum brands business highlights and growth 2018
The information presented in this slide has been researched by our team of professional business analysts. This is part of our Company Profiles products selection, and you will need a Paid account to download the actual report with accurate data and sources. Downloaded report will be in Powerpoint and will contain the actual editable slides with the actual data and sources for each data. This slide shows the Business Highlights Including worldwide system sales growth, store sales growth, new unit growth of Yum Brands in 2018. Download it immediately and use it for your business.
-
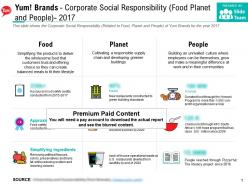 Yum brands corporate social responsibility food planet and people 2017
The information presented in this slide has been researched by our team of professional business analysts. This is part of our Company Profiles products selection, and you will need a Paid account to download the actual report with accurate data and sources. Downloaded report will be in Powerpoint and will contain the actual editable slides with the actual data and sources for each data. This slide shows the Corporate Social Responsibility Related to Food, Planet and People of Yum Brands for the year 2017. Download it immediately and use it for your business.
-
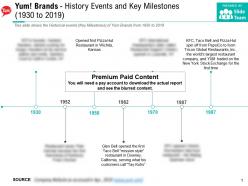 Yum brands history events and key milestones 1930-2019
The information presented in this slide has been researched by our team of professional business analysts. This is part of our Company Profiles products selection, and you will need a Paid account to download the actual report with accurate data and sources. Downloaded report will be in Powerpoint and will contain the actual editable slides with the actual data and sources for each data. This slide shows the Historical events Key Milestones of Yum Brands from 1930 to 2019. Download it immediately and use it for your business.
-
 Yum brands major brands kfc pizza hut and taco bell 2018
The information presented in this slide has been researched by our team of professional business analysts. This is part of our Company Profiles products selection, and you will need a Paid account to download the actual report with accurate data and sources. Downloaded report will be in Powerpoint and will contain the actual editable slides with the actual data and sources for each data. This slide shows the Brands details Kentucky Fried Chicken, Pizza Hut and Taco Bell of Yum Brands in 2018. Download it immediately and use it for your business.
-
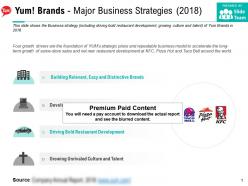 Yum brands major business strategies 2018
The information presented in this slide has been researched by our team of professional business analysts. This is part of our Company Profiles products selection, and you will need a Paid account to download the actual report with accurate data and sources. Downloaded report will be in Powerpoint and will contain the actual editable slides with the actual data and sources for each data. This slide shows the Business strategy including driving bold restaurant development, growing culture and talent of Yum Brands in 2018. Download it immediately and use it for your business.
-
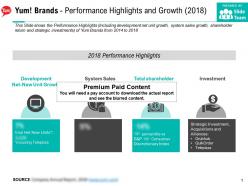 Yum brands performance highlights and growth 2018
The information presented in this slide has been researched by our team of professional business analysts. This is part of our Company Profiles products selection, and you will need a Paid account to download the actual report with accurate data and sources. Downloaded report will be in Powerpoint and will contain the actual editable slides with the actual data and sources for each data. This Slide shows the Performance Highlights Including development net unit growth, system sales growth, shareholder return and strategic investments of Yum Brands from 2014 to 2018. Download it immediately and use it for your business.
-
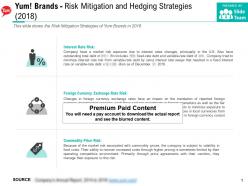 Yum brands risk mitigation and hedging strategies 2018
The information presented in this slide has been researched by our team of professional business analysts. This is part of our Company Profiles products selection, and you will need a Paid account to download the actual report with accurate data and sources. Downloaded report will be in Powerpoint and will contain the actual editable slides with the actual data and sources for each data. This slide shows the Risk Mitigation Strategies of Yum Brands in 2018. Download it immediately and use it for your business.
-
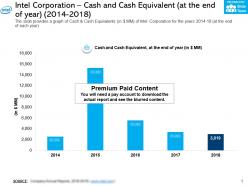 Intel corporation cash and cash equivalent at the end of year 2014-2018
This is a professionally designed visual chart for Intel Corporation Cash And Cash Equivalent At The End Of Year 2014 to 2018. This is part of our Data and Statistics products selection, and you will need a Paid account to download the actual report with accurate data and sources. Downloaded report will contain the editable graph with accurate data, an excel table with the actual data, the exact source of the data and the release date. The slide provides a graph of Cash and Cash Equivalents in JPY MM of Intel Corporation for the years 2014 to 18 at the end of each year. Download it immediately and use it for your business.
-
 Intel corporation china revenue 2014-2018
This is a professionally designed visual chart for Intel Corporation China Revenue 2014 to 2018. This is part of our Data and Statistics products selection, and you will need a Paid account to download the actual report with accurate data and sources. Downloaded report will contain the editable graph with accurate data, an excel table with the actual data, the exact source of the data and the release date. This slide provides a graph of Revenue in JPY MM of Intel Corporation from China including Hong Kong region for the years 2014 to 2018. Download it immediately and use it for your business.
-
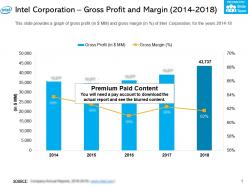 Intel corporation gross profit and margin 2014-2018
This is a professionally designed visual chart for Intel Corporation Gross Profit And Margin 2014 to 2018. This is part of our Data and Statistics products selection, and you will need a Paid account to download the actual report with accurate data and sources. Downloaded report will contain the editable graph with accurate data, an excel table with the actual data, the exact source of the data and the release date. This slide provides a graph of gross profit in JPY MM and gross margin in Percentage of Intel Corporation for the years 2014 to 18. Download it immediately and use it for your business.
-
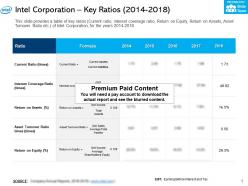 Intel corporation key ratios 2014-2018
This is a professionally designed visual chart for Intel Corporation Key Ratios 2014 to 2018. This is part of our Data and Statistics products selection, and you will need a Paid account to download the actual report with accurate data and sources. Downloaded report will contain the editable graph with accurate data, an excel table with the actual data, the exact source of the data and the release date. This slide provides a table of key ratios Current ratio interest coverage ratio Return on Equity Return on Assets Asset Turnover Ratio etc of Intel Corporation for the years 2014 to 2018. Download it immediately and use it for your business.
-
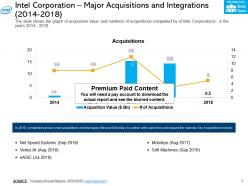 Intel corporation major acquisitions and integrations 2014-2018
This is a professionally designed visual chart for Intel Corporation Major Acquisitions And Integrations 2014 to 2018. This is part of our Data and Statistics products selection, and you will need a Paid account to download the actual report with accurate data and sources. Downloaded report will contain the editable graph with accurate data, an excel table with the actual data, the exact source of the data and the release date. The slide shows the graph of acquisition value and numbers of acquisitions completed by of Intel Corporations in the years 2014 to 2018. Download it immediately and use it for your business.
-
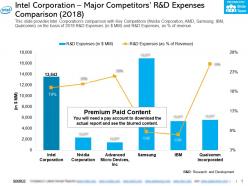 Intel corporation major competitors r and d expenses comparison 2018
This is a professionally designed visual chart for Intel Corporation Major Competitors R And D Expenses Comparison 2018. This is part of our Data and Statistics products selection, and you will need a Paid account to download the actual report with accurate data and sources. Downloaded report will contain the editable graph with accurate data, an excel table with the actual data, the exact source of the data and the release date. This slide provides Intel Corporations comparison with Key Competitors Nvidia Corporation AMD Samsung IBM Qualcomm on the basis of 2018 R and D Expenses in JPY MM and R and D Expenses as Percentage of revenue. Download it immediately and use it for your business.
-
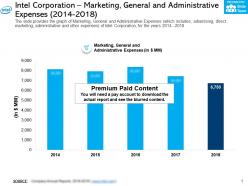 Intel corporation marketing general and administrative expenses 2014-2018
This is a professionally designed visual chart for Intel Corporation Marketing General And Administrative Expenses 2014 to 2018. This is part of our Data and Statistics products selection, and you will need a Paid account to download the actual report with accurate data and sources. Downloaded report will contain the editable graph with accurate data, an excel table with the actual data, the exact source of the data and the release date. The slide provides the graph of Marketing General and Administrative Expenses which includes advertising direct marketing administrative and other expenses of Intel Corporation for the years 2014 to 2018. Download it immediately and use it for your business.


