E-Commerce Data Statistics PowerPoint Templates, PowerPoint Statistics Slides
- Sub Categories
-
- Agriculture
- Chemicals and Resources
- Construction
- Consumer Goods and FMCG
- E-Commerce
- Energy and Environmental Services
- Finance Insurance and Real Estate
- Health and Pharmaceuticals
- Internet
- Life
- Media and Advertising
- Metals and Electronics
- Retail and Trade
- Services
- Society
- Sports and Recreation
- Survey
- Technology and Telecommunications
- Transportation and Logistics
- Travel Tourism and Hospitality
- USA
-
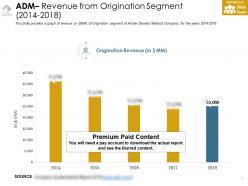 Adm revenue from origination segment 2014-2018
This is a professionally designed visual chart for Adm Revenue From Origination Segment 2014 to 2018. This is part of our Data and Statistics products selection, and you will need a Paid account to download the actual report with accurate data and sources. Downloaded report will contain the editable graph with accurate data, an excel table with the actual data, the exact source of the data and the release date. This slide provides a graph of revenue in JPY MM of Origination segment of Archer Daniels Midland Company for the years 2014 to 2018. Download it immediately and use it for your business.
-
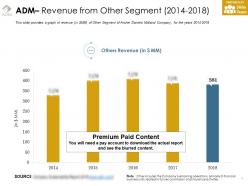 Adm revenue from other segment 2014-2018
This is a professionally designed visual chart for Adm Revenue From Other Segment 2014 to 2018. This is part of our Data and Statistics products selection, and you will need a Paid account to download the actual report with accurate data and sources. Downloaded report will contain the editable graph with accurate data, an excel table with the actual data, the exact source of the data and the release date. This slide provides a graph of revenue in JPY MM of Other Segment of Archer Daniels Midland Company for the years 2014 to 2018. Download it immediately and use it for your business.
-
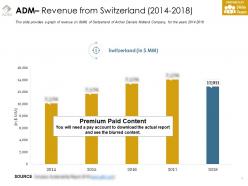 Adm revenue from switzerland 2014-2018
This is a professionally designed visual chart for Adm Revenue From Switzerland 2014 to 2018. This is part of our Data and Statistics products selection, and you will need a Paid account to download the actual report with accurate data and sources. Downloaded report will contain the editable graph with accurate data, an excel table with the actual data, the exact source of the data and the release date.This slide provides a graph of revenue in JPY MM of Switzerland of Archer Daniels Midland Company for the years 2014 to 2018. Download it immediately and use it for your business.
-
 Adm revenue from united states 2014-2018
This is a professionally designed visual chart for Adm Revenue From United States 2014 to 2018. This is part of our Data and Statistics products selection, and you will need a Paid account to download the actual report with accurate data and sources. Downloaded report will contain the editable graph with accurate data, an excel table with the actual data, the exact source of the data and the release date. This slide provides a graph of revenue in JPY MM of United States of Archer Daniels Midland Company for the years 2014 to 2018. Download it immediately and use it for your business.
-
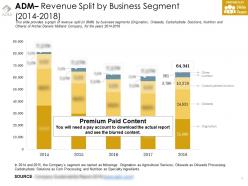 Adm revenue split by business segment 2014-2018
This is a professionally designed visual chart for Adm Revenue Split By Business Segment 2014 to 2018. This is part of our Data and Statistics products selection, and you will need a Paid account to download the actual report with accurate data and sources. Downloaded report will contain the editable graph with accurate data, an excel table with the actual data, the exact source of the data and the release date. This slide provides a graph of revenue split in JPY MM by business segments Origination, Oilseeds, Carbohydrate Solutions, Nutrition and Others of Archer Daniels Midland Company for the years 2014 to 2018. Download it immediately and use it for your business.
-
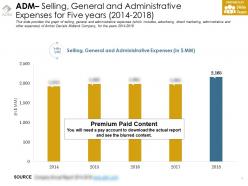 Adm selling general and administrative expenses for five years 2014-2018
This is a professionally designed visual chart for Adm Selling General And Administrative Expenses For Five Years 2014 to 2018. This is part of our Data and Statistics products selection, and you will need a Paid account to download the actual report with accurate data and sources. Downloaded report will contain the editable graph with accurate data, an excel table with the actual data, the exact source of the data and the release date. This slide provides the graph of selling, general and administrative expenses which includes, advertising, direct marketing, administrative and other expenses of Archer Daniels Midland Company for the years 2014 to 2018. Download it immediately and use it for your business.
-
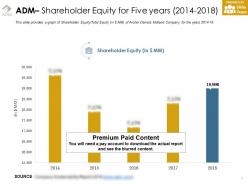 Adm shareholder equity for five years 2014-2018
This is a professionally designed visual chart for Adm Shareholder Equity For Five Years 2014-2018. This is part of our Data and Statistics products selection, and you will need a Paid account to download the actual report with accurate data and sources. Downloaded report will contain the editable graph with accurate data, an excel table with the actual data, the exact source of the data and the release date. This slide provides a graph of Shareholder Equity Total Equity in JPY MM of Archer Daniels Midland Company for the years 2014 to 18. Download it immediately and use it for your business.
-
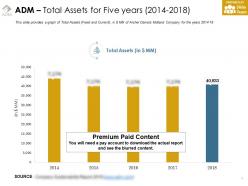 Adm total assets for five years 2014-2018
This is a professionally designed visual chart for Adm Total Assets For Five Years 2014 to 2018. This is part of our Data and Statistics products selection, and you will need a Paid account to download the actual report with accurate data and sources. Downloaded report will contain the editable graph with accurate data, an excel table with the actual data, the exact source of the data and the release date. This slide provides a graph of Total Assets Fixed and Current in JPY MM of Archer Daniels Midland Company for the years 2014 to 18. Download it immediately and use it for your business.
-
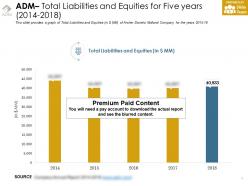 Adm total liabilities and equities for five years 2014-2018
This is a professionally designed visual chart for Adm Total Liabilities And Equities For Five Years 2014 to 2018. This is part of our Data and Statistics products selection, and you will need a Paid account to download the actual report with accurate data and sources. Downloaded report will contain the editable graph with accurate data, an excel table with the actual data, the exact source of the data and the release date. This slide provides a graph of Total Liabilities and Equities in JPY MM of Archer Daniels Midland Company for the years 2014 to 18. Download it immediately and use it for your business.
-
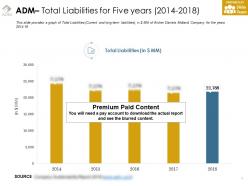 Adm total liabilities for five years 2014-2018
This is a professionally designed visual chart for Adm Total Liabilities For Five Years 2014 to 2018. This is part of our Data and Statistics products selection, and you will need a Paid account to download the actual report with accurate data and sources. Downloaded report will contain the editable graph with accurate data, an excel table with the actual data, the exact source of the data and the release date. This slide provides a graph of Total Liabilities Current and long term liabilities in JPY MM of Archer Daniels Midland Company for the years 2014 to 18. Download it immediately and use it for your business.
-
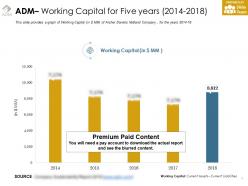 Adm working capital for five years 2014-2018
This is a professionally designed visual chart for Adm Working Capital For Five Years 2014 to 2018. This is part of our Data and Statistics products selection, and you will need a Paid account to download the actual report with accurate data and sources. Downloaded report will contain the editable graph with accurate data, an excel table with the actual data, the exact source of the data and the release date. This slide provides a graph of Working Capital in JPY MM of Archer Daniels Midland Company for the years 2014 to 18. Download it immediately and use it for your business.
-
 Anthem administrative fees and other revenue 2014-2018
This is a professionally designed visual chart for Anthem Administrative Fees And Other Revenue 2014 to 2018. This is part of our Data and Statistics products selection, and you will need a Paid account to download the actual report with accurate data and sources. Downloaded report will contain the editable graph with accurate data, an excel table with the actual data, the exact source of the data and the release date. This slide shows the Total Administrative fees and other revenue of Anthem Inc. from 2014 to 2018 In Million JPY. Download it immediately and use it for your business.
-
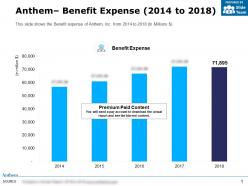 Anthem benefit expense 2014-2018
This is a professionally designed visual chart for Anthem Benefit Expense 2014 to 2018. This is part of our Data and Statistics products selection, and you will need a Paid account to download the actual report with accurate data and sources. Downloaded report will contain the editable graph with accurate data, an excel table with the actual data, the exact source of the data and the release date. This slide shows the Benefit expense of Anthem Inc. from 2014 to 2018 In Millions JPY. Download it immediately and use it for your business.
-
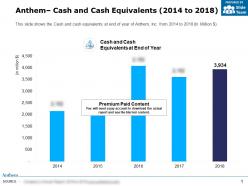 Anthem cash and cash equivalents 2014-2018
This is a professionally designed visual chart for Anthem Cash And Cash Equivalents 2014 to 2018. This is part of our Data and Statistics products selection, and you will need a Paid account to download the actual report with accurate data and sources. Downloaded report will contain the editable graph with accurate data, an excel table with the actual data, the exact source of the data and the release date. This slide shows the Cash and cash equivalents at end of year of Anthem Inc. from 2014 to 2018 In Million JPY. Download it immediately and use it for your business.
-
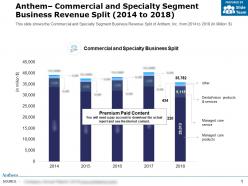 Anthem commercial and specialty segment business revenue split 2014-2018
This is a professionally designed visual chart for Anthem Commercial And Specialty Segment Business Revenue Split 2014 to 2018. This is part of our Data and Statistics products selection, and you will need a Paid account to download the actual report with accurate data and sources. Downloaded report will contain the editable graph with accurate data, an excel table with the actual data, the exact source of the data and the release date. This slide shows the Commercial and Specialty Segment Business Revenue Split of Anthem Inc. from 2014 to 2018 In Million JPY. Download it immediately and use it for your business.
-
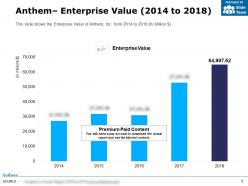 Anthem enterprise value 2014-2018
This is a professionally designed visual chart for Anthem Enterprise Value 2014 to 2018. This is part of our Data and Statistics products selection, and you will need a Paid account to download the actual report with accurate data and sources. Downloaded report will contain the editable graph with accurate data, an excel table with the actual data, the exact source of the data and the release date. This slide shows the Enterprise Value of Anthem Inc. from 2014 to 2018 In Million JPY. Download it immediately and use it for your business.
-
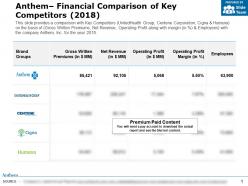 Anthem financial comparison of key competitors 2018
This is a professionally designed visual chart for Anthem Financial Comparison Of Key Competitors 2018. This is part of our Data and Statistics products selection, and you will need a Paid account to download the actual report with accurate data and sources. Downloaded report will contain the editable graph with accurate data, an excel table with the actual data, the exact source of the data and the release date. This slide provides a comparison with Key Competitors UnitedHealth Group, Centene Corporation, Cigna and Humana on the basis of Gross Written Premiums, Net Revenue, Operating Profit along with margin in Percentage and Employees with the company Anthem Inc. for the year 2018. Download it immediately and use it for your business.
-
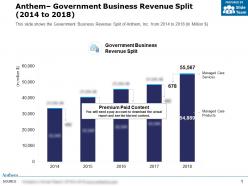 Anthem government business revenue split 2014-2018
This is a professionally designed visual chart for Anthem Government Business Revenue Split 2014 to 2018. This is part of our Data and Statistics products selection, and you will need a Paid account to download the actual report with accurate data and sources. Downloaded report will contain the editable graph with accurate data, an excel table with the actual data, the exact source of the data and the release date. This slide shows the Government Business Revenue Split of Anthem Inc. from 2014 to 2018 In Million JPY. Download it immediately and use it for your business.
-
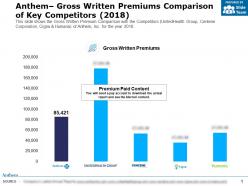 Anthem gross written premiums comparison of key competitors 2018
This is a professionally designed visual chart for Anthem Gross Written Premiums Comparison Of Key Competitors 2018. This is part of our Data and Statistics products selection, and you will need a Paid account to download the actual report with accurate data and sources. Downloaded report will contain the editable graph with accurate data, an excel table with the actual data, the exact source of the data and the release date. This slide shows the Gross Written Premium Comparison with the Competitors UnitedHealth Group, Centene Corporation, Cigna and Humana of Anthem Inc. for the year 2018. Download it immediately and use it for your business.
-
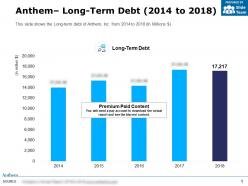 Anthem long term debt 2014-2018
This is a professionally designed visual chart for Anthem Long Term Debt 2014 to 2018. This is part of our Data and Statistics products selection, and you will need a Paid account to download the actual report with accurate data and sources. Downloaded report will contain the editable graph with accurate data, an excel table with the actual data, the exact source of the data and the release date. This slide shows the Long-term debt of Anthem Inc. from 2014 to 2018 In Millions JPY. Download it immediately and use it for your business.
-
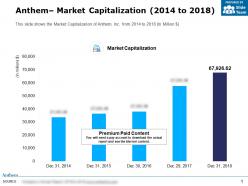 Anthem market capitalization 2014-2018
This is a professionally designed visual chart for Anthem Market Capitalization 2014 to 2018. This is part of our Data and Statistics products selection, and you will need a Paid account to download the actual report with accurate data and sources. Downloaded report will contain the editable graph with accurate data, an excel table with the actual data, the exact source of the data and the release date. This slide shows the Market Capitalization of Anthem Inc. from 2014 to 2018 In Million JPY. Download it immediately and use it for your business.
-
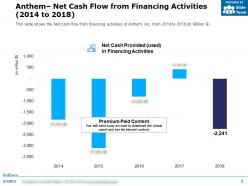 Anthem net cash flow from financing activities 2014-2018
This is a professionally designed visual chart for Anthem Net Cash Flow From Financing Activities 2014 to 2018. This is part of our Data and Statistics products selection, and you will need a Paid account to download the actual report with accurate data and sources. Downloaded report will contain the editable graph with accurate data, an excel table with the actual data, the exact source of the data and the release date. This slide shows the Net cash flow from financing activities of Anthem Inc. from 2014 to 2018 In Million JPY. Download it immediately and use it for your business.
-
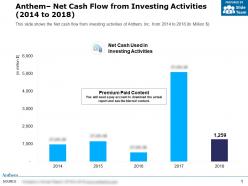 Anthem net cash flow from investing activities 2014-2018
This is a professionally designed visual chart for Anthem Net Cash Flow From Investing Activities 2014 to 2018. This is part of our Data and Statistics products selection, and you will need a Paid account to download the actual report with accurate data and sources. Downloaded report will contain the editable graph with accurate data, an excel table with the actual data, the exact source of the data and the release date. This slide shows the Net cash flow from investing activities of Anthem Inc. from 2014 to 2018 In Million JPY. Download it immediately and use it for your business.
-
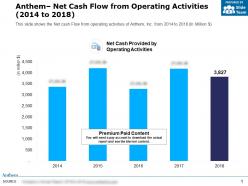 Anthem net cash flow from operating activities 2014-2018
This is a professionally designed visual chart for Anthem Net Cash Flow From Operating Activities 2014 to 2018. This is part of our Data and Statistics products selection, and you will need a Paid account to download the actual report with accurate data and sources. Downloaded report will contain the editable graph with accurate data, an excel table with the actual data, the exact source of the data and the release date. This slide shows the Net cash Flow from operating activities of Anthem Inc. from 2014 to 2018 In Million JPY. Download it immediately and use it for your business.
-
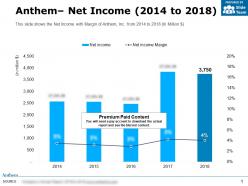 Anthem net income 2014-2018
This is a professionally designed visual chart for Anthem Net Income 2014 to 2018. This is part of our Data and Statistics products selection, and you will need a Paid account to download the actual report with accurate data and sources. Downloaded report will contain the editable graph with accurate data, an excel table with the actual data, the exact source of the data and the release date. This slide shows the Net Income with Margin of Anthem Inc. from 2014 to 2018 In Million JPY. Download it immediately and use it for your business.
-
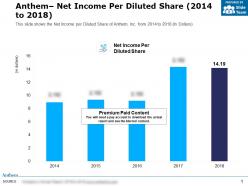 Anthem net income per diluted share 2014-2018
This is a professionally designed visual chart for Anthem Net Income Per Diluted Share 2014 to 2018. This is part of our Data and Statistics products selection, and you will need a Paid account to download the actual report with accurate data and sources. Downloaded report will contain the editable graph with accurate data, an excel table with the actual data, the exact source of the data and the release date. This slide shows the Net Income per Diluted Share of Anthem Inc. from 2014 to 2018 In Dollars. Download it immediately and use it for your business.
-
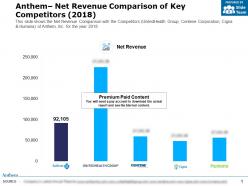 Anthem net revenue comparison of key competitors 2018
This is a professionally designed visual chart for Anthem Net Revenue Comparison Of Key Competitors 2018. This is part of our Data and Statistics products selection, and you will need a Paid account to download the actual report with accurate data and sources. Downloaded report will contain the editable graph with accurate data, an excel table with the actual data, the exact source of the data and the release date. This slide shows the Net Revenue Comparison with the Competitors UnitedHealth Group, Centene Corporation, Cigna and Humana of Anthem Inc. for the year 2018. Download it immediately and use it for your business.
-
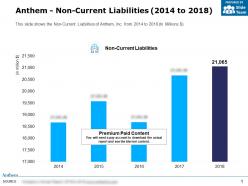 Anthem non current liabilities 2014-2018
This is a professionally designed visual chart for Anthem Non Current Liabilities 2014 to 2018. This is part of our Data and Statistics products selection, and you will need a Paid account to download the actual report with accurate data and sources. Downloaded report will contain the editable graph with accurate data, an excel table with the actual data, the exact source of the data and the release date. This slide shows the Non Current Liabilities of Anthem Inc. from 2014 to 2018 In Millions JPY. Download it immediately and use it for your business.
-
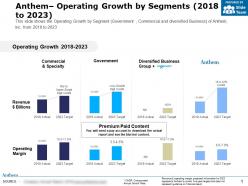 Anthem operating growth by segments 2018-2023
This is a professionally designed visual chart for Anthem Operating Growth By Segments 2018 to 2023. This is part of our Data and Statistics products selection, and you will need a Paid account to download the actual report with accurate data and sources. Downloaded report will contain the editable graph with accurate data, an excel table with the actual data, the exact source of the data and the release date. This slide shows the Operating Growth by Segment Government, Commercial and diversified Business of Anthem Inc. from 2018 to 2023. Download it immediately and use it for your business.
-
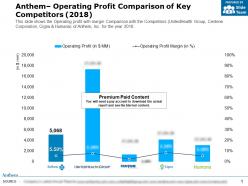 Anthem operating profit comparison of key competitors 2018
This is a professionally designed visual chart for Anthem Operating Profit Comparison Of Key Competitors 2018. This is part of our Data and Statistics products selection, and you will need a Paid account to download the actual report with accurate data and sources. Downloaded report will contain the editable graph with accurate data, an excel table with the actual data, the exact source of the data and the release date. This slide shows the Operating profit with margin Comparison with the Competitors UnitedHealth Group, Centene Corporation, Cigna and Humana of Anthem Inc. for the year 2018. Download it immediately and use it for your business.
-
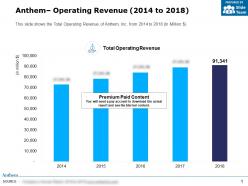 Anthem operating revenue 2014-2018
This is a professionally designed visual chart for Anthem Operating Revenue 2014 to 2018. This is part of our Data and Statistics products selection, and you will need a Paid account to download the actual report with accurate data and sources. Downloaded report will contain the editable graph with accurate data, an excel table with the actual data, the exact source of the data and the release date. This slide shows the Total Operating Revenue of Anthem Inc. from 2014 to 2018 In Million JPY. Download it immediately and use it for your business.
-
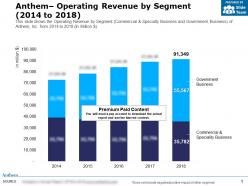 Anthem operating revenue by segment 2014-2018
This is a professionally designed visual chart for Anthem Operating Revenue By Segment 2014 to 2018. This is part of our Data and Statistics products selection, and you will need a Paid account to download the actual report with accurate data and sources. Downloaded report will contain the editable graph with accurate data, an excel table with the actual data, the exact source of the data and the release date. This slide shows the Operating Revenue by Segment Commercial and Specialty Business and Government Business of Anthem Inc. from 2014 to 2018 In Million JPY. Download it immediately and use it for your business.
-
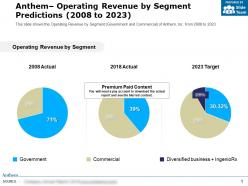 Anthem operating revenue by segment predictions 2008-2023
This is a professionally designed visual chart for Anthem Operating Revenue By Segment Predictions 2008 to 2023. This is part of our Data and Statistics products selection, and you will need a Paid account to download the actual report with accurate data and sources. Downloaded report will contain the editable graph with accurate data, an excel table with the actual data, the exact source of the data and the release date. This slide shows the Operating Revenue by Segment Government and Commercial of Anthem Inc. from 2008 to 2023. Download it immediately and use it for your business.
-
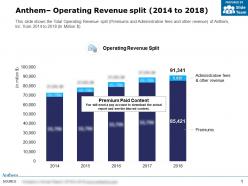 Anthem operating revenue split 2014-2018
This is a professionally designed visual chart for Anthem Operating Revenue Split 2014 to 2018. This is part of our Data and Statistics products selection, and you will need a Paid account to download the actual report with accurate data and sources. Downloaded report will contain the editable graph with accurate data, an excel table with the actual data, the exact source of the data and the release date. This slide shows the Total Operating Revenue split Premiums and Administrative fees and other revenue of Anthem Inc. from 2014 to 2018 In Million JPY. Download it immediately and use it for your business.
-
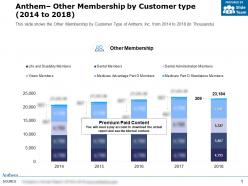 Anthem other membership by customer type 2014-2018
This is a professionally designed visual chart for Anthem Other Membership By Customer Type 2014 to 2018. This is part of our Data and Statistics products selection, and you will need a Paid account to download the actual report with accurate data and sources. Downloaded report will contain the editable graph with accurate data, an excel table with the actual data, the exact source of the data and the release date. This slide shows the Other Membership by Customer Type of Anthem Inc. from 2014 to 2018 In Thousands. Download it immediately and use it for your business.
-
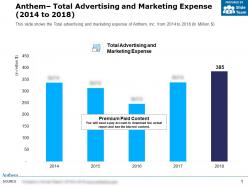 Anthem total advertising and marketing expense 2014-2018
This is a professionally designed visual chart for Anthem Total Advertising And Marketing Expense 2014 to 2018. This is part of our Data and Statistics products selection, and you will need a Paid account to download the actual report with accurate data and sources. Downloaded report will contain the editable graph with accurate data, an excel table with the actual data, the exact source of the data and the release date. This slide shows the Total advertising and marketing expense of Anthem Inc. from 2014 to 2018 In Million JPY. Download it immediately and use it for your business.
-
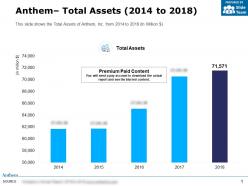 Anthem total assets 2014-2018
This is a professionally designed visual chart for Anthem Total Assets 2014 to 2018. This is part of our Data and Statistics products selection, and you will need a Paid account to download the actual report with accurate data and sources. Downloaded report will contain the editable graph with accurate data, an excel table with the actual data, the exact source of the data and the release date. This slide shows the Total Assets of Anthem Inc. from 2014 to 2018 In Million JPY. Download it immediately and use it for your business.
-
 Anthem total current liabilities 2014-2018
This is a professionally designed visual chart for Anthem Total Current Liabilities 2014 to 2018. This is part of our Data and Statistics products selection, and you will need a Paid account to download the actual report with accurate data and sources. Downloaded report will contain the editable graph with accurate data, an excel table with the actual data, the exact source of the data and the release date. This slide shows the Total Current Liabilities of Anthem Inc. from 2014 to 2018 In Million JPY. Download it immediately and use it for your business.
-
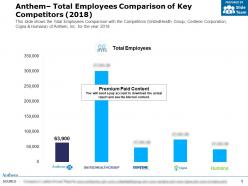 Anthem total employees comparison of key competitors 2018
This is a professionally designed visual chart for Anthem Total Employees Comparison Of Key Competitors 2018. This is part of our Data and Statistics products selection, and you will need a Paid account to download the actual report with accurate data and sources. Downloaded report will contain the editable graph with accurate data, an excel table with the actual data, the exact source of the data and the release date. This slide shows the Total Employees Comparison with the Competitors UnitedHealth Group, Centene Corporation, Cigna and Humana of Anthem Inc. for the year 2018. Download it immediately and use it for your business.
-
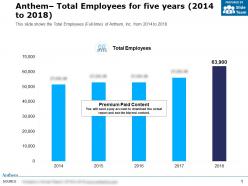 Anthem total employees for five years 2014-2018
This is a professionally designed visual chart for Anthem Total Employees For Five Years 2014 to 2018. This is part of our Data and Statistics products selection, and you will need a Paid account to download the actual report with accurate data and sources. Downloaded report will contain the editable graph with accurate data, an excel table with the actual data, the exact source of the data and the release date. This slide shows the Total Employees Full time of Anthem Inc. from 2014 to 2018. Download it immediately and use it for your business.
-
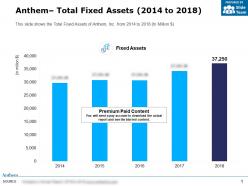 Anthem total fixed assets 2014-2018
This is a professionally designed visual chart for Anthem Total Fixed Assets 2014 to 2018. This is part of our Data and Statistics products selection, and you will need a Paid account to download the actual report with accurate data and sources. Downloaded report will contain the editable graph with accurate data, an excel table with the actual data, the exact source of the data and the release date. This slide shows the Total Fixed Assets of Anthem Inc. from 2014 to 2018 In Million JPY. Download it immediately and use it for your business.
-
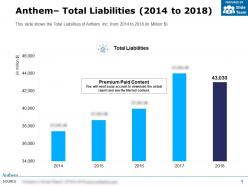 Anthem total liabilities 2014-2018
This is a professionally designed visual chart for Anthem Total Liabilities 2014 to 2018. This is part of our Data and Statistics products selection, and you will need a Paid account to download the actual report with accurate data and sources. Downloaded report will contain the editable graph with accurate data, an excel table with the actual data, the exact source of the data and the release date. This slide shows the Total Liabilities of Anthem Inc. from 2014 to 2018 In Million JPY. Download it immediately and use it for your business.
-
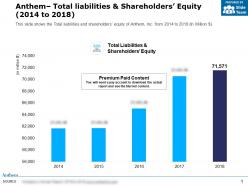 Anthem total liabilities and shareholders equity 2014-2018
This is a professionally designed visual chart for Anthem Total Liabilities And Shareholders Equity 2014 to 2018. This is part of our Data and Statistics products selection, and you will need a Paid account to download the actual report with accurate data and sources. Downloaded report will contain the editable graph with accurate data, an excel table with the actual data, the exact source of the data and the release date. This slide shows the Total liabilities and shareholders equity of Anthem Inc. from 2014 to 2018 In Million JPY. Download it immediately and use it for your business.
-
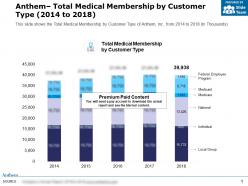 Anthem total medical membership by customer type 2014-2018
This is a professionally designed visual chart for Anthem Total Medical Membership By Customer Type 2014 to 2018. This is part of our Data and Statistics products selection, and you will need a Paid account to download the actual report with accurate data and sources. Downloaded report will contain the editable graph with accurate data, an excel table with the actual data, the exact source of the data and the release date. This slide shows the Total Medical Membership by Customer Type of Anthem Inc. from 2014 to 2018 In Thousands. Download it immediately and use it for your business.
-
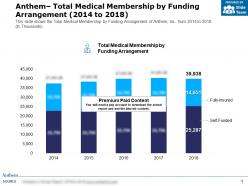 Anthem total medical membership by funding arrangement 2014-2018
This is a professionally designed visual chart for Anthem Total Medical Membership By Funding Arrangement 2014 to 2018. This is part of our Data and Statistics products selection, and you will need a Paid account to download the actual report with accurate data and sources. Downloaded report will contain the editable graph with accurate data, an excel table with the actual data, the exact source of the data and the release date. This slide shows the Total Medical Membership by Funding Arrangement of Anthem Inc. from 2014 to 2018 In Thousands. Download it immediately and use it for your business.
-
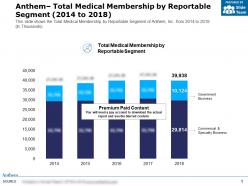 Anthem total medical membership by reportable segment 2014-2018
This is a professionally designed visual chart for Anthem Total Medical Membership By Reportable Segment 2014 to 2018. This is part of our Data and Statistics products selection, and you will need a Paid account to download the actual report with accurate data and sources. Downloaded report will contain the editable graph with accurate data, an excel table with the actual data, the exact source of the data and the release date. This slide shows the Total Medical Membership by Reportable Segment of Anthem Inc. from 2014 to 2018 In Thousands. Download it immediately and use it for your business.
-
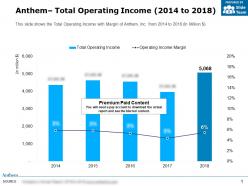 Anthem total operating income 2014-2018
This is a professionally designed visual chart for Anthem Total Operating Income 2014 to 2018. This is part of our Data and Statistics products selection, and you will need a Paid account to download the actual report with accurate data and sources. Downloaded report will contain the editable graph with accurate data, an excel table with the actual data, the exact source of the data and the release date. This slide shows the Total Operating Income with Margin of Anthem Inc. from 2014 to 2018 In Million JPY. Download it immediately and use it for your business.
-
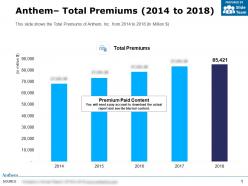 Anthem total premiums 2014-2018
This is a professionally designed visual chart for Anthem Total Premiums 2014 to 2018. This is part of our Data and Statistics products selection, and you will need a Paid account to download the actual report with accurate data and sources. Downloaded report will contain the editable graph with accurate data, an excel table with the actual data, the exact source of the data and the release date. This slide shows the Total Premiums of Anthem Inc. from 2014 to 2018 In Million JPY. Download it immediately and use it for your business.
-
 Anthem total property and equipment 2014-2018
This is a professionally designed visual chart for Anthem Total Property And Equipment 2014 to 2018. This is part of our Data and Statistics products selection, and you will need a Paid account to download the actual report with accurate data and sources. Downloaded report will contain the editable graph with accurate data, an excel table with the actual data, the exact source of the data and the release date. This slide shows the Total Property and equipment net of Anthem Inc. from 2014 to 2018 In Millions JPY. Download it immediately and use it for your business.
-
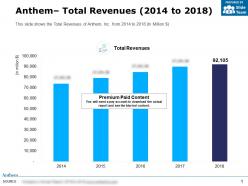 Anthem total revenues 2014-2018
This is a professionally designed visual chart for Anthem Total Revenues 2014 to 2018. This is part of our Data and Statistics products selection, and you will need a Paid account to download the actual report with accurate data and sources. Downloaded report will contain the editable graph with accurate data, an excel table with the actual data, the exact source of the data and the release date. This slide shows the Total Revenues of Anthem Inc. from 2014 to 2018 In Million JPY. Download it immediately and use it for your business.
-
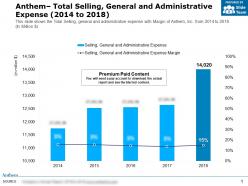 Anthem total selling general and administrative expense 2014-2018
This is a professionally designed visual chart for Anthem Total Selling General And Administrative Expense 2014 to 2018. This is part of our Data and Statistics products selection, and you will need a Paid account to download the actual report with accurate data and sources. Downloaded report will contain the editable graph with accurate data, an excel table with the actual data, the exact source of the data and the release date. This slide shows the Total Selling, general and administrative expense with Margin of Anthem Inc. from 2014 to 2018 In Million JPY. Download it immediately and use it for your business.
-
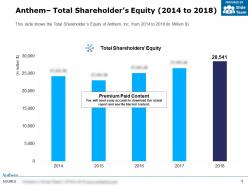 Anthem total shareholders equity 2014-2018
This is a professionally designed visual chart for Anthem Total Shareholders Equity 2014 to 2018. This is part of our Data and Statistics products selection, and you will need a Paid account to download the actual report with accurate data and sources. Downloaded report will contain the editable graph with accurate data, an excel table with the actual data, the exact source of the data and the release date. This slide shows the Total Shareholders Equity of Anthem Inc. from 2014 to 2018 In Million JPY. Download it immediately and use it for your business.
-
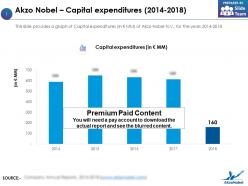 Akzo nobel capital expenditures 2014-2018
This is a professionally designed visual chart for Akzo Nobel Capital Expenditures 2014 to 2018. This is part of our Data and Statistics products selection, and you will need a Paid account to download the actual report with accurate data and sources. Downloaded report will contain the editable graph with accurate data, an excel table with the actual data, the exact source of the data and the release date. This slide provides a graph of Capital expenditures in JPY MM of Akzo Nobel N.V. for the years 2014 to 2018. Download it immediately and use it for your business.
-
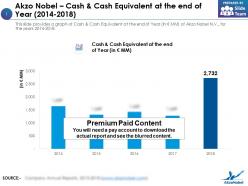 Akzo nobel cash and cash equivalent at the end of year 2014-2018
This is a professionally designed visual chart for Akzo Nobel Cash And Cash Equivalent At The End Of Year 2014 to 2018. This is part of our Data and Statistics products selection, and you will need a Paid account to download the actual report with accurate data and sources. Downloaded report will contain the editable graph with accurate data, an excel table with the actual data, the exact source of the data and the release date. This slide provides a graph of Cash and Cash Equivalent at the end of Year in JPY MM of Akzo Nobel N.V. for the years 2014 to 2018. Download it immediately and use it for your business.
-
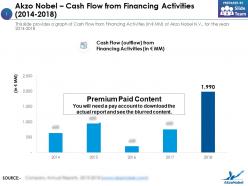 Akzo nobel cash flow from financing activities 2014-2018
This is a professionally designed visual chart for Akzo Nobel Cash Flow From Financing Activities 2014 to 2018. This is part of our Data and Statistics products selection, and you will need a Paid account to download the actual report with accurate data and sources. Downloaded report will contain the editable graph with accurate data, an excel table with the actual data, the exact source of the data and the release date. This slide provides a graph of Cash Flow from Financing Activities in JPY MM of Akzo Nobel N.V. for the years 2014 to 2018. Download it immediately and use it for your business.
-
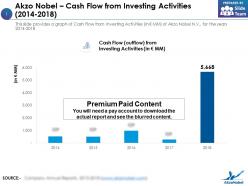 Akzo nobel cash flow from investing activities 2014-2018
This is a professionally designed visual chart for Akzo Nobel Cash Flow From Investing Activities 2014 to 2018. This is part of our Data and Statistics products selection, and you will need a Paid account to download the actual report with accurate data and sources. Downloaded report will contain the editable graph with accurate data, an excel table with the actual data, the exact source of the data and the release date. This slide provides a graph of Cash Flow from Investing Activities in JPY MM of Akzo Nobel N.V. for the years 2014 to 2018. Download it immediately and use it for your business.
-
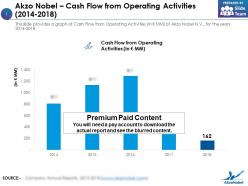 Akzo nobel cash flow from operating activities 2014-2018
This is a professionally designed visual chart for Akzo Nobel Cash Flow From Operating Activities 2014 to 2018. This is part of our Data and Statistics products selection, and you will need a Paid account to download the actual report with accurate data and sources. Downloaded report will contain the editable graph with accurate data, an excel table with the actual data, the exact source of the data and the release date. This slide provides a graph of Cash Flow from Operating Activities in JPY MM of Akzo Nobel N.V. for the years 2014 to 2018. Download it immediately and use it for your business.
-
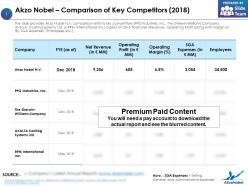 Akzo nobel comparison of key competitors 2018
This is a professionally designed visual chart for Akzo Nobel Comparison Of Key Competitors 2018. This is part of our Data and Statistics products selection, and you will need a Paid account to download the actual report with accurate data and sources. Downloaded report will contain the editable graph with accurate data, an excel table with the actual data, the exact source of the data and the release date. The slide provides Akzo Nobel N.V. comparison with its key competitors PPG Industries, Inc. The Sherwin Williams Company, AXALTA Coating Systems Ltd. and RPM International Inc. based on 2018 financials Revenue, Operating Profit along with margin in percent, SGA expenses, Employees etc. Download it immediately and use it for your business.
-
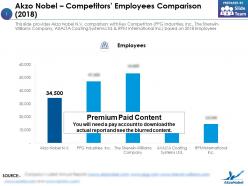 Akzo nobel competitors employees comparison 2018
This is a professionally designed visual chart for Akzo Nobel Competitors Employees Comparison 2018. This is part of our Data and Statistics products selection, and you will need a Paid account to download the actual report with accurate data and sources. Downloaded report will contain the editable graph with accurate data, an excel table with the actual data, the exact source of the data and the release date. This slide provides Akzo Nobel N.V. comparison with Key Competitors PPG Industries, Inc. The Sherwin Williams Company, AXALTA Coating Systems Ltd. and RPM International Inc. based on 2018 Employees. Download it immediately and use it for your business.
-
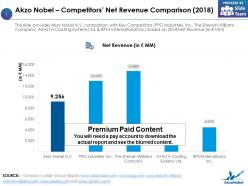 Akzo nobel competitors net revenue comparison 2018
This is a professionally designed visual chart for Akzo Nobel Competitors Net Revenue Comparison 2018. This is part of our Data and Statistics products selection, and you will need a Paid account to download the actual report with accurate data and sources. Downloaded report will contain the editable graph with accurate data, an excel table with the actual data, the exact source of the data and the release date. This slide provides Akzo Nobel N.V. comparison with Key Competitors PPG Industries, Inc. The Sherwin Williams Company, AXALTA Coating Systems Ltd. and RPM International Inc. based on 2018 Net Revenue in JPY MM. Download it immediately and use it for your business.


