Retail and Trade Data Statistics PowerPoint Templates, PowerPoint Statistics Slides
- Sub Categories
-
- Agriculture
- Chemicals and Resources
- Construction
- Consumer Goods and FMCG
- E-Commerce
- Energy and Environmental Services
- Finance Insurance and Real Estate
- Health and Pharmaceuticals
- Internet
- Life
- Media and Advertising
- Metals and Electronics
- Retail and Trade
- Services
- Society
- Sports and Recreation
- Survey
- Technology and Telecommunications
- Transportation and Logistics
- Travel Tourism and Hospitality
- USA
-
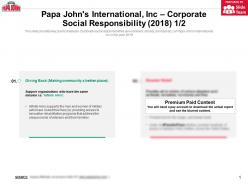 Papa johns international inc corporate social responsibility 2018
The information presented in this slide has been researched by our team of professional business analysts. This is part of our Company Profiles products selection, and you will need a Paid account to download the actual report with accurate data and sources. Downloaded report will be in Powerpoint and will contain the actual editable slides with the actual data and sources for each data. This slide provides key points related to Corporate social responsibilities environment, society, animals etc. of Papa Johns International Inc in the year 2018. Download it immediately and use it for your business.
-
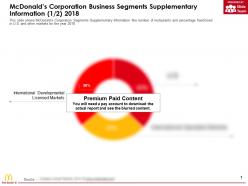 Mcdonalds corporation business segments supplementary information 2018
This is a professionally designed visual chart for McDonalds Corporation Business Segments Supplementary Information 2018. This is part of our Data and Statistics products selection, and you will need a Paid account to download the actual report with accurate data and sources. Downloaded report will contain the editable graph with accurate data, an excel table with the actual data, the exact source of the data and the release date. This slide shows McDonalds Corporation Segments Supplementary Information like number of restaurants and percentage franchised in U.S and other markets for the year 2018. Download it immediately and use it for your business.
-
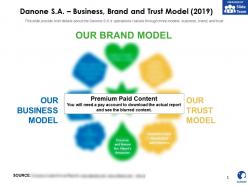 Danone sa business brand and trust model 2019
The information presented in this slide has been researched by our team of professional business analysts. This is part of our Company Profiles products selection, and you will need a Paid account to download the actual report with accurate data and sources. Downloaded report will be in Powerpoint and will contain the actual editable slides with the actual data and sources for each data. This slide provide brief details about the Danone S.As operations values through three models business, brand, and trust. Download it immediately and use it for your business.
-
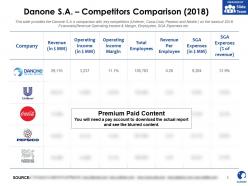 Danone sa competitors comparison 2018
The information presented in this slide has been researched by our team of professional business analysts. This is part of our Company Profiles products selection, and you will need a Paid account to download the actual report with accurate data and sources. Downloaded report will be in Powerpoint and will contain the actual editable slides with the actual data and sources for each data. This slide provides the Danone S.As comparison with key competitors Unilever, Coca Cola, Pepsico and Nestle on the basis of 2018 Financials Revenue Operating Income and Margin, Employees, SGA Expenses etc. Download it immediately and use it for your business.
-
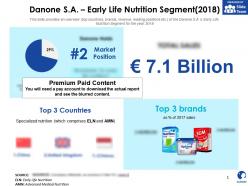 Danone sa early life nutrition segment 2018
The information presented in this slide has been researched by our team of professional business analysts. This is part of our Company Profiles products selection, and you will need a Paid account to download the actual report with accurate data and sources. Downloaded report will be in Powerpoint and will contain the actual editable slides with the actual data and sources for each data. This slide provides an overview top countries, brands, revenue, leading positions etc. of the Danone S.As Early Life Nutrition Segment for the year 2018. Download it immediately and use it for your business.
-
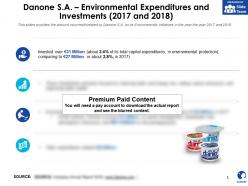 Danone sa environmental expenditures and investments 2017-2018
The information presented in this slide has been researched by our team of professional business analysts. This is part of our Company Profiles products selection, and you will need a Paid account to download the actual report with accurate data and sources. Downloaded report will be in Powerpoint and will contain the actual editable slides with the actual data and sources for each data. This slides provides the amount incurred invested by Danone S.A on its Environmental initiatives in the year the year 2017 to 2018. Download it immediately and use it for your business.
-
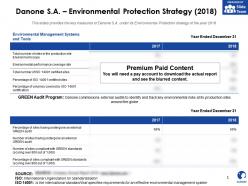 Danone sa environmental protection strategy 2018
The information presented in this slide has been researched by our team of professional business analysts. This is part of our Company Profiles products selection, and you will need a Paid account to download the actual report with accurate data and sources. Downloaded report will be in Powerpoint and will contain the actual editable slides with the actual data and sources for each data. This slides provides the key measures of Danone S.A under its Environmental Protection strategy of the year 2018. Download it immediately and use it for your business.
-
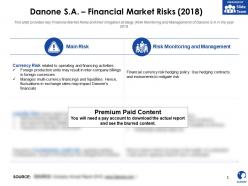 Danone sa financial market risks 2018
The information presented in this slide has been researched by our team of professional business analysts. This is part of our Company Profiles products selection, and you will need a Paid account to download the actual report with accurate data and sources. Downloaded report will be in Powerpoint and will contain the actual editable slides with the actual data and sources for each data. This slide provides key Financial Market Risks and their mitigation strategy Risk Monitoring and Management of Danone S.A in the year 2018. Download it immediately and use it for your business.
-
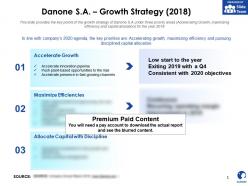 Danone sa growth strategy 2018
The information presented in this slide has been researched by our team of professional business analysts. This is part of our Company Profiles products selection, and you will need a Paid account to download the actual report with accurate data and sources. Downloaded report will be in Powerpoint and will contain the actual editable slides with the actual data and sources for each data. This slide provides the key points of the growth strategy of Danone S.A under three priority areas Accelerating Growth, maximizing efficiency and capital allocation for the year 2018. Download it immediately and use it for your business.
-
 Danone sa key competitors 2018
The information presented in this slide has been researched by our team of professional business analysts. This is part of our Company Profiles products selection, and you will need a Paid account to download the actual report with accurate data and sources. Downloaded report will be in Powerpoint and will contain the actual editable slides with the actual data and sources for each data. This slide provides the name of key competitors of Danone S.A under each segment EDP International and EDP Noram, Specialized Nutrition and Water as of 2018. Download it immediately and use it for your business.
-
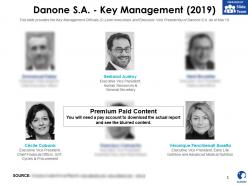 Danone sa key management 2019
The information presented in this slide has been researched by our team of professional business analysts. This is part of our Company Profiles products selection, and you will need a Paid account to download the actual report with accurate data and sources. Downloaded report will be in Powerpoint and will contain the actual editable slides with the actual data and sources for each data. This slide provides the Key Management Officials C Level executives and Executive Vice Presidents of Danone S.A as of Mar19. Download it immediately and use it for your business.
-
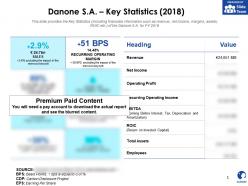 Danone sa key statistics 2018
The information presented in this slide has been researched by our team of professional business analysts. This is part of our Company Profiles products selection, and you will need a Paid account to download the actual report with accurate data and sources. Downloaded report will be in Powerpoint and will contain the actual editable slides with the actual data and sources for each data. This slide provides the Key Statistics including financials information such as revenue, net income, margins, assets, ROIC etc. of the Danone S.A for FY 2018. Download it immediately and use it for your business.
-
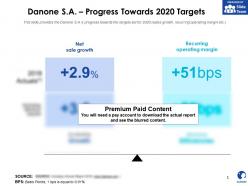 Danone sa progress towards 2020 targets
The information presented in this slide has been researched by our team of professional business analysts. This is part of our Company Profiles products selection, and you will need a Paid account to download the actual report with accurate data and sources. Downloaded report will be in Powerpoint and will contain the actual editable slides with the actual data and sources for each data. This slide provides the Danone S.As progress towards the targets set for 2020 sales growth, recurring operating margin etc. Download it immediately and use it for your business.
-
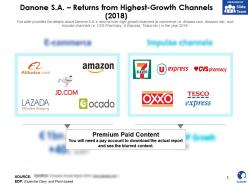 Danone sa returns from highest growth channels 2018
The information presented in this slide has been researched by our team of professional business analysts. This is part of our Company Profiles products selection, and you will need a Paid account to download the actual report with accurate data and sources. Downloaded report will be in Powerpoint and will contain the actual editable slides with the actual data and sources for each data. This slide provides the details about Danone S.As returns from high growth channels e commerce i.e. Alibaba.com, Amazon etc. and Impulse channels i.e. CVS Pharmacy, U Express, Tesco etc. in the year 2018. Download it immediately and use it for your business.
-
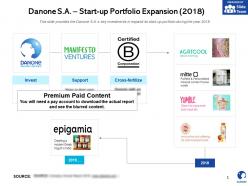 Danone sa start up portfolio expansion 2018
The information presented in this slide has been researched by our team of professional business analysts. This is part of our Company Profiles products selection, and you will need a Paid account to download the actual report with accurate data and sources. Downloaded report will be in Powerpoint and will contain the actual editable slides with the actual data and sources for each data. This slide provides the Danone S.As key investments in expand its start up portfolio during the year 2018. Download it immediately and use it for your business.
-
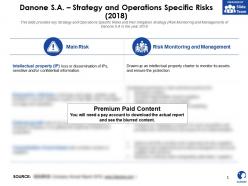 Danone sa strategy and operations specific risks 2018
The information presented in this slide has been researched by our team of professional business analysts. This is part of our Company Profiles products selection, and you will need a Paid account to download the actual report with accurate data and sources. Downloaded report will be in Powerpoint and will contain the actual editable slides with the actual data and sources for each data. This slide provides key Strategy and Operations Specific Risks and their mitigation strategy Risk Monitoring and Management of Danone S.A in the year 2018. Download it immediately and use it for your business.
-
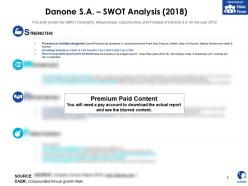 Danone sa swot analysis 2018
The information presented in this slide has been researched by our team of professional business analysts. This is part of our Company Profiles products selection, and you will need a Paid account to download the actual report with accurate data and sources. Downloaded report will be in Powerpoint and will contain the actual editable slides with the actual data and sources for each data. This slide shows the SWOT Strengths, Weaknesses, Opportunities, and Threats of Danone S.A for the year 2018. Download it immediately and use it for your business.
-
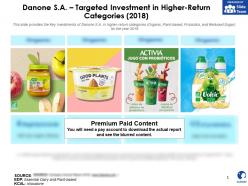 Danone sa targeted investment in higher return categories 2018
The information presented in this slide has been researched by our team of professional business analysts. This is part of our Company Profiles products selection, and you will need a Paid account to download the actual report with accurate data and sources. Downloaded report will be in Powerpoint and will contain the actual editable slides with the actual data and sources for each data. This slide provides the Key investments of Danone S.A in higher return categories Organic, Plant based, Probiotics, and Reduced Sugar for the year 2018. Download it immediately and use it for your business.
-
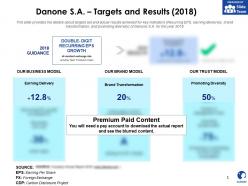 Danone sa targets and results 2018
The information presented in this slide has been researched by our team of professional business analysts. This is part of our Company Profiles products selection, and you will need a Paid account to download the actual report with accurate data and sources. Downloaded report will be in Powerpoint and will contain the actual editable slides with the actual data and sources for each data. This slide provides the details about targets set and actual results achieved for key indicators Recurring EPS, earning deliveries, brand transformation, and promoting diversity of Danone S.A for the year 2018. Download it immediately and use it for your business.
-
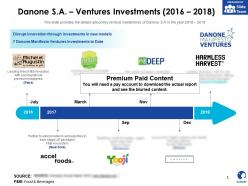 Danone sa ventures investments 2016-2018
The information presented in this slide has been researched by our team of professional business analysts. This is part of our Company Profiles products selection, and you will need a Paid account to download the actual report with accurate data and sources. Downloaded report will be in Powerpoint and will contain the actual editable slides with the actual data and sources for each data. This slide provides the details about key venture investments of Danone S.A in the year 2016 to 2018. Download it immediately and use it for your business.
-
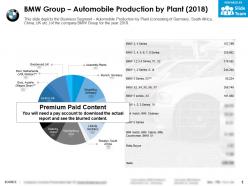 Bmw group automobile production by plant 2018
This is a professionally designed visual chart for BMW Group Automobile Production By Plant 2018. This is part of our Data and Statistics products selection, and you will need a Paid account to download the actual report with accurate data and sources. Downloaded report will contain the editable graph with accurate data, an excel table with the actual data, the exact source of the data and the release date. This slide depicts the Business Segment Automobile Production by Plant consisting of Germany, South Africa, China, UK etc. of the company BMW Group for the year 2018. Download it immediately and use it for your business.
-
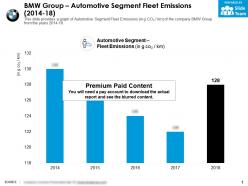 Bmw group automotive segment fleet emissions 2014-18
This is a professionally designed visual chart for BMW Group Automotive Segment Fleet Emissions 2014 to 18. This is part of our Data and Statistics products selection, and you will need a Paid account to download the actual report with accurate data and sources. Downloaded report will contain the editable graph with accurate data, an excel table with the actual data, the exact source of the data and the release date. This slide provides a graph of Automotive Segment Fleet Emissions in g CO2 km of the company BMW Group from the years 2014 to 18. Download it immediately and use it for your business.
-
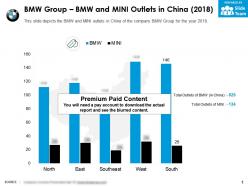 Bmw group bmw and mini outlets in china 2018
This is a professionally designed visual chart for BMW Group BMW And Mini Outlets In China 2018. This is part of our Data and Statistics products selection, and you will need a Paid account to download the actual report with accurate data and sources. Downloaded report will contain the editable graph with accurate data, an excel table with the actual data, the exact source of the data and the release date. This slide depicts the BMW and MINI outlets in China of the company BMW Group for the year 2018. Download it immediately and use it for your business.
-
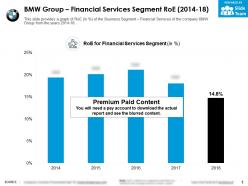 Bmw group financial services segment roe 2014-18
This is a professionally designed visual chart for BMW Group Financial Services Segment Roe 2014 to 18. This is part of our Data and Statistics products selection, and you will need a Paid account to download the actual report with accurate data and sources. Downloaded report will contain the editable graph with accurate data, an excel table with the actual data, the exact source of the data and the release date. This slide provides a graph of ROE in Percentage of the Business Segment Financial Services of the company BMW Group from the years 2014 to 18. Download it immediately and use it for your business.
-
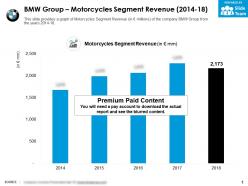 Bmw group motorcycles segment revenue 2014-18
This is a professionally designed visual chart for BMW Group Motorcycles Segment Revenue 2014 to 18. This is part of our Data and Statistics products selection, and you will need a Paid account to download the actual report with accurate data and sources. Downloaded report will contain the editable graph with accurate data, an excel table with the actual data, the exact source of the data and the release date. This slide provides a graph of Motorcycles Segment Revenue in JPY millions of the company BMW Group from the years 2014 to 18. Download it immediately and use it for your business.
-
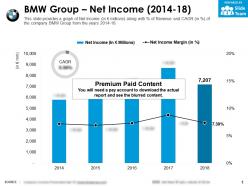 Bmw group net income 2014-18
This is a professionally designed visual chart for BMW Group Net Income 2014 to 18. This is part of our Data and Statistics products selection, and you will need a Paid account to download the actual report with accurate data and sources. Downloaded report will contain the editable graph with accurate data, an excel table with the actual data, the exact source of the data and the release date. This slide provides a graph of Net Income in JPY millions along with Percentage of Revenue and CAGR in Percentage of the company BMW Group from the years 2014 to 18. Download it immediately and use it for your business.
-
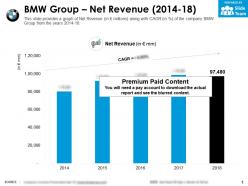 Bmw group net revenue 2014-18
This is a professionally designed visual chart for BMW Group Net Revenue 2014 to 18. This is part of our Data and Statistics products selection, and you will need a Paid account to download the actual report with accurate data and sources. Downloaded report will contain the editable graph with accurate data, an excel table with the actual data, the exact source of the data and the release date. This slide provides a graph of Net Revenue in JPY millions along with CAGR in Percentage of the company BMW Group from the years 2014 to 18. Download it immediately and use it for your business.
-
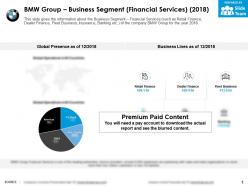 Bmw group business segment financial services 2018
The information presented in this slide has been researched by our team of professional business analysts. This is part of our Company Profiles products selection, and you will need a Paid account to download the actual report with accurate data and sources. Downloaded report will be in Powerpoint and will contain the actual editable slides with the actual data and sources for each data. This slide gives the information about the Business Segment Financial Services such as Retail Finance, Dealer Finance, Fleet Business, Insurance, Banking etc. of the company BMW Group for the year 2018. Download it immediately and use it for your business.
-
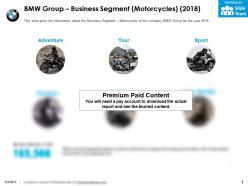 Bmw group business segment motorcycles 2018
The information presented in this slide has been researched by our team of professional business analysts. This is part of our Company Profiles products selection, and you will need a Paid account to download the actual report with accurate data and sources. Downloaded report will be in Powerpoint and will contain the actual editable slides with the actual data and sources for each data. This slide gives the information about the Business Segment Motorcycles of the company BMW Group for the year 2018. Download it immediately and use it for your business.
-
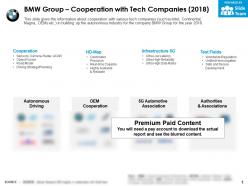 Bmw group cooperation with tech companies 2018
The information presented in this slide has been researched by our team of professional business analysts. This is part of our Company Profiles products selection, and you will need a Paid account to download the actual report with accurate data and sources. Downloaded report will be in Powerpoint and will contain the actual editable slides with the actual data and sources for each data. This slide gives the information about cooperation with various tech companies such as Intel, Continental, Magna, OEMs etc. in building up the autonomous industry for the company BMW Group for the year 2018. Download it immediately and use it for your business.
-
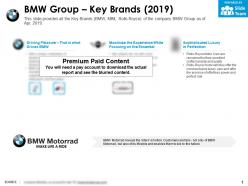 Bmw group key brands 2019
The information presented in this slide has been researched by our team of professional business analysts. This is part of our Company Profiles products selection, and you will need a Paid account to download the actual report with accurate data and sources. Downloaded report will be in Powerpoint and will contain the actual editable slides with the actual data and sources for each data. This slide provides all the Key Brands BMW, MINI, Rolls Royce of the company BMW Group as of Apr, 2019. Download it immediately and use it for your business.
-
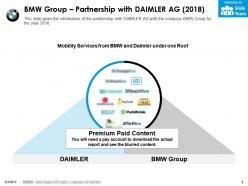 Bmw group partnership with daimler ag 2018
The information presented in this slide has been researched by our team of professional business analysts. This is part of our Company Profiles products selection, and you will need a Paid account to download the actual report with accurate data and sources. Downloaded report will be in Powerpoint and will contain the actual editable slides with the actual data and sources for each data. This slide gives the information of the partnership with DAIMLER AG with the company BMW Group for the year 2018. Download it immediately and use it for your business.
-
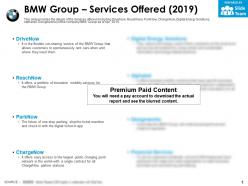 Bmw group services offered 2019
The information presented in this slide has been researched by our team of professional business analysts. This is part of our Company Profiles products selection, and you will need a Paid account to download the actual report with accurate data and sources. Downloaded report will be in Powerpoint and will contain the actual editable slides with the actual data and sources for each data. This slide provides the details of the Services offered including Drive Now, Reach Now, Park Now, Charge Now, Digital Energy Solutions, Alphabet, Design works of the company BMW Group as of Apr, 2019. Download it immediately and use it for your business.
-
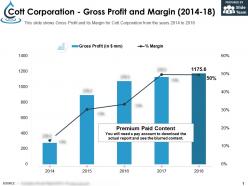 Cott corporation gross profit and margin 2014-18
This is a professionally designed visual chart for Cott Corporation Gross Profit And Margin 2014 to 18. This is part of our Data and Statistics products selection, and you will need a Paid account to download the actual report with accurate data. Downloaded report will contain the editable graph with accurate data, an excel table with the actual data, the exact source of the data and the release date. This slide shows Gross Profit and its Margin for Cott Corporation from the years 2014 to 2018. Download it immediately and use it for your business.
-
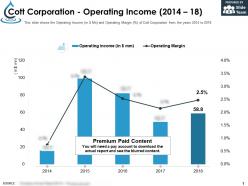 Cott corporation operating income 2014-18
This is a professionally designed visual chart for Cott Corporation Operating Income 2014 to 18. This is part of our Data and Statistics products selection, and you will need a Paid account to download the actual report with accurate data. Downloaded report will contain the editable graph with accurate data, an excel table with the actual data, the exact source of the data and the release date. This slide shows the Operating Income in JPY Mn and Operating Margin Percentage of Cott Corporation from the years 2014 to 2018. Download it immediately and use it for your business.
-
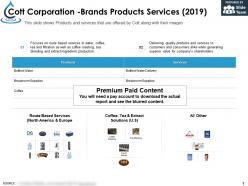 Cott corporation brands products services 2019
The information presented in this slide has been researched by our team of professional business analysts. This is part of our Company Profiles products selection, and you will need a Paid account to download the actual report with accurate data and sources. Downloaded report will be in Powerpoint and will contain the actual editable slides with the actual data and sources for each data. This slide shows Products and services that are offered by Cott along with their images. Download it immediately and use it for your business.
-
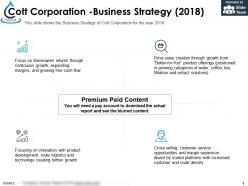 Cott corporation business strategy 2018
The information presented in this slide has been researched by our team of professional business analysts. This is part of our Company Profiles products selection, and you will need a Paid account to download the actual report with accurate data and sources. Downloaded report will be in Powerpoint and will contain the actual editable slides with the actual data and sources for each data. This slide shows the Business Strategy of Cott Corporation for the year 2018. Download it immediately and use it for your business.
-
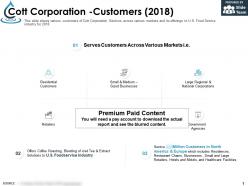 Cott corporation customers 2018
The information presented in this slide has been researched by our team of professional business analysts. This is part of our Company Profiles products selection, and you will need a Paid account to download the actual report with accurate data and sources. Downloaded report will be in Powerpoint and will contain the actual editable slides with the actual data and sources for each data. This slide shows various customers of Cott Corporation Services across various markets and its offerings to U.S. Food Service industry for 2018. Download it immediately and use it for your business.
-
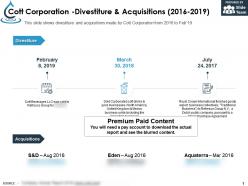 Cott corporation divestiture and acquisitions 2016-2019
The information presented in this slide has been researched by our team of professional business analysts. This is part of our Company Profiles products selection, and you will need a Paid account to download the actual report with accurate data and sources. Downloaded report will be in Powerpoint and will contain the actual editable slides with the actual data and sources for each data. This slide shows divestiture and acquisitions made by Cott Corporation from 2016 to Feb 19. Download it immediately and use it for your business.
-
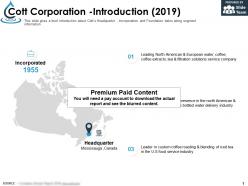 Cott corporation introduction 2019
The information presented in this slide has been researched by our team of professional business analysts. This is part of our Company Profiles products selection, and you will need a Paid account to download the actual report with accurate data and sources. Downloaded report will be in Powerpoint and will contain the actual editable slides with the actual data and sources for each data. This slide gives a brief introduction about Cotts Headquarter, Incorporation and Foundation dates along segment information. Download it immediately and use it for your business.
-
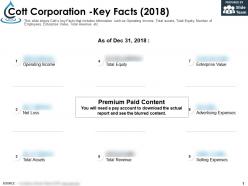 Cott corporation key facts 2018
The information presented in this slide has been researched by our team of professional business analysts. This is part of our Company Profiles products selection, and you will need a Paid account to download the actual report with accurate data and sources. Downloaded report will be in Powerpoint and will contain the actual editable slides with the actual data and sources for each data. This slide shows Cotts key Facts that includes information such as Operating Income, Total assets, Total Equity, Number of Employees, Enterprise Value, Total Revenue etc. Download it immediately and use it for your business.
-
 Cott corporation key facts of all other division 2019
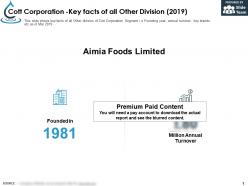
The information presented in this slide has been researched by our team of professional business analysts. This is part of our Company Profiles products selection, and you will need a Paid account to download the actual report with accurate data and sources. Downloaded report will be in Powerpoint and will contain the actual editable slides with the actual data and sources for each data. This slide shows key facts of all Other division of Cott Corporation Segment i.e Founding year, annual turnover, key brands etc.as of Mar 2019. Download it immediately and use it for your business.
-
 Cott corporation key facts of route based services division 2019
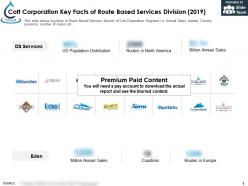
The information presented in this slide has been researched by our team of professional business analysts. This is part of our Company Profiles products selection, and you will need a Paid account to download the actual report with accurate data and sources. Downloaded report will be in Powerpoint and will contain the actual editable slides with the actual data and sources for each data. This slide shows key facts of Route Based Services division of Cott Corporation Segment i.e. Annual Sales, brands, Country presence, number of routes etc. Download it immediately and use it for your business.
-
 Cott corporation market position 2018
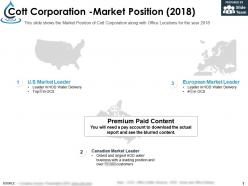
The information presented in this slide has been researched by our team of professional business analysts. This is part of our Company Profiles products selection, and you will need a Paid account to download the actual report with accurate data and sources. Downloaded report will be in Powerpoint and will contain the actual editable slides with the actual data and sources for each data. This slide shows the Market Position of Cott Corporation along with Office Locations for the year 2018. Download it immediately and use it for your business.
-
 Britvic plc advertising expenses 2014-18
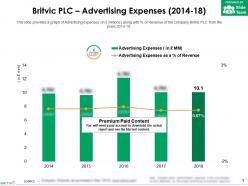
This is a professionally designed visual chart for Britvic Plc Advertising Expenses 2014 to 18. This is part of our Data and Statistics products selection, and you will need a Paid account to download the actual report with accurate data and sources. Downloaded report will contain the editable graph with accurate data, an excel table with the actual data, the exact source of the data and the release date. This slide provides a graph of Advertising Expenses in JPY millions along with percent of Revenue of the company Britvic PLC from the years 2014 to 18. Download it immediately and use it for your business.
-
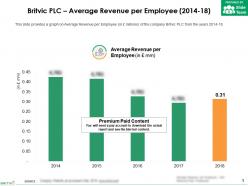 Britvic plc average revenue per employee 2014-18
This is a professionally designed visual chart for Britvic Plc Average Revenue Per Employee 2014 to 18. This is part of our Data and Statistics products selection, and you will need a Paid account to download the actual report with accurate data and sources. Downloaded report will contain the editable graph with accurate data, an excel table with the actual data, the exact source of the data and the release date. This slide provides a graph on Average Revenue per Employee in JPY millions of the company Britvic PLC from the years 2014 to 18. Download it immediately and use it for your business.
-
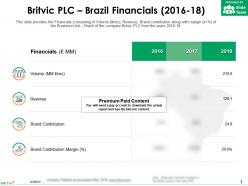 Britvic plc brazil financials 2016-18
This is a professionally designed visual chart for Britvic Plc Brazil Financials 2016 to 18. This is part of our Data and Statistics products selection, and you will need a Paid account to download the actual report with accurate data and sources. Downloaded report will contain the editable graph with accurate data, an excel table with the actual data, the exact source of the data and the release date. This slide provides the Financials consisting of Volume litres, Revenue, Brand contribution along with margin in percent of the Business Unit Brazil of the company Britvic PLC from the years 2016 to 18. Download it immediately and use it for your business.
-
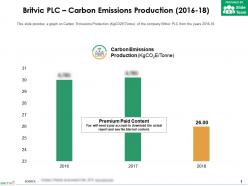 Britvic plc carbon emissions production 2016-18
This is a professionally designed visual chart for Britvic Plc Carbon Emissions Production 2016 to 18. This is part of our Data and Statistics products selection, and you will need a Paid account to download the actual report with accurate data and sources. Downloaded report will contain the editable graph with accurate data, an excel table with the actual data, the exact source of the data and the release date. This slide provides a graph on Carbon Emissions Production KgCO2E Tonne of the company Britvic PLC from the years 2016 to 18. Download it immediately and use it for your business.
-
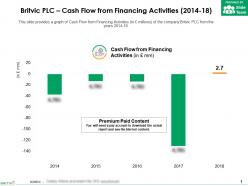 Britvic plc cash flow from financing activities 2014-18
This is a professionally designed visual chart for Britvic Plc Cash Flow From Financing Activities 2014 to 18. This is part of our Data and Statistics products selection, and you will need a Paid account to download the actual report with accurate data and sources. Downloaded report will contain the editable graph with accurate data, an excel table with the actual data, the exact source of the data and the release date. This slide provides a graph of Cash Flow from Financing Activities in JPY millions of the company Britvic PLC from the years 2014 to 18. Download it immediately and use it for your business.
-
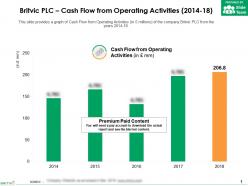 Britvic plc cash flow from operating activities 2014-18
This is a professionally designed visual chart for Britvic Plc Cash Flow From Operating Activities 2014 to 18. This is part of our Data and Statistics products selection, and you will need a Paid account to download the actual report with accurate data and sources. Downloaded report will contain the editable graph with accurate data, an excel table with the actual data, the exact source of the data and the release date. This slide provides a graph of Cash Flow from Operating Activities in JPY millions of the company Britvic PLC from the years 2014 to 18. Download it immediately and use it for your business.
-
 Britvic plc cash flow outflow from investing activities 2014-18
This is a professionally designed visual chart for Britvic Plc Cash Flow Outflow From Investing Activities 2014 to 18. This is part of our Data and Statistics products selection, and you will need a Paid account to download the actual report with accurate data and sources. Downloaded report will contain the editable graph with accurate data, an excel table with the actual data, the exact source of the data and the release date. This slide provides a graph of Cash Flow from Investing Activities in JPY millions of the company Britvic PLC from the years 2014 to 18. Download it immediately and use it for your business.
-
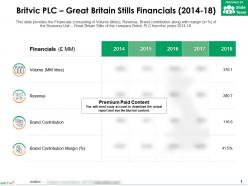 Britvic plc great britain stills financials 2014-18
This is a professionally designed visual chart for Britvic Plc Great Britain Stills Financials 2014 to 18. This is part of our Data and Statistics products selection, and you will need a Paid account to download the actual report with accurate data and sources. Downloaded report will contain the editable graph with accurate data, an excel table with the actual data, the exact source of the data and the release date. This slide provides the Financials consisting of Volume litres, Revenue, Brand contribution along with margin in percent of the Business Unit Great Britain Stills of the company Britvic PLC from the years 2014 to 18. Download it immediately and use it for your business.
-
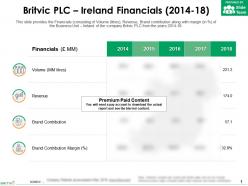 Britvic plc ireland financials 2014-18
This is a professionally designed visual chart for Britvic Plc Ireland Financials 2014 to 18. This is part of our Data and Statistics products selection, and you will need a Paid account to download the actual report with accurate data and sources. Downloaded report will contain the editable graph with accurate data, an excel table with the actual data, the exact source of the data and the release date. This slide provides the Financials consisting of Volume litres, Revenue, Brand contribution along with margin in percent of the Business Unit Ireland of the company Britvic PLC from the years 2014 to 18. Download it immediately and use it for your business.
-
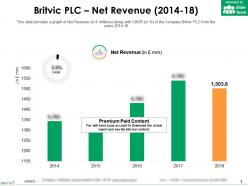 Britvic plc net revenue 2014-18
This is a professionally designed visual chart for Britvic Plc Net Revenue 2014 to 18. This is part of our Data and Statistics products selection, and you will need a Paid account to download the actual report with accurate data and sources. Downloaded report will contain the editable graph with accurate data, an excel table with the actual data, the exact source of the data and the release date. This slide provides a graph of Net Revenue in JPY millions along with CAGR in percent of the company Britvic PLC from the years 2014 to 18. Download it immediately and use it for your business.
-
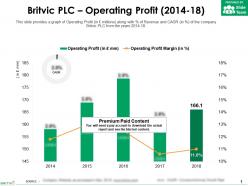 Britvic plc operating profit 2014-18
This is a professionally designed visual chart for Britvic Plc Operating Profit 2014 to 18. This is part of our Data and Statistics products selection, and you will need a Paid account to download the actual report with accurate data and sources. Downloaded report will contain the editable graph with accurate data, an excel table with the actual data, the exact source of the data and the release date. This slide provides a graph of Operating Profit in JPY millions along with percent of Revenue and CAGR in percent of the company Britvic PLC from the years 2014 to 18. Download it immediately and use it for your business.
-
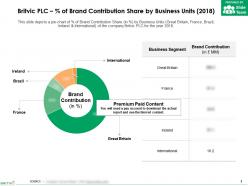 Britvic plc percent of brand contribution share by business units 2018
This is a professionally designed visual chart for Britvic Plc Percent Of Brand Contribution Share By Business Units 2018. This is part of our Data and Statistics products selection, and you will need a Paid account to download the actual report with accurate data and sources. Downloaded report will contain the editable graph with accurate data, an excel table with the actual data, the exact source of the data and the release date. This slide depicts a pie chart of percent of Brand Contribution Share in percent by Business Units Great Britain, France, Brazil, Ireland and International of the company Britvic PLC for the year 2018. Download it immediately and use it for your business.
-
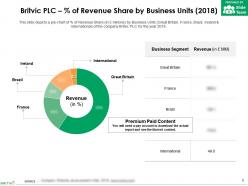 Britvic plc percent of revenue share by business units 2018
This is a professionally designed visual chart for Britvic Plc Percent Of Revenue Share By Business Units 2018. This is part of our Data and Statistics products selection, and you will need a Paid account to download the actual report with accurate data and sources. Downloaded report will contain the editable graph with accurate data, an excel table with the actual data, the exact source of the data and the release date. This slide depicts a pie chart of percent of Revenue Share in JPY millions by Business Units Great Britain, France, Brazil, Ireland and International of the company Britvic PLC for the year 2018. . Download it immediately and use it for your business.
-
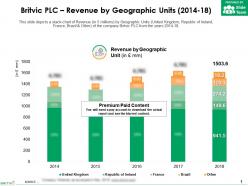 Britvic plc revenue by geographic units 2014-18
This is a professionally designed visual chart for Britvic Plc Revenue By Geographic Units 2014 to 18. This is part of our Data and Statistics products selection, and you will need a Paid account to download the actual report with accurate data and sources. Downloaded report will contain the editable graph with accurate data, an excel table with the actual data, the exact source of the data and the release date. This slide depicts a stack chart of Revenue in JPY millions by Geographic Units United Kingdom, Republic of Ireland, France, Brazil and Other of the company Britvic PLC from the years 2014 to 18. Download it immediately and use it for your business.
-
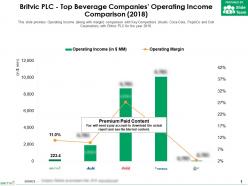 Britvic plc top beverage companies operating income comparison 2018
This is a professionally designed visual chart for Britvic Plc Top Beverage Companies Operating Income Comparison 2018. This is part of our Data and Statistics products selection, and you will need a Paid account to download the actual report with accurate data and sources. Downloaded report will contain the editable graph with accurate data, an excel table with the actual data, the exact source of the data and the release date. This slide provides Operating Income along with margin comparison with Key Competitors Asahi, Coca Cola, PepsiCo and Cott Corporation with Britvic PLC for the year 2018. Download it immediately and use it for your business.
-
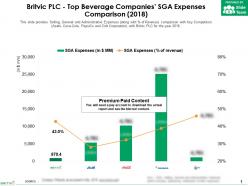 Britvic plc top beverage companies sga expenses comparison 2018
This is a professionally designed visual chart for Britvic Plc Top Beverage Companies SGA Expenses Comparison 2018. This is part of our Data and Statistics products selection, and you will need a Paid account to download the actual report with accurate data and sources. Downloaded report will contain the editable graph with accurate data, an excel table with the actual data, the exact source of the data and the release date. This slide provides Selling, General and Administrative Expenses along with percent of Revenue comparison with Key Competitors Asahi, Coca Cola, PepsiCo and Cott Corporation with Britvic PLC for the year 2018. Download it immediately and use it for your business.


