Retail and Trade Data Statistics PowerPoint Templates, PowerPoint Statistics Slides
- Sub Categories
-
- Agriculture
- Chemicals and Resources
- Construction
- Consumer Goods and FMCG
- E-Commerce
- Energy and Environmental Services
- Finance Insurance and Real Estate
- Health and Pharmaceuticals
- Internet
- Life
- Media and Advertising
- Metals and Electronics
- Retail and Trade
- Services
- Society
- Sports and Recreation
- Survey
- Technology and Telecommunications
- Transportation and Logistics
- Travel Tourism and Hospitality
- USA
-
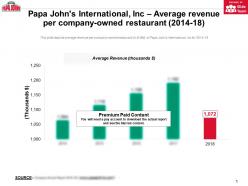 Papa johns international inc average revenue per company owned restaurant 2014-18
This is a professionally designed visual chart for Papa Johns International Inc Average Revenue Per Company Owned Restaurant 2014 to 18. This is part of our Data and Statistics products selection, and you will need a Paid account to download the actual report with accurate data and sources. Downloaded report will contain the editable graph with accurate data, an excel table with the actual data, the exact source of the data and the release date. This slide depicts average revenue per company owned restaurant in JPY MM of Papa Johns International, Inc for 2014 to 18. Download it immediately and use it for your business.
-
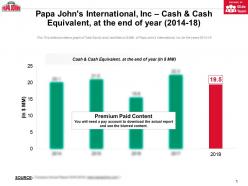 Papa johns international inc cash and cash equivalent at the end of year 2014-18
This is a professionally designed visual chart for Papa Johns International Inc Cash And Cash Equivalent At The End Of Year 2014 to 18. This is part of our Data and Statistics products selection, and you will need a Paid account to download the actual report with accurate data and sources. Downloaded report will contain the editable graph with accurate data, an excel table with the actual data, the exact source of the data and the release date. This This slide provides a graph of Total Equity and Liabilities in JPY MM of Papa Johns International, Inc for the years 2014 to 18. Download it immediately and use it for your business.
-
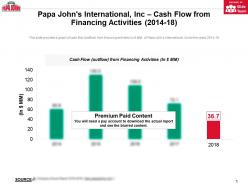 Papa johns international inc cash flow from financing activities 2014-18
This is a professionally designed visual chart for Papa Johns International Inc Cash Flow From Financing Activities 2014 to 18. This is part of our Data and Statistics products selection, and you will need a Paid account to download the actual report with accurate data and sources. Downloaded report will contain the editable graph with accurate data, an excel table with the actual data, the exact source of the data and the release date. This slide provides a graph of cash flow outflow from financing activities in JPY MM of Papa Johns International, Inc for the years 2014 to 18. Download it immediately and use it for your business.
-
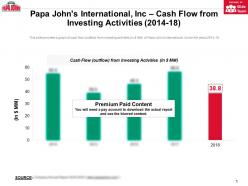 Papa johns international inc cash flow from investing activities 2014-18
This is a professionally designed visual chart for Papa Johns International Inc Cash Flow From Investing Activities 2014 to 18. This is part of our Data and Statistics products selection, and you will need a Paid account to download the actual report with accurate data and sources. Downloaded report will contain the editable graph with accurate data, an excel table with the actual data, the exact source of the data and the release date. This slide provides a graph of cash flow outflow from investing activities in JPY MM of Papa Johns International, Inc for the years 2014 to 18. Download it immediately and use it for your business.
-
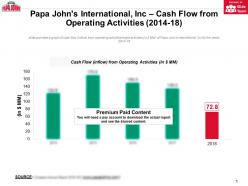 Papa johns international inc cash flow from operating activities 2014-18
This is a professionally designed visual chart for Papa Johns International Inc Cash Flow From Operating Activities 2014 to 18. This is part of our Data and Statistics products selection, and you will need a Paid account to download the actual report with accurate data and sources. Downloaded report will contain the editable graph with accurate data, an excel table with the actual data, the exact source of the data and the release date. This slide provides a graph of cash flow inflow from operating activities major activities in JPY MM of Papa Johns International, Inc for the years 2014 to 18. Download it immediately and use it for your business.
-
 Papa johns international inc company owned store 2014-18
This is a professionally designed visual chart for Papa Johns International Inc Company Owned Store 2014 to 18. This is part of our Data and Statistics products selection, and you will need a Paid account to download the actual report with accurate data and sources. Downloaded report will contain the editable graph with accurate data, an excel table with the actual data, the exact source of the data and the release date. This slide provides Company Owned Store Split of Papa Johns International, Inc by geography North America and International for the year 2014 to 18. Download it immediately and use it for your business.
-
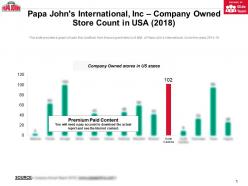 Papa johns international inc company owned store count in usa 2018
This is a professionally designed visual chart for Papa Johns International Inc Company Owned Store Count In USA 2018. This is part of our Data and Statistics products selection, and you will need a Paid account to download the actual report with accurate data and sources. Downloaded report will contain the editable graph with accurate data, an excel table with the actual data, the exact source of the data and the release date. This slide provides Company Owned Store Count in USA by states of Papa Johns International, Inc for the year 2018. Download it immediately and use it for your business.
-
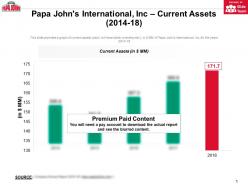 Papa johns international inc current assets 2014-18
This is a professionally designed visual chart for Papa Johns International Inc Current Assets 2014 to 18. This is part of our Data and Statistics products selection, and you will need a Paid account to download the actual report with accurate data and sources. Downloaded report will contain the editable graph with accurate data, an excel table with the actual data, the exact source of the data and the release date. This slide provides a graph of current assets cash, bill receivable, inventory etc. in JPY MM of Papa Johns International, Inc for the years 2014 to 18. Download it immediately and use it for your business.
-
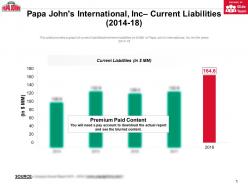 Papa johns international inc current liabilities 2014-18
This is a professionally designed visual chart for Papa Johns International Inc Current Liabilities 2014 to 18. This is part of our Data and Statistics products selection, and you will need a Paid account to download the actual report with accurate data and sources. Downloaded report will contain the editable graph with accurate data, an excel table with the actual data, the exact source of the data and the release date. This slide provides a graph of current liabilities short term liabilities in JPY MM of Papa Johns International, Inc for the years 2014 to 18. Download it immediately and use it for your business.
-
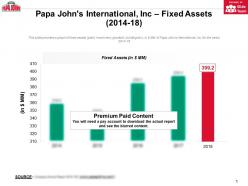 Papa johns international inc fixed assets 2014-18
This is a professionally designed visual chart for Papa Johns International Inc Fixed Assets 2014 to 18. This is part of our Data and Statistics products selection, and you will need a Paid account to download the actual report with accurate data and sources. Downloaded report will contain the editable graph with accurate data, an excel table with the actual data, the exact source of the data and the release date. This slide provides a graph of fixed assets plant, machinery, goodwill, building etc. in JPY MM of Papa Johns International, Inc for the years 2014 to 18. Download it immediately and use it for your business.
-
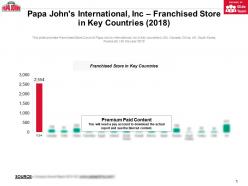 Papa johns international inc franchised store in key countries 2018
This is a professionally designed visual chart for Papa Johns International Inc Franchised Store In Key Countries 2018. This is part of our Data and Statistics products selection, and you will need a Paid account to download the actual report with accurate data and sources. Downloaded report will contain the editable graph with accurate data, an excel table with the actual data, the exact source of the data and the release date. This slide provides Franchised Store Count of Papa Johns International, Inc in Key countries USA, Canada, China, UK, South Korea, Russia etc. for the year 2018. Download it immediately and use it for your business.
-
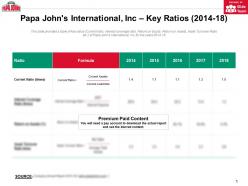 Papa johns international inc key ratios 2014-18
This is a professionally designed visual chart for Papa Johns International Inc Key Ratios 2014 to 18. This is part of our Data and Statistics products selection, and you will need a Paid account to download the actual report with accurate data and sources. Downloaded report will contain the editable graph with accurate data, an excel table with the actual data, the exact source of the data and the release date. This slide provides a table of key ratios Current ratio, interest coverage ratio, Return on Equity, Return on Assets, Asset Turnover Ratio etc. of Papa Johns International, Inc for the years 2014 to 18. Download it immediately and use it for your business.
-
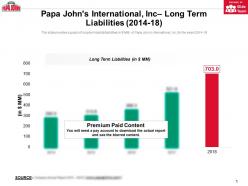 Papa johns international inc long term liabilities 2014-18
This is a professionally designed visual chart for Papa Johns International Inc Long Term Liabilities 2014 to 18. This is part of our Data and Statistics products selection, and you will need a Paid account to download the actual report with accurate data and sources. Downloaded report will contain the editable graph with accurate data, an excel table with the actual data, the exact source of the data and the release date. This slide provides a graph of long term debts liabilities in JPY MM of Papa Johns International, Inc for the years 2014 to 18. Download it immediately and use it for your business.
-
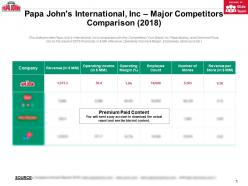 Papa johns international inc major competitors comparison 2018
This is a professionally designed visual chart for Papa Johns International Inc Major Competitors Comparison 2018. This is part of our Data and Statistics products selection, and you will need a Paid account to download the actual report with accurate data and sources. Downloaded report will contain the editable graph with accurate data, an excel table with the actual data, the exact source of the data and the release date. This slide provides Papa Johns International, Incs comparison with Key Competitors Yum Brand, Inc, Papa Murphy, and Dominos Pizza, Inc on the basis of 2018 Financials, in JPY MM Revenue, Operating Income and Margin, Employees, store count etc. Download it immediately and use it for your business.
-
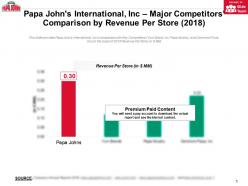 Papa johns international inc major competitors comparison by revenue per store 2018
This is a professionally designed visual chart for Papa Johns International Inc Major Competitors Comparison By Revenue Per Store 2018. This is part of our Data and Statistics products selection, and you will need a Paid account to download the actual report with accurate data and sources. Downloaded report will contain the editable graph with accurate data, an excel table with the actual data, the exact source of the data and the release date. This slide provides Papa Johns International, Incs comparison with Key Competitors Yum Brand, Inc, Papa Murphy, and Dominos Pizza, Inc on the basis of 2018 Revenue Per Store in JPY MM. Download it immediately and use it for your business.
-
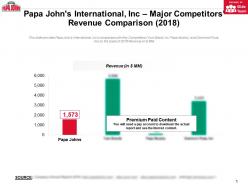 Papa johns international inc major competitors revenue comparison 2018
This is a professionally designed visual chart for Papa Johns International Inc Major Competitors Revenue Comparison 2018. This is part of our Data and Statistics products selection, and you will need a Paid account to download the actual report with accurate data and sources. Downloaded report will contain the editable graph with accurate data, an excel table with the actual data, the exact source of the data and the release date. This slide provides Papa Johns International, Incs comparison with Key Competitors Yum Brand, Inc, Papa Murphy, and Dominos Pizza, Inc on the basis of 2018 Revenue Per Store in JPY MM. Download it immediately and use it for your business.
-
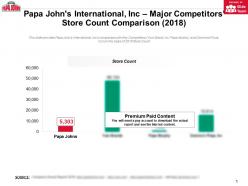 Papa johns international inc major competitors store count comparison 2018
This is a professionally designed visual chart for Papa Johns International Inc Major Competitors Store Count Comparison 2018. This is part of our Data and Statistics products selection, and you will need a Paid account to download the actual report with accurate data and sources. Downloaded report will contain the editable graph with accurate data, an excel table with the actual data, the exact source of the data and the release date. This slide provides Papa Johns International, Incs comparison with Key Competitors Yum Brand, Inc, Papa Murphy, and Dominos Pizza, Inc on the basis of 2018 Store Count. Download it immediately and use it for your business.
-
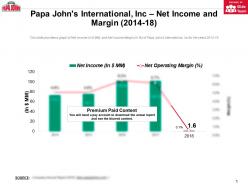 Papa johns international inc net income and margin 2014-18
This is a professionally designed visual chart for Papa Johns International Inc Net Income And Margin 2014 to 18. This is part of our Data and Statistics products selection, and you will need a Paid account to download the actual report with accurate data and sources. Downloaded report will contain the editable graph with accurate data, an excel table with the actual data, the exact source of the data and the release date. This slide provides a graph of Net income in JPY MM and Net income Margin in percent of Papa Johns International, Inc for the years 2014 to 18. Download it immediately and use it for your business.
-
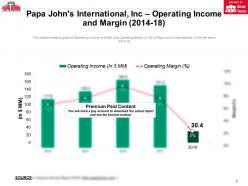 Papa johns international inc operating income and margin 2014-18
This is a professionally designed visual chart for Papa Johns International Inc Operating Income And Margin 2014 to 18. This is part of our Data and Statistics products selection, and you will need a Paid account to download the actual report with accurate data and sources. Downloaded report will contain the editable graph with accurate data, an excel table with the actual data, the exact source of the data and the release date. This slide provides a graph of Operating Income in JPY MM and Operating Margin in percent of Papa Johns International, Inc for the years 2014 to 18. Download it immediately and use it for your business.
-
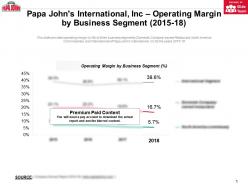 Papa johns international inc operating margin by business segment 2015-18
This is a professionally designed visual chart for Papa Johns International Inc Operating Margin By Business Segment 2015 to 18. This is part of our Data and Statistics products selection, and you will need a Paid account to download the actual report with accurate data and sources. Downloaded report will contain the editable graph with accurate data, an excel table with the actual data, the exact source of the data and the release date. This slide provides operating margin in percent of three business segments Domestic Company owned Restaurant, North America Commissaries, and International of Papa Johns International, Inc for the years 2015 to18. Download it immediately and use it for your business.
-
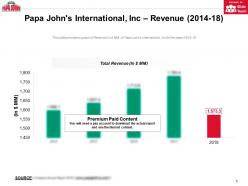 Papa johns international inc revenue 2014-18
This is a professionally designed visual chart for Papa Johns International Inc Revenue 2014 to 18. This is part of our Data and Statistics products selection, and you will need a Paid account to download the actual report with accurate data and sources. Downloaded report will contain the editable graph with accurate data, an excel table with the actual data, the exact source of the data and the release date. This slide provides a graph of Revenue in JPY MM of Papa Johns International, Inc for the years 2014 to 18. Download it immediately and use it for your business.
-
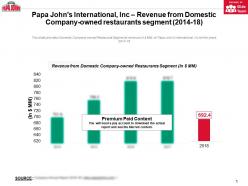 Papa johns international inc revenue from domestic company owned restaurants segment 2014-18
This is a professionally designed visual chart for Papa Johns International Inc Revenue From Domestic Company Owned Restaurants Segment 2014 to 18. This is part of our Data and Statistics products selection, and you will need a Paid account to download the actual report with accurate data and sources. Downloaded report will contain the editable graph with accurate data, an excel table with the actual data, the exact source of the data and the release date. This slide provides Domestic Company owned Restaurant Segments revenue in JPY MM of Papa Johns International, Inc for the years 2014 to 18. Download it immediately and use it for your business.
-
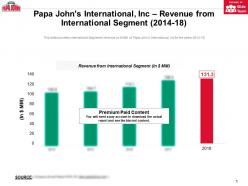 Papa johns international inc revenue from international segment 2014-18
This is a professionally designed visual chart for Papa Johns International Inc Revenue From International Segment 2014 to 18. This is part of our Data and Statistics products selection, and you will need a Paid account to download the actual report with accurate data and sources. Downloaded report will contain the editable graph with accurate data, an excel table with the actual data, the exact source of the data and the release date. This slide provides International Segments revenue in JPY MM of Papa Johns International, Inc for the years 2014 to 18. Download it immediately and use it for your business.
-
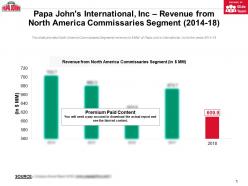 Papa johns international inc revenue from north america commissaries segment 2014-18
This is a professionally designed visual chart for Papa Johns International Inc Revenue From North America Commissaries Segment 2014 to 18. This is part of our Data and Statistics products selection, and you will need a Paid account to download the actual report with accurate data and sources. Downloaded report will contain the editable graph with accurate data, an excel table with the actual data, the exact source of the data and the release date. This slide provides North America Commissaries Segments revenue in JPY MM of Papa Johns International, Inc for the years 2014 to 18. Download it immediately and use it for your business.
-
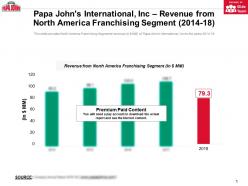 Papa johns international inc revenue from north america franchising segment 2014-18
This is a professionally designed visual chart for Papa Johns International Inc Revenue From North America Franchising Segment 2014 to 18. This is part of our Data and Statistics products selection, and you will need a Paid account to download the actual report with accurate data and sources. Downloaded report will contain the editable graph with accurate data, an excel table with the actual data, the exact source of the data and the release date. This slide provides North America Franchising Segments revenue in JPY MM of Papa Johns International, Inc for the years 2014 to 18. Download it immediately and use it for your business.
-
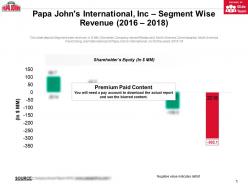 Papa johns international inc shareholders equity 2014-18
This is a professionally designed visual chart for Papa Johns International Inc Shareholders Equity 2014 to 18. This is part of our Data and Statistics products selection, and you will need a Paid account to download the actual report with accurate data and sources. Downloaded report will contain the editable graph with accurate data, an excel table with the actual data, the exact source of the data and the release date. This slide provides a graph of Shareholder Equity Total Equity in JPY MM of Papa Johns International, Inc for the years 2014 to 18. Download it immediately and use it for your business.
-
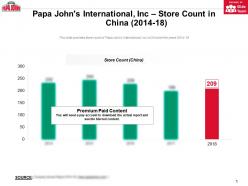 Papa johns international inc store count in china 2014-18
This is a professionally designed visual chart for Papa Johns International Inc Store Count In China 2014 to 18. This is part of our Data and Statistics products selection, and you will need a Paid account to download the actual report with accurate data and sources. Downloaded report will contain the editable graph with accurate data, an excel table with the actual data, the exact source of the data and the release date. This slide provides store count of Papa Johns International, Inc in China for the years 2014 to 18. Download it immediately and use it for your business.
-
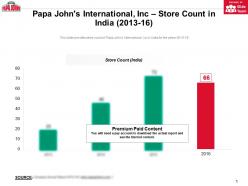 Papa johns international inc store count in india 2013-16
This is a professionally designed visual chart for Papa Johns International Inc Store Count In India 2013 to 16. This is part of our Data and Statistics products selection, and you will need a Paid account to download the actual report with accurate data and sources. Downloaded report will contain the editable graph with accurate data, an excel table with the actual data, the exact source of the data and the release date. This slide provides store count of Papa Johns International, Inc in India for the years 2013 to 16. Download it immediately and use it for your business.
-
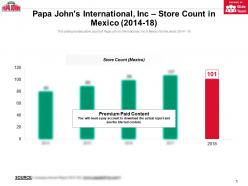 Papa johns international inc store count in mexico 2014-18
This is a professionally designed visual chart for Papa Johns International Inc Store Count In Mexico 2014 to 18. This is part of our Data and Statistics products selection, and you will need a Paid account to download the actual report with accurate data and sources. Downloaded report will contain the editable graph with accurate data, an excel table with the actual data, the exact source of the data and the release date. This slide provides store count of Papa Johns International, Inc in Mexico for the years 2014 to 18. Download it immediately and use it for your business.
-
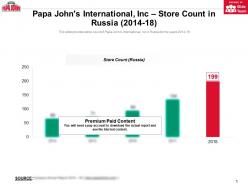 Papa johns international inc store count in russia 2014-18
This is a professionally designed visual chart for Papa Johns International Inc Store Count In Russia 2014 to 18. This is part of our Data and Statistics products selection, and you will need a Paid account to download the actual report with accurate data and sources. Downloaded report will contain the editable graph with accurate data, an excel table with the actual data, the exact source of the data and the release date. This slide provides store count of Papa Johns International, Inc in Russia for the years 2014 to 18. Download it immediately and use it for your business.
-
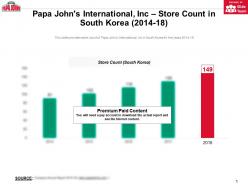 Papa johns international inc store count in south korea 2014-18
This is a professionally designed visual chart for Papa Johns International Inc Store Count In South Korea 2014 to 18. This is part of our Data and Statistics products selection, and you will need a Paid account to download the actual report with accurate data and sources. Downloaded report will contain the editable graph with accurate data, an excel table with the actual data, the exact source of the data and the release date. This slide provides store count of Papa Johns International, Inc in South Korea for the years 2014 to 18. Download it immediately and use it for your business.
-
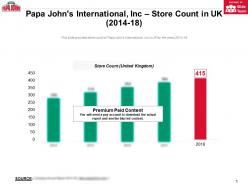 Papa johns international inc store count in uk 2014-18
This is a professionally designed visual chart for Papa Johns International Inc Store Count In UK 2014 to 18. This is part of our Data and Statistics products selection, and you will need a Paid account to download the actual report with accurate data and sources. Downloaded report will contain the editable graph with accurate data, an excel table with the actual data, the exact source of the data and the release date. This slide provides store count of Papa Johns International, Inc in UK for the years 2014 to 18. Download it immediately and use it for your business.
-
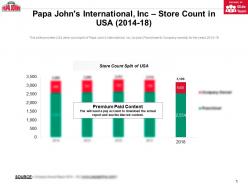 Papa johns international inc store count in usa 2014-18
This is a professionally designed visual chart for Papa Johns International Inc Store Count In USA 2014 to 18. This is part of our Data and Statistics products selection, and you will need a Paid account to download the actual report with accurate data and sources. Downloaded report will contain the editable graph with accurate data, an excel table with the actual data, the exact source of the data and the release date. This slide provides USA store count split of Papa Johns International, Inc by type Franchised and Company owned for the years 2014 to 18. Download it immediately and use it for your business.
-
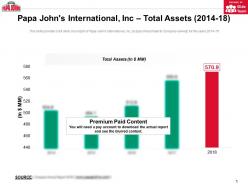 Papa johns international inc total assets 2014-18
This is a professionally designed visual chart for Papa Johns International Inc Total Assets 2014 to 18. This is part of our Data and Statistics products selection, and you will need a Paid account to download the actual report with accurate data and sources. Downloaded report will contain the editable graph with accurate data, an excel table with the actual data, the exact source of the data and the release date. This slide provides a graph of Total Assets Fixed and Current, in JPY MM of Papa Johns International, Inc for the years 2014 to 18. Download it immediately and use it for your business.
-
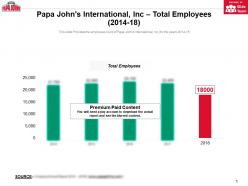 Papa johns international inc total employees 2014-18
This is a professionally designed visual chart for Papa Johns International Inc Total Employees 2014 to 18. This is part of our Data and Statistics products selection, and you will need a Paid account to download the actual report with accurate data and sources. Downloaded report will contain the editable graph with accurate data, an excel table with the actual data, the exact source of the data and the release date. This slide Provides the employee count of Papa Johns International, Inc for the years 2014 to 18. Download it immediately and use it for your business.
-
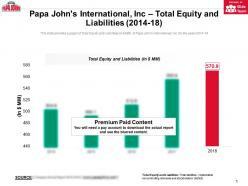 Papa johns international inc total equity and liabilities 2014-18
This is a professionally designed visual chart for Papa Johns International Inc Total Equity And Liabilities 2014 to 18. This is part of our Data and Statistics products selection, and you will need a Paid account to download the actual report with accurate data and sources. Downloaded report will contain the editable graph with accurate data, an excel table with the actual data, the exact source of the data and the release date. This This slide provides a graph of Total Equity and Liabilities in JPY MM of Papa Johns International, Inc for the years 2014 to 18. Download it immediately and use it for your business.
-
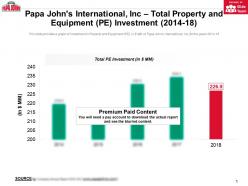 Papa johns international inc total property and equipment pe investment 2014-18
This is a professionally designed visual chart for Papa Johns International Inc Total Property And Equipment Pe Investment 2014 to 18. This is part of our Data and Statistics products selection, and you will need a Paid account to download the actual report with accurate data and sources. Downloaded report will contain the editable graph with accurate data, an excel table with the actual data, the exact source of the data and the release date. This slide provides a graph of investment in Property and Equipment PE, in JPY MM of Papa Johns International, Inc for the years 2014 to 18. Download it immediately and use it for your business.
-
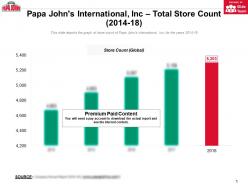 Papa johns international inc total store count 2014-18
This is a professionally designed visual chart for Papa Johns International Inc Total Store Count 2014 to 18. This is part of our Data and Statistics products selection, and you will need a Paid account to download the actual report with accurate data and sources. Downloaded report will contain the editable graph with accurate data, an excel table with the actual data, the exact source of the data and the release date. This slide depicts the graph of store count of Papa Johns International, Inc for the years 2014 to 18. Download it immediately and use it for your business.
-
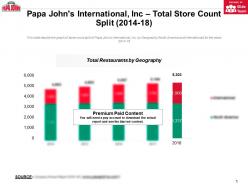 Papa johns international inc total store count split 2014-18
This is a professionally designed visual chart for Papa Johns International Inc Total Store Count Split 2014 to 18. This is part of our Data and Statistics products selection, and you will need a Paid account to download the actual report with accurate data and sources. Downloaded report will contain the editable graph with accurate data, an excel table with the actual data, the exact source of the data and the release date. This This slide depicts the graph of store count split of Papa Johns International, Inc by Geography North America and International for the years 2014 to 18. Download it immediately and use it for your business.
-
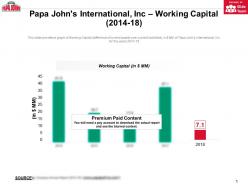 Papa johns international inc working capital 2014-18
This is a professionally designed visual chart for Papa Johns International Inc Working Capital 2014 to 18. This is part of our Data and Statistics products selection, and you will need a Paid account to download the actual report with accurate data and sources. Downloaded report will contain the editable graph with accurate data, an excel table with the actual data, the exact source of the data and the release date. This slide provides a graph of Working Capital difference of current assets over current liabilities in JPY MM of Papa Johns International, Inc for the years 2014 to 18. Download it immediately and use it for your business.
-
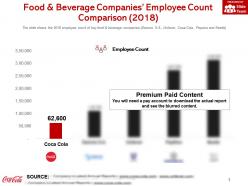 Food and beverage companies employee count comparison 2018
This is a professionally designed visual chart for Food And Beverage Companies Employee Count Comparison 2018. This is part of our Data and Statistics products selection, and you will need a Paid account to download the actual report with accurate data and sources. Downloaded report will contain the editable graph with accurate data, an excel table with the actual data, the exact source of the data and the release date. The slide shows the 2018 employee count of key food and beverage companies Danone S.A, Unilever, Coca-Cola, Pepsico and Nestle. Download it immediately and use it for your business.
-
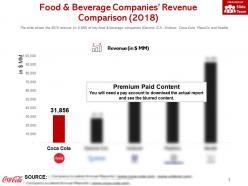 Food and beverage companies revenue comparison 2018
This is a professionally designed visual chart for Food And Beverage Companies Revenue Comparison 2018. This is part of our Data and Statistics products selection, and you will need a Paid account to download the actual report with accurate data and sources. Downloaded report will contain the editable graph with accurate data, an excel table with the actual data, the exact source of the data and the release date. The slide shows the 2018 revenue in JPY MM of key food and beverage companies Danone S.A, Unilever, Coca-Cola, PepsiCo and Nestle. Download it immediately and use it for your business.
-
 Market share of carbonated beverages 2018
This is a professionally designed visual chart for Market Share Of Carbonated Beverages 2018. This is part of our Data and Statistics products selection, and you will need a Paid account to download the actual report with accurate data and sources. Downloaded report will contain the editable graph with accurate data, an excel table with the actual data, the exact source of the data and the release date. The slide shows the 2018 SGA expenses in JPY MM and SGA expenses, as percent of revenue of key food and beverage companies Danone S.A, Unilever, Coca-Cola, Pepsico and Nestle. Download it immediately and use it for your business.
-
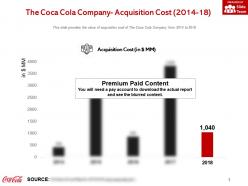 The coca cola company acquisition cost 2014-18
This is a professionally designed visual chart for The Coca Cola Company Acquisition Cost 2014 to 18. This is part of our Data and Statistics products selection, and you will need a Paid account to download the actual report with accurate data and sources. Downloaded report will contain the editable graph with accurate data, an excel table with the actual data, the exact source of the data and the release date. This slide provides the value of acquisition cost of The Coca Cola Company from 2014 to 2018. Download it immediately and use it for your business.
-
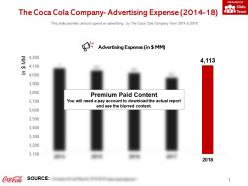 The coca cola company advertising expense 2014-18
This is a professionally designed visual chart for The Coca Cola Company Advertising Expense 2014 to 18. This is part of our Data and Statistics products selection, and you will need a Paid account to download the actual report with accurate data and sources. Downloaded report will contain the editable graph with accurate data, an excel table with the actual data, the exact source of the data and the release date. This slide provides amount spend on advertising by The Coca Cola Company from 2014 to 2018. Download it immediately and use it for your business.
-
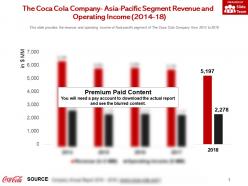 The coca cola company asia pacific segment revenue and operating income 2014-18
This is a professionally designed visual chart for The Coca Cola Company Asia Pacific Segment Revenue And Operating Income 2014 to 18. This is part of our Data and Statistics products selection, and you will need a Paid account to download the actual report with accurate data and sources. Downloaded report will contain the editable graph with accurate data, an excel table with the actual data, the exact source of the data and the release date. This slide provides the revenue and operating income of Asia-pacific segment of The Coca Cola Company from 2014 to 2018. Download it immediately and use it for your business.
-
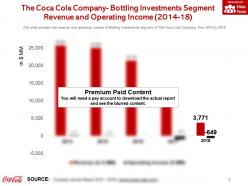 The coca cola company bottling investments segment revenue and operating income 2014-18
This is a professionally designed visual chart for The Coca Cola Company Bottling Investments Segment Revenue And Operating Income 2014 to 18. This is part of our Data and Statistics products selection, and you will need a Paid account to download the actual report with accurate data and sources. Downloaded report will contain the editable graph with accurate data, an excel table with the actual data, the exact source of the data and the release date. This slide provides the revenue and operating income of Bottling Investments segment of The Coca Cola Company from 2014 to 2018. Download it immediately and use it for your business.
-
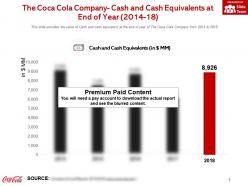 The coca cola company cash and cash equivalents at end of year 2014-18
This is a professionally designed visual chart for The Coca Cola Company Cash And Cash Equivalents At End Of Year 2014 to 18. This is part of our Data and Statistics products selection, and you will need a Paid account to download the actual report with accurate data and sources. Downloaded report will contain the editable graph with accurate data, an excel table with the actual data, the exact source of the data and the release date. This slide provides the value of Cash and cash equivalent at the end of year of The Coca Cola Company from 2014 to 2018. Download it immediately and use it for your business.
-
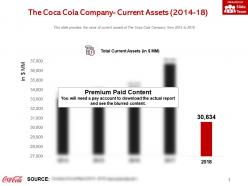 The coca cola company current assets 2014-18
This is a professionally designed visual chart for The Coca Cola Company Current Assets 2014 to 18. This is part of our Data and Statistics products selection, and you will need a Paid account to download the actual report with accurate data and sources. Downloaded report will contain the editable graph with accurate data, an excel table with the actual data, the exact source of the data and the release date. This slide provides the value of current assets of The Coca Cola Company from 2014 to 2018. Download it immediately and use it for your business.
-
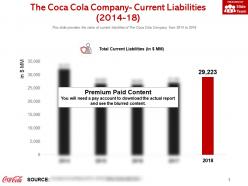 The coca cola company current liabilities 2014-18
This is a professionally designed visual chart for The Coca Cola Company Current Liabilities 2014 to 18. This is part of our Data and Statistics products selection, and you will need a Paid account to download the actual report with accurate data and sources. Downloaded report will contain the editable graph with accurate data, an excel table with the actual data, the exact source of the data and the release date. This slide provides the value of current liabilities of The Coca Cola Company from 2014 to 2018. Download it immediately and use it for your business.
-
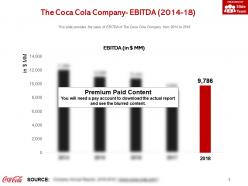 The coca cola company ebitda 2014-18
This is a professionally designed visual chart for The Coca Cola Company EBITDA 2014 to 18. This is part of our Data and Statistics products selection, and you will need a Paid account to download the actual report with accurate data and sources. Downloaded report will contain the editable graph with accurate data, an excel table with the actual data, the exact source of the data and the release date. This slide provides the value of EBITDA of The Coca Cola Company from 2014 to 2018. Download it immediately and use it for your business.
-
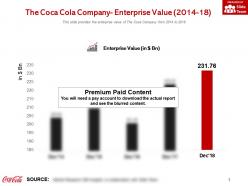 The coca cola company enterprise value 2014-18
This is a professionally designed visual chart for The Coca Cola Company Enterprise Value 2014 to 18. This is part of our Data and Statistics products selection, and you will need a Paid account to download the actual report with accurate data and sources. Downloaded report will contain the editable graph with accurate data, an excel table with the actual data, the exact source of the data and the release date. This slide provides the enterprise value of The Coca Company from 2014 to 2018. Download it immediately and use it for your business.
-
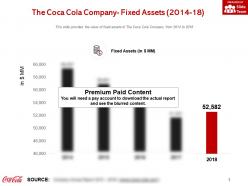 The coca cola company fixed assets 2014-18
This is a professionally designed visual chart for The Coca Cola Company Fixed Assets 2014 to 18. This is part of our Data and Statistics products selection, and you will need a Paid account to download the actual report with accurate data and sources. Downloaded report will contain the editable graph with accurate data, an excel table with the actual data, the exact source of the data and the release date. This slide provides the value of fixed assets of The Coca Cola Company from 2014 to 2018. Download it immediately and use it for your business.
-
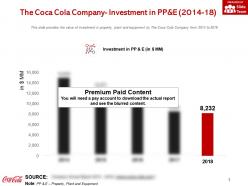 The coca cola company investment in pp and e 2014-18
This is a professionally designed visual chart for The Coca Cola Company Investment In PP And E 2014 to 18. This is part of our Data and Statistics products selection, and you will need a Paid account to download the actual report with accurate data and sources. Downloaded report will contain the editable graph with accurate data, an excel table with the actual data, the exact source of the data and the release date. This slide provides the value of investment in property, plant and equipment by The Coca Cola Company form 2014 to 2018. Download it immediately and use it for your business.
-
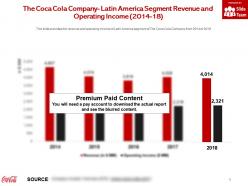 The coca cola company latin america segment revenue and operating income 2014-18
This is a professionally designed visual chart for The Coca Cola Company Latin America Segment Revenue And Operating Income 2014 to 18. This is part of our Data and Statistics products selection, and you will need a Paid account to download the actual report with accurate data and sources. Downloaded report will contain the editable graph with accurate data, an excel table with the actual data, the exact source of the data and the release date. This slide provides the revenue and operating income of Latin America segment of The Coca Cola Company from 2014 to 2018. Download it immediately and use it for your business.
-
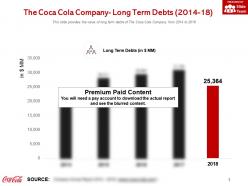 The coca cola company long term debts 2014-18
This is a professionally designed visual chart for The Coca Cola Company Long Term Debts 2014 to 18. This is part of our Data and Statistics products selection, and you will need a Paid account to download the actual report with accurate data and sources. Downloaded report will contain the editable graph with accurate data, an excel table with the actual data, the exact source of the data and the release date. This slide provides the value of long term debts of The Coca Cola Company from 2014 to 2018. Download it immediately and use it for your business.
-
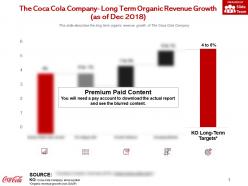 The coca cola company long term organic revenue growth as of dec 2018
This is a professionally designed visual chart for The Coca Cola Company Long Term Organic Revenue Growth As Of Dec 2018. This is part of our Data and Statistics products selection, and you will need a Paid account to download the actual report with accurate data and sources. Downloaded report will contain the editable graph with accurate data, an excel table with the actual data, the exact source of the data and the release date. This slide describes the long term organic revenue growth of The Coca Cola Company. Download it immediately and use it for your business.
-
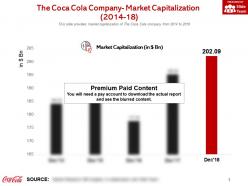 The coca cola company market capitalization 2014-18
This is a professionally designed visual chart for The Coca Cola Company Market Capitalization 2014 to 18. This is part of our Data and Statistics products selection, and you will need a Paid account to download the actual report with accurate data and sources. Downloaded report will contain the editable graph with accurate data, an excel table with the actual data, the exact source of the data and the release date. This slide provides market capitalization of The Coca Cola company from 2014 to 2018. Download it immediately and use it for your business.
-
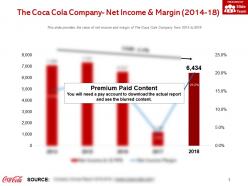 The coca cola company net income and margin 2014-18
This is a professionally designed visual chart for The Coca Cola Company Net Income And Margin 2014 to 18. This is part of our Data and Statistics products selection, and you will need a Paid account to download the actual report with accurate data and sources. Downloaded report will contain the editable graph with accurate data, an excel table with the actual data, the exact source of the data and the release date. This slide provides the value of net income and margin of The Coca Cola Company from 2014 to 2018. Download it immediately and use it for your business.
-
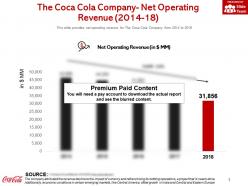 The coca cola company net operating revenue 2014-18
This is a professionally designed visual chart for The Coca Cola Company Net Operating Revenue 2014 to 18. This is part of our Data and Statistics products selection, and you will need a Paid account to download the actual report with accurate data and sources. Downloaded report will contain the editable graph with accurate data, an excel table with the actual data, the exact source of the data and the release date. This slide provides net operating revenue for The Coca Cola Company from 2014 to 2018. Download it immediately and use it for your business.


