Data scientist life cycle of data science ppt diagrams
Try Before you Buy Download Free Sample Product
Audience
Editable
of Time
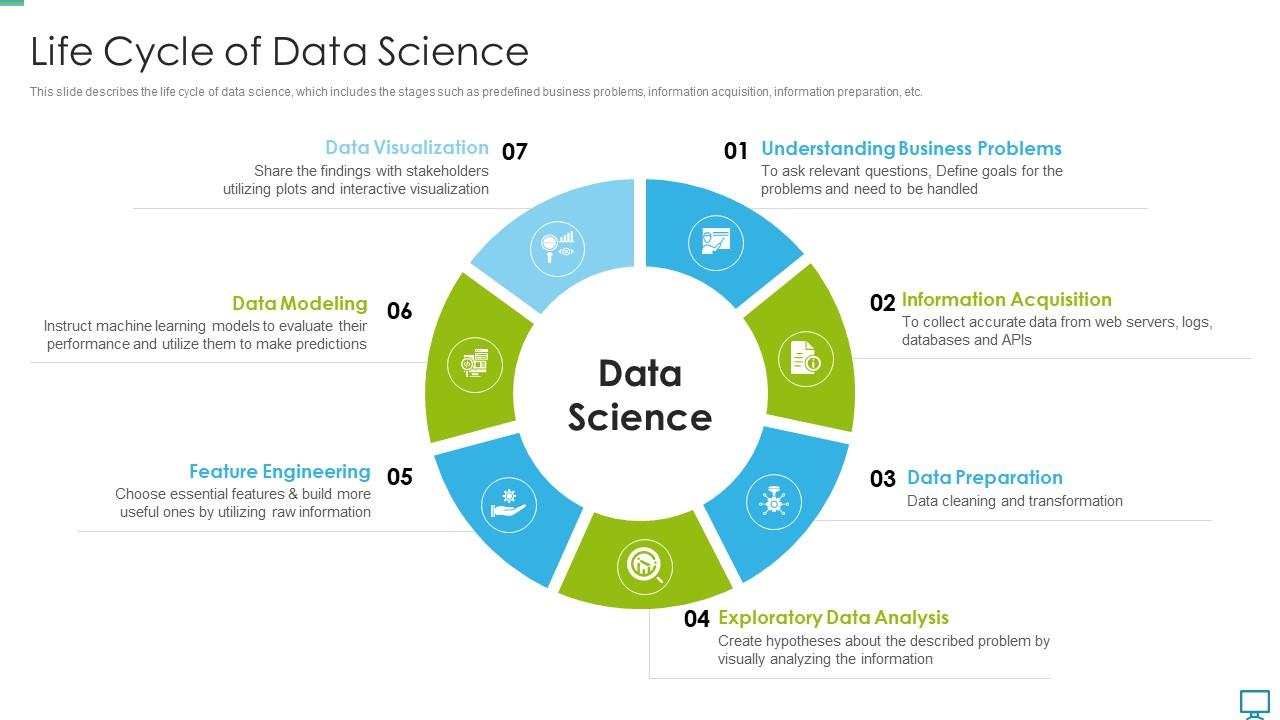
This slide describes the life cycle of data science, which includes the stages such as predefined business problems, information acquisition, information preparation, etc.
People who downloaded this PowerPoint presentation also viewed the following :
Data scientist life cycle of data science ppt diagrams with all 6 slides:
Use our Data Scientist Life Cycle Of Data Science Ppt Diagrams to effectively help you save your valuable time. They are readymade to fit into any presentation structure.
FAQs for Data scientist life cycle of data
So there's basically six phases to the whole thing - business understanding, data understanding, prep, modeling, evaluation, and deployment. First you figure out what problem you're actually trying to solve (sounds obvious but trust me, people skip this). Then you dig into whatever data you've got. Fair warning: data prep will eat like 80% of your time, it's such a pain but necessary. After that comes the fun part - building models, testing how well they work, then getting them live. Oh and it's super messy, not linear at all. You'll keep jumping back to fix earlier stuff constantly.
Honestly, this is where most projects totally fall apart. You'll waste months building something amazing that nobody actually needs - trust me, I've watched it happen so many times. The whole thing hinges on nailing down what problem you're really solving. Otherwise you're just throwing fancy algorithms at the wall hoping something works. Choosing your data, picking methods, knowing if you succeeded - all depends on getting this right first. My take? Spend way longer here than feels reasonable. Keep checking back with people to make sure you didn't drift off solving some completely different thing.
Honestly, data collection will make or break everything. I've seen so many projects fail because people rushed this part - you get biased or incomplete data, and then your fancy models are basically useless. Garbage in, garbage out, right? Make sure your data actually represents the problem you're trying to solve. Cover the right time periods, include variables that matter. Bad collection means your model won't work in the real world. Trust me on this - spend way more time understanding your data sources than you think you need. It's boring but it'll save you later.
Dude, data cleaning is everything - garbage in, garbage out. Missing values? Your model just ignores whole customer groups. Outliers will completely wreck your stats, and messy formats break joins every time. I literally watched a project crash because someone forgot about duplicate records (so frustrating). You'll end up with biased samples and predictions that are totally off. Short sentences hit different sometimes. Document what you did though, or you'll be scratching your head later trying to figure out where things went sideways.
First things first - check your data quality. Missing values, weird outliers, basic data types. Once that's sorted, histograms and summary stats will show you what you're working with distribution-wise. Honestly gets pretty addictive once you start seeing patterns emerge. Correlation matrices and scatter plots are your best friends for spotting relationships between variables. Box plots too. Oh, and definitely slice your data by different categories - you'd be surprised what pops up. Keep notes as you go because you'll forget half the cool stuff you find otherwise.
Feature engineering can totally transform your model's performance - you're giving the algorithm better clues to work with. Like turning timestamps into "is it Monday?" or combining variables to show relationships the model wouldn't catch otherwise. Domain knowledge is huge here; you need to understand your problem well enough to create features that actually make sense. Even basic stuff like scaling or binning helps more than you'd think. I always start by just poking around the data first, seeing what jumps out. Let those patterns tell you what new features might be worth building.
Honestly, k-fold cross-validation is where I'd start - it's super reliable for catching overfitting since you're testing on different data chunks. Hold-out validation works too if you've got massive datasets. AIC and BIC are solid for mathematical comparisons, though they can feel pretty abstract (I sometimes forget what they're actually measuring lol). Grid search with hyperparameter tuning is clutch for fine-tuning stuff. You could also try ensemble methods, but that might be overkill depending on what you're working with. Just begin with basic cross-validation and build from there - no point overcomplicating things right off the bat.
So it really comes down to what problem you're solving. Classification? Go with accuracy, precision, recall, or F1 - depends if false positives vs negatives hurt your business more. Regression uses MAE, RMSE, or R-squared for prediction errors. Time series is where things get weird with MAPE and forecast accuracy. Clustering relies on silhouette scores or inertia instead. Pick whatever actually matches your business goals, not just what's simple to compute. I made that mistake early on and wasted so much time optimizing for the wrong thing!
Honestly, visualization is a game-changer because it makes your data actually digestible. You can talk statistics all day, but one solid chart? People get it immediately. Non-tech folks can spot trends and weird outliers without drowning in spreadsheets - which, let's be real, nobody wants to stare at for hours. Plus visuals stick in people's heads way better. The trick is picking the right chart type and not cramming everything into one messy graph. Clean beats comprehensive every time.
Dude, version control is everything - Git for your code/notebooks, pin those package versions, and document your data sources like crazy. I literally couldn't reproduce results from last month because I was lazy about this stuff. Write READMEs that actually explain how to run things step by step. Future you will thank you, trust me. Oh and create some kind of project template - doesn't have to be fancy, just consistent. The whole point is someone else should be able to follow your process and get identical results. Seriously saves so much pain later.
Three main things to nail down: versioning, monitoring, and rollback plans. Version everything - models, code, the works. When stuff inevitably breaks at 2am, you'll be grateful you can see exactly what's deployed where. Monitor for data drift and performance drops with automated alerts. Don't go live all at once though - do gradual rollouts with A/B tests or canary deployments. Honestly, rollback strategies are probably the most critical part since models will degrade over time. Start simple with basic logging and build from there. Oh, and definitely test your rollback process before you actually need it!
Look, your models will get outdated fast if you don't keep feeding them fresh data. Real-world outcomes teach them way more than just that initial training data ever could. When accuracy starts tanking or users start behaving differently, feedback loops catch that stuff before everything goes to hell. Static models? They're basically blind to this. You'll want monitoring dashboards running automatically - honestly, it's a game changer for spotting issues early. Schedule regular retraining sessions too, because you're either improving or you're falling behind. Data drift is sneaky like that.
Honestly, don't just slap ethics on at the end - weave it through everything from day one. When you're collecting data, make sure you've got proper consent and aren't pulling from sketchy biased sources. During analysis, keep checking if your models are screwing over certain groups unfairly. I get that it feels like more work upfront, but fixing bias after you've deployed is a nightmare. Document your choices as you go, bring in diverse voices early (like, actually early), and audit regularly for weird unintended stuff. Oh, and set up ethics checkpoints like you would code reviews - same energy, different focus.
Honestly, bias hunting has to happen at every single step - can't just check once and call it good. First look at your data sources and sampling methods for any gaps across different demographics. Then during modeling, test how it performs on various subsets because disparate outcomes are a dead giveaway. I've seen way too many teams skip this part when they're rushing to ship something. Fairness metrics like equalized odds help you actually measure the bias instead of just guessing. Re-sampling and algorithmic debiasing techniques work pretty well too. Get diverse people reviewing your work and keep auditing after deployment since this stuff creeps back in.
Honestly, GitHub or GitLab are must-haves for version control - can't work without them. Jupyter notebooks work great if everyone's using the same environment. AWS SageMaker and Google Colab are solid for cloud stuff. Obviously you'll need Slack or Teams, but face-to-face convos still beat everything when you're debugging weird model behavior. Notion or Confluence help document experiments so people actually know what you tried. Here's the thing though - pick tools your team will use consistently. Doesn't matter how fancy something is if Sarah never logs in and Mike's still emailing CSV files.
-
Very unique, user-friendly presentation interface.
-
Out of the box and creative design.