


Database Relationship Diagram For Employee Payroll Management System


Try Before you Buy Download Free Sample Product
 Impress Your
 Audience
Editable
of Time


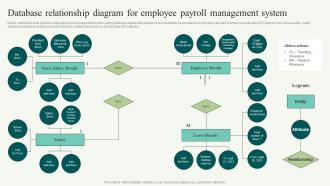
Below mentioned slide exhibits employee payroll management system using database relationship diagram which assist the businesses in storing large amount of employee data using ER diagram tool. Gross salary, salary, employee and leave details are some of the key entities which can be stored in the ER software.
People who downloaded this PowerPoint presentation also viewed the following :
Database Relationship Diagram For Employee Payroll Management System with all 6 slides:
Use our Database Relationship Diagram For Employee Payroll Management System to effectively help you save your valuable time. They are readymade to fit into any presentation structure.


FAQs for Database Relationship Diagram For Employee
So DRDs have entities (basically your tables), attributes (the fields inside), and relationships showing how tables link up. Primary keys and foreign keys are in there too, plus cardinality stuff that tells you if it's one-to-one, one-to-many, whatever. Those connecting lines are honestly the most useful part - they show how your data actually flows through everything. I always start by finding the main entities first, then I just follow the lines to see how it all connects. Makes way more sense than trying to understand the whole thing at once.
Seriously, don't skip the entity/attribute mapping - it'll save you so much headache later. When you nail down what each entity actually represents and list its attributes clearly, you're building a roadmap everyone can understand. Trust me, I've watched projects crash because people rushed through this part thinking they could wing it. You'll spot redundant data early, catch missing table relationships, and actually build something that works for the business needs. Yeah it's tedious upfront, but way better than rebuilding your whole database structure six months down the line when everything's already broken.
So primary keys are basically like ID badges for each record in your table - they make everything unique. Foreign keys do the actual connecting work by pointing to another table's primary key. That's how you get relationships instead of just random tables sitting there doing nothing (which would be pretty useless lol). The diagram will show lines between foreign keys and their matching primary keys - shows you exactly how data moves around. Oh and definitely figure out these key relationships before you start building everything else. Trust me, you'll thank yourself later when you're not pulling your hair out writing queries.
So ERDs are more about the big picture - like how customers connect to orders, that kind of business stuff. Way easier to show your boss or clients since they actually make sense to non-tech people. DRDs though? That's where the real database work happens. Foreign keys, data types, all the technical bits you need when you're actually building or fixing things. Honestly, I always start with ERDs for planning, then switch to DRDs when I'm knee-deep in SQL. You can't really write good queries without knowing the actual table structure. Both have their place, just depends what you're doing.
Honestly? DRDs are clutch when you just need to show how tables connect without all the messy field details. Perfect for talking to stakeholders who don't care about data types and constraints - they just want the big picture. I always start with these when I'm presenting to non-tech people or mapping out legacy systems. ERDs are great but they can be information overload, you know? Save those for later when you're actually building stuff. Also super useful for database migrations - gives you that clean overview of relationships without getting bogged down in the weeds. Much easier to digest.
Think of normalization as cleaning up your data mess before you draw anything. You're using those rules (1NF, 2NF, 3NF) to split everything into logical tables and kill redundancy. Otherwise your ERD becomes this nightmare with duplicate info scattered everywhere - trust me, I've been there. Short version: normalize first, then the relationships pop out naturally when you're connecting tables. It's like organizing your closet before deciding what goes where. Way easier to see what actually belongs together once the clutter's gone.
So basically, a DRD gives everyone the same visual map to work from. You know those painful meetings where people just talk past each other? This actually fixes that - non-tech people can see how data flows instead of drowning in code explanations. Developers don't get confused about the structure anymore. Business folks can spot what's missing or suggest changes way easier. Honestly, once you start using diagrams like this, going back to text-heavy explanations feels brutal. Just make sure you keep updating it as things change.
So you've got rectangles for entities (Customer, Order, whatever), diamonds for relationships, and ovals for attributes. Pretty straightforward once you see it laid out. Those little crow's feet things show cardinality - basically one-to-one or one-to-many relationships. Primary keys get underlined, foreign keys might have dashed lines but honestly that varies. My advice? Figure out your entities first, then add the relationship stuff after. Way less overwhelming that way. It does look like some weird flowchart initially, but it'll make sense faster than you think.
So basically, those relationship diagrams are like a roadmap for keeping your data clean. They show how tables connect through foreign keys, which stops you from accidentally creating orphaned records. Like, you can't delete a customer who still has orders - the database won't let you. I always think it's wild how something visual becomes this protective layer for your data. You'll also catch weird issues early, like circular dependencies or missing validation rules. Honestly just use your ERD as a guide when you're setting up constraints and cascade rules.
Start with your main tables and primary keys - that's your foundation. Naming conventions matter way more than you think, so skip cryptic abbreviations. Seriously, "usr_pmt_hist" will haunt you later. Group related tables together and use colors to separate different areas of your system. Show all your relationships clearly - one-to-many, many-to-many, whatever. Don't skip the foreign key constraints either. Here's what actually works: print the damn thing out and walk through real scenarios. You'll catch design flaws immediately. Oh, and add quick descriptions for anything remotely complex.
Honestly, just use software for ERDs - drawing them by hand is such a pain. I like draw.io since it's free and pretty intuitive. Lucidchart's solid too, or MySQL Workbench if you're already using MySQL. You can drag tables around, auto-connect relationships, and here's the cool part - some tools will actually read your existing database and build the diagram for you. No more having diagrams that don't match what you actually built (been there, it's embarrassing). When you change your schema later, good tools will update everything automatically. Saves so much headache down the road.
Honestly, the biggest mistake is making everything way too complicated from day one. You'll just confuse yourself and everyone else. Missing those key connections between entities is super common too, especially when you're trying to rush through it. I learned this the hard way - always get the actual users involved early or you'll build something that looks perfect on paper but totally misses how people actually work. Oh and think about growth from the start, but don't overthink it. Keep checking with stakeholders and focus on what the business actually needs.
So many-to-many relationships need a junction table between your main entities. Take Students and Courses - you'd make a StudentCourses table with both primary keys as foreign keys. Super common stuff, honestly I draw these all the time. It breaks your M:N into two separate one-to-many relationships instead. Draw lines from each main table to the junction table showing those 1:M connections. Oh and here's something useful - throw any relationship-specific data (like enrollment date or whatever) right into that junction table. Makes life way easier later.
Database relationships mess with your query speed big time - it's all about how joins work and where you put indexes. Foreign keys need to be indexed or you'll hate your life when the engine tries matching records. One-to-many? Usually not bad. But many-to-many with junction tables will absolutely wreck performance if you're sloppy about it. Honestly, half the time people join way more tables than they actually need. Check your execution plans first - they'll tell you exactly what's choking. Sometimes the fix is just dropping unnecessary joins.
Just throw those diagram files right into your Git repo with everything else - way easier than juggling separate systems. Most tools like draw.io or Lucidchart export to Git-friendly formats anyway. When you update diagrams, write decent commit messages and maybe branch out for big schema changes. Oh, and definitely get someone else to review before merging. I learned that one the hard way when I accidentally nuked a whole relationship table from our docs last year. Your team will actually keep the diagrams updated if they're sitting right there with the code instead of buried in some random tool.
-
One word for SlideTeam–Versatile!
-
Use of different colors is good. It's simple and attractive.