


Decision Support System DSS Powerpoint Presentation Slides





Try Before you Buy Download Free Sample Product
 Impress Your
 Audience
 100%
100% Editable
 Save Hours
 of Time


A corporation or other organizations data warehousing is the safe electronic storing of information. The objective of data warehousing is to build a treasure mine of historical data that can be accessed and analyzed to offer helpful insight into the business operations. Here is a professionally designed template on Decision Support System DSS that presents the companys current situation, gap analysis, the need for a data warehouse in the business, OLAP, OLTP, ETL, Schemas, MPP, etc. In this template, we have covered the features of data warehouse different architectures such as primary, three-tier, etc. Moreover, in this DSS, we have included various types of data warehouses, cloud and modern data warehouses, components, general stages, etc. In addition, this PPT contains working of data warehouse, data warehouse design guidelines, approaches such as top-down and bottom-up, implementation of data warehouse, etc. Furthermore, this template includes comparing data warehouse with other storage systems such as database, operational database system, Data Lake, and data mart. Lastly, this deck comprises the impacts of data warehouse implementation on business, a 30-60-90 days plan, a roadmap to implement a data warehouse, and a dashboard. Get access now.
People who downloaded this PowerPoint presentation also viewed the following :
Content of this Powerpoint Presentation
Slide 1: This slide introduces Decision Support System (DSS). State your company name and begin.
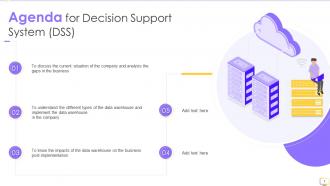
Slide 2: This slide states Agenda of the presentation.
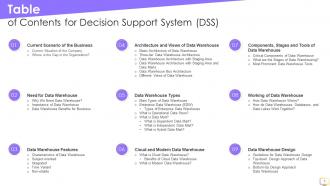
Slide 3: This slide presents Table of Content for the presentation.
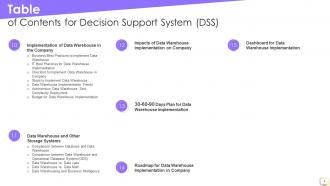
Slide 4: This is another slide continuing Table of Content for the presentation.
Slide 5: This slide highlights title for topics that are to be covered next in the template.
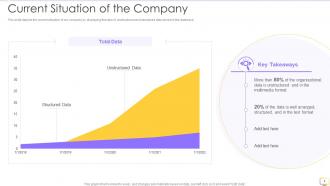
Slide 6: This slide depicts the current situation of our company by displaying the ratio of unstructured and structured data.
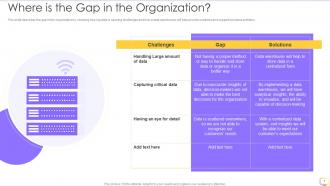
Slide 7: This slide presents gap in the organization by showing how big data is causing challenges.
Slide 8: This slide highlights title for topics that are to be covered next in the template.
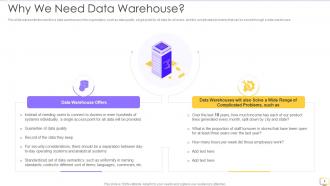
Slide 9: This slide displays need for a data warehouse in the organization, such as data quality, single point, etc.
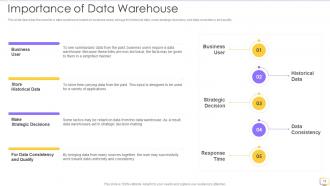
Slide 10: This slide shows need for a data warehouse based on business users, storage for historical data, etc.
Slide 11: This slide depicts the data warehouse benefits for organizations such as time-saving, improved business intelligence, etc.
Slide 12: This slide highlights title for topics that are to be covered next in the template.
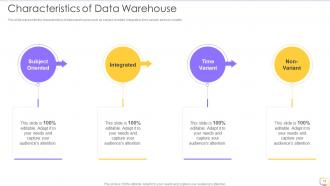
Slide 13: This slide shows characteristics of data warehouses such as subject-oriented, integrated, time-variant, and non-volatile.
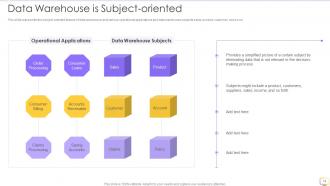
Slide 14: This slide represents the subject-oriented feature of data warehouse and various operational applications.
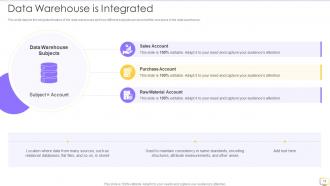
Slide 15: This slide depicts the integrated feature of the data warehouse and how different subjects are stored.
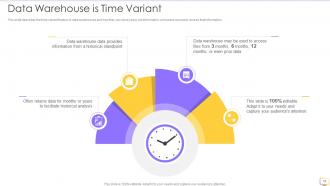
Slide 16: This slide shows time-variant feature of data warehouses and how they can store years-old information.
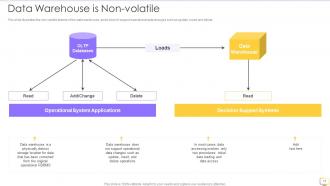
Slide 17: This slide illustrates the non-volatile feature of the data warehouse.
Slide 18: This slide highlights title for topics that are to be covered next in the template.
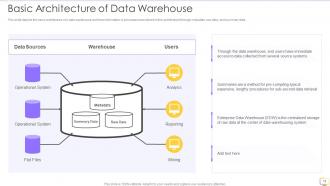
Slide 19: This slide displays the basic architecture of a data warehouse and how information is processed and stored in this architecture.
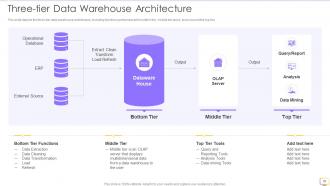
Slide 20: This slide depicts the three-tier data warehouse architecture, including functions performed.
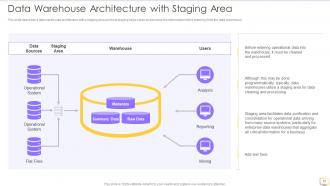
Slide 21: This slide describes a data warehouse architecture with a staging area.
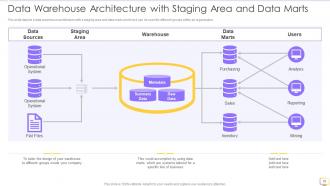
Slide 22: This slide presents a data warehouse architecture with a staging area and data marts.
Slide 23: This slide shows data warehouse bus architecture and how it decides the flow of the data in the data warehouse.
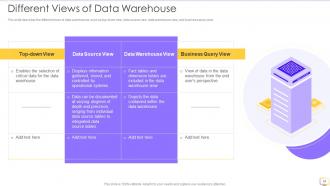
Slide 24: This slide displays different views of data warehouses, such as top-down view, data source view, data warehouse view, etc.
Slide 25: This slide highlights title for topics that are to be covered next in the template.
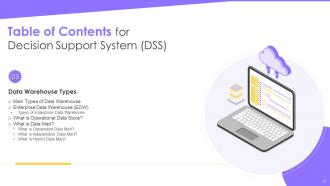
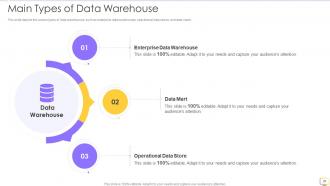
Slide 26: This slide depicts the various types of data warehouses, such as enterprise data warehouses, operational data stores, etc.
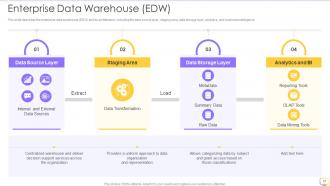
Slide 27: This slide presents the enterprise data warehouse (EDW) and its architecture, including the data source layer, staging area, etc.
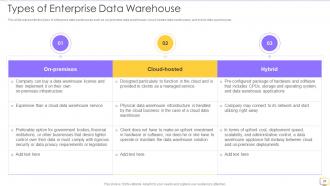
Slide 28: This slide represents the types of enterprise data warehouses such as on-premises data warehouses, cloud-hosted data warehouses, etc.
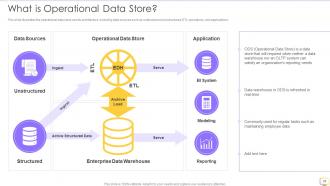
Slide 29: This slide illustrates the operational data store and its architecture, including data sources such as unstructured and structured.
Slide 30: This slide depicts the data mart type of data warehouse, its architecture, and how a single department manages it.
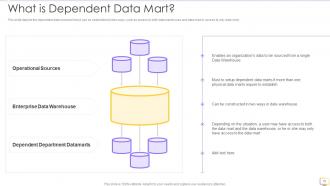
Slide 31: This slide depicts the dependent data mart and how it can be established in two ways.
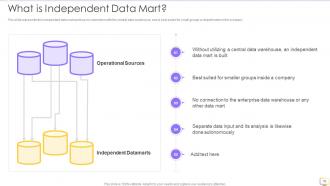
Slide 32: This slide presents the independent data mart and has no connection with the central data warehouse.
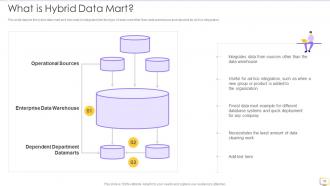
Slide 33: This slide depicts the hybrid data mart and how data is integrated into this type of data mart other than data warehouse.
Slide 34: This slide highlights title for topics that are to be covered next in the template.
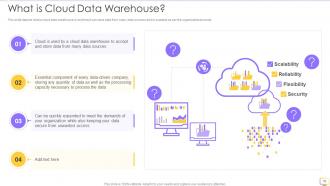
Slide 35: This slide depicts what a cloud data warehouse is and how it can store data from many data sources.
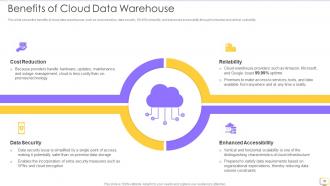
Slide 36: This slide shows the benefits of cloud data warehouses, such as cost reduction, data security, etc.
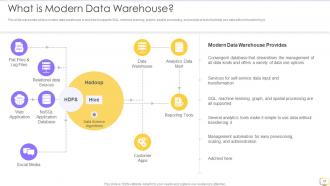
Slide 37: This slide represents what a modern data warehouse is and how it supports SQL, machine learning, etc.
Slide 38: This slide highlights title for topics that are to be covered next in the template.
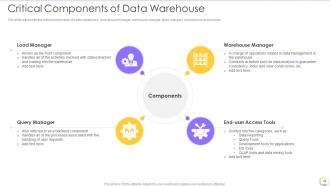
Slide 39: This slide displays the critical components of a data warehouse, such as load manager, warehouse manager, etc.
Slide 40: This slide represents the stages of data warehouse such as operational database, offline data warehouse, etc.
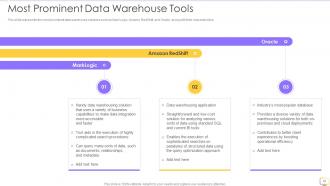
Slide 41: This slide represents the most prominent data warehouse solutions such as MarkLogic, Amazon RedShift, and Oracle.
Slide 42: This slide highlights title for topics that are to be covered next in the template.
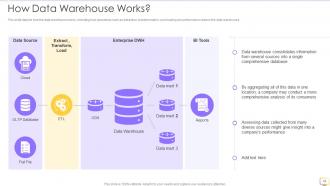
Slide 43: This slide depicts how the data warehouse works, including how operations such as extraction, transformation, etc.
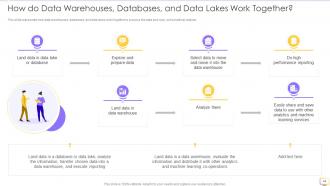
Slide 44: This slide represents how data warehouses, databases, and data lakes work together.
Slide 45: This slide highlights title for topics that are to be covered next in the template.
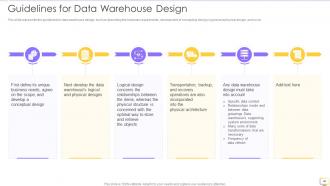
Slide 46: This slide represents the guidelines for data warehouse design, such as describing the business requirements, development of conceptual design, etc.
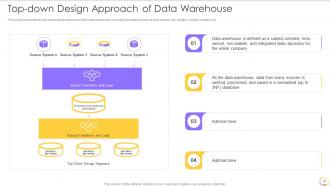
Slide 47: This slide presents the top-down design approach of the data warehouse, including its features such as time-variant, non-volatile, subject-oriented, etc.
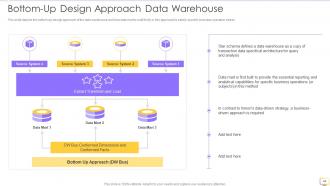
Slide 48: This slide depicts the bottom-up design approach of the data warehouse and how data mart is built firstly in this approach.
Slide 49: This slide highlights title for topics that are to be covered next in the template.
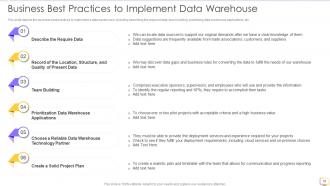
Slide 50: This slide depicts the business best practices to implement a data warehouse.
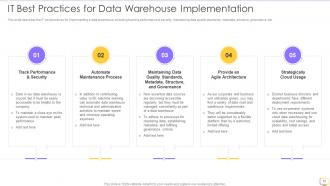
Slide 51: This slide describes the IT best practices for implementing a data warehouse, including tracking performance & security, maintaining data quality standards, etc.
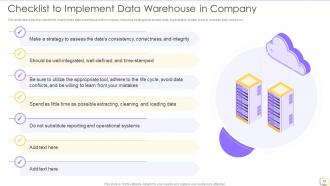
Slide 52: This slide shows Checklist to Implement Data Warehouse in Company.
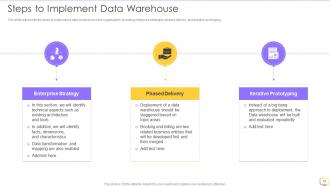
Slide 53: This slide represents the steps to implement a data warehouse in the organization, including enterprise strategies, phased delivery, etc.
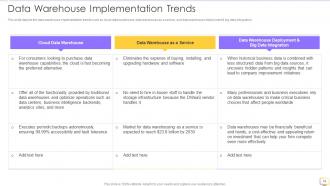
Slide 54: This slide depicts the data warehouse implementation trends such as cloud data warehouse, data warehouse as a service, etc.
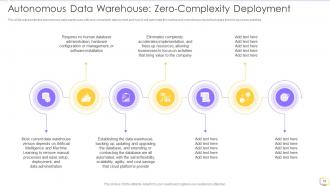
Slide 55: This slide represents the autonomous data warehouse with zero complexity deployment and how it will automate the routine.
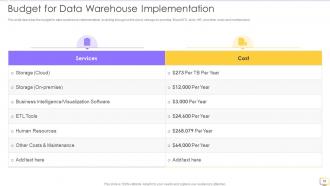
Slide 56: This slide describes the budget for data warehouse implementation, including storage on the cloud, storage on-premise, etc.
Slide 57: This slide highlights title for topics that are to be covered next in the template.
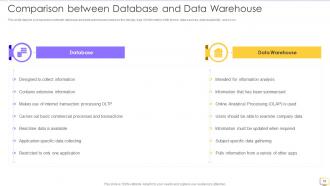
Slide 58: This slide depicts a comparison between database and data warehouse based on the design, type of information, etc.
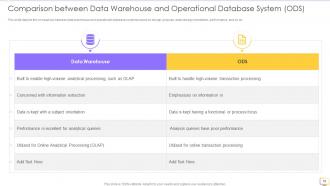
Slide 59: This slide displays the comparison between data warehouse and operational database systems based on design, purpose, etc.
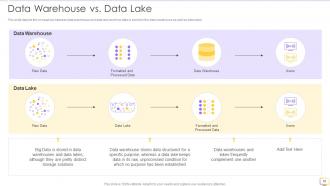
Slide 60: This slide depicts the comparison between data warehouse and data lake and how data is stored in the data warehouse.
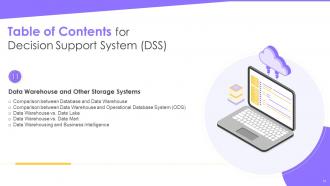
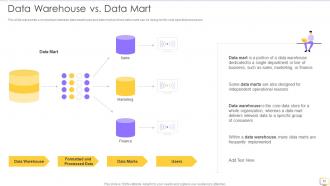
Slide 61: This slide represents a comparison between data warehouse and data mart and how data marts can be designed for sole operational reasons.
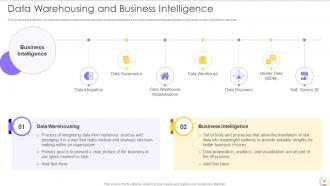
Slide 62: This slide presents the comparison between data warehousing and business intelligence and how business intelligence helps to generate useful output from raw data.
Slide 63: This slide highlights title for topics that are to be covered next in the template.
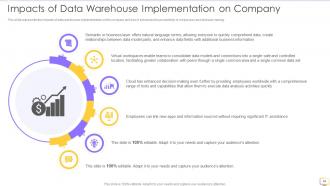
Slide 64: This slide represents the impacts of data warehouse implementation on the company.
Slide 65: This slide highlights title for topics that are to be covered next in the template.
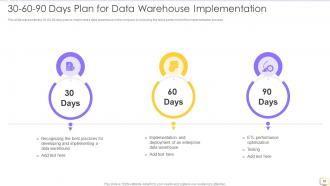
Slide 66: This slide represents the 30-60-90 days plan to implement a data warehouse in the company.
Slide 67: This slide highlights title for topics that are to be covered next in the template.
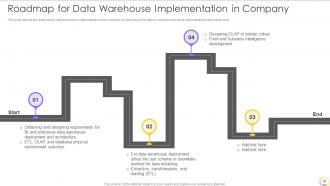
Slide 68: This slide depicts the roadmap for data warehouse implementation in the company.
Slide 69: This slide highlights title for topics that are to be covered next in the template.
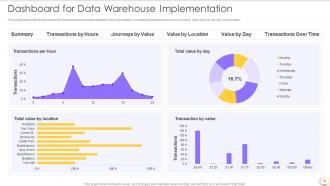
Slide 70: This slide shows dashboard for data warehouse implementation in the organization.
Slide 71: This slide is titled as Additional Slides for moving forward.
Slide 72: This slide highlights title for topics that are to be covered next in the template.
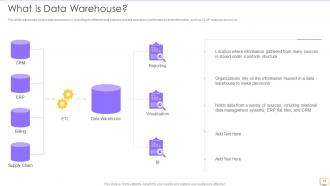
Slide 73: This slide represents what a data warehouse is, including its different data sources and the operations performed.
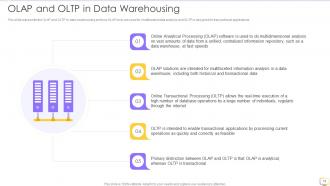
Slide 74: This slide displays the OLAP and OLTP in data warehousing and how OLAP tools are used for multifaceted data analysis.
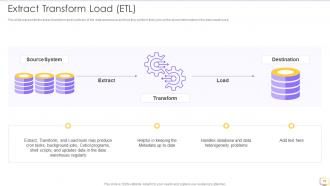
Slide 75: This slide represents the extract transform and load tools of the data warehouse and how they perform their jobs.
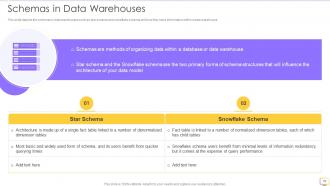
Slide 76: This slide depicts the schemas in data warehouses such as star schema and snowflake schema.
Slide 77: This slide represents the massively parallel processing analytical database and how parallel processing is done.
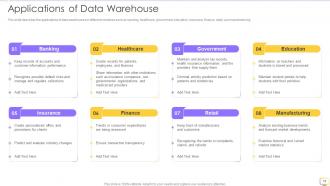
Slide 78: This slide describes the applications of data warehouses in different industries such as banking, healthcare, government, etc.
Slide 79: This slide contains all the icons used in this presentation.
Slide 80: This is a Comparison slide to state comparison between commodities, entities etc.
Slide 81: This is About Us slide to show company specifications etc.
Slide 82: This slide presents Post It Notes. Post your important notes here.
Slide 83: This slide shows Circular Diagram with additional textboxes.
Slide 84: This slide displays Puzzle with related icons and text.
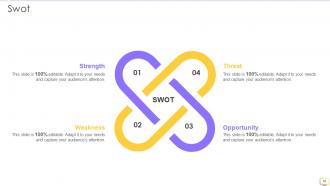
Slide 85: This slide shows SWOT describing- Strength, Weakness, Opportunity, and Threat.
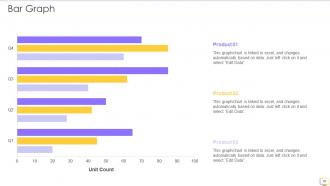
Slide 86: This slide shows Bar Graph with three products comparison.
Slide 87: This slide presents Venn diagram with text boxes.
Slide 88: This is a Thank You slide with address, contact numbers and email address.
Decision Support System DSS Powerpoint Presentation Slides with all 93 slides:
Use our Decision Support System DSS Powerpoint Presentation Slides to effectively help you save your valuable time. They are readymade to fit into any presentation structure.













FAQs for Decision Support System DSS
So DSS systems have three main parts you should know. The database piece stores all your info - internal stuff, outside data, whatever you need for decisions. Your analytical engine runs the models and simulations (that's the model management system). Then there's the user interface, which honestly can make or break everything - I've seen great systems die because they were too painful to use. These parts work together for analyzing complex scenarios and running "what-if" situations. My advice? Test that interface first when you're shopping around. If it feels clunky during the demo, it'll be worse in real life.
Honestly, DSS is pretty cool - it takes data from different places and crunches numbers so you don't have to guess on big decisions. Instead of going with your gut, you get actual scenarios showing what might happen. Way better than those "oh crap" moments later, you know? The analysis part is automatic, which speeds things up. You can test out different "what-if" situations too. I mean, my cousin's company uses one and swears by it. Just make sure whatever system you pick actually matches how your team makes decisions - generic solutions usually suck.
So DSS systems grab data from three main spots: your company's internal stuff (sales records, financial reports, customer info), external sources like market research and competitor data, and live feeds coming in real-time. You're basically collecting everything - past trends and current snapshots. The system runs models and algorithms on all this data, plus whatever scenarios you throw at it. Honestly, the tricky part is making sure your sources aren't trash, because even the fanciest system won't save you from bad data going in.
So predictive analytics basically flips your DSS from just reacting to stuff to actually seeing what's coming. You're using old data to spot future trends - customer churn, demand forecasting, risk stuff like that. Pretty cool actually. The algorithms dig through all your data patterns and give you these "what if" scenarios. Now you can plan ahead instead of scrambling when problems hit. Way better than always being behind the curve, you know? It's honestly a game-changer if you're tired of constantly putting out fires.
So there are basically four types of DSS to think about. Data-driven ones analyze huge datasets for patterns. Model-driven systems use math formulas for predictions and optimization. Knowledge-driven are like expert systems that copy human decision-making. Then you've got communication-driven platforms for team decisions. Honestly though, most tools today mix these together - Tableau does data analysis plus predictive modeling, for example. The boundaries aren't super clean anymore with all the AI integration happening. I'd say figure out what problem you're actually trying to solve first, then match it to whatever type fits your data situation best.
You basically need to customize everything - data sources, analytics, interfaces - to fit how that industry actually works. Healthcare DSS pulls patient records and clinical guidelines to help with treatment calls. Finance ones grab market data and risk models. But here's the thing: you really gotta understand what decisions people make every day, because generic systems are pretty useless. They don't match real workflows at all. Industry-specific dashboards and alerts matter too - stuff that actually makes sense to the experts using them. Honestly? Shadow your users for like a week first. See what data they're scrambling for when crunch time hits.
Honestly, cloud DSS is such a game-changer compared to those clunky on-premise systems. No more dealing with server maintenance (seriously, IT guys charging overtime for weekend fixes gets expensive fast). Your team can pull data from anywhere, which is perfect since everyone's still doing the hybrid work thing. The subscription pricing is way easier on budgets too - spreads everything out instead of dropping huge cash upfront on hardware. Updates happen automatically, so you're not stuck with outdated features. Oh, and it scales up easily when your data gets crazy big. Just think about how much your team will grow in the next couple years when you're picking.
Honestly, UI design can make or break your DSS. I've watched so many good systems die because nobody could figure out how to use them - then everyone just goes back to Excel like always. You want people to find what they need fast and actually understand the data visualizations. Good interfaces feel almost predictable, you know? Like they put the next thing you're looking for right where you'd expect it. Hierarchy matters too - don't dump everything on one screen. But here's the thing: test it with real users early. Watch them struggle (it's painful but necessary) because they'll never use it the way you think they will.
So ML can totally transform your DSS by automating all that pattern-spotting stuff that would take you ages to do manually. Your system starts learning from past data to predict trends and catch weird outliers automatically. Pretty neat how it actually gets better over time as it crunches more of your company's data. You'll see big wins in forecasting demand, assessing risks, that kind of thing. Honestly, I'd just pick one boring repetitive decision you're already making and try adding some predictive features there first – way easier than overhauling everything at once.
Honestly? Data's gonna be your biggest headache. It's usually scattered everywhere, inconsistent, or just a hot mess - makes any insights pretty useless. People hate change too, so expect pushback when you roll out new tools. Nobody trusts the automated stuff at first. Integration with your current systems is another nightmare, and costs can get out of hand fast if you're not watching scope. Oh, and change management - start that immediately or you're screwed. My advice? Begin with something small to prove it works.
So basically it connects through APIs and data connectors that grab info from your ERP, CRM, all that stuff - either live or in batches. Think of it like a smart overlay on your current systems. Pretty slick honestly. It pulls everything together, crunches the numbers, then shows you insights without messing up how you normally work. Most platforms these days can connect to whatever system spits out data. Your IT folks can usually handle the setup without rebuilding everything. Oh, and definitely map out your data sources first - way easier than figuring it out backwards. Then find vendors with ready-made connectors for your setup.
So bias is probably the biggest thing to watch out for - your system could totally screw over certain groups without you realizing it. Make sure people can actually understand how it works too, not just some black box spitting out answers. Privacy stuff is obvious when you're dealing with sensitive data. Oh, and don't let it completely take over human decision-making. That's honestly where I see most companies mess up. The system should help people decide, not decide for them. Test it regularly and have someone audit the results. You'll catch problems way earlier that way.
So basically, a DSS gets everyone on the same page by giving them access to the same data and tools in real-time. Instead of people arguing over different spreadsheets (which honestly happens way too often), everyone's looking at one shared dashboard. Stakeholders can plug in their own assumptions and immediately see how it affects outcomes. The whole process becomes way more transparent since all the decision criteria are right there for everyone to see. Oh, and it automatically documents everything too. I'd start by figuring out who your main stakeholders are and what specific data each group actually needs.
Track both tech and business stuff to see if your DSS actually works. Response times, uptime, data accuracy - the usual suspects. But honestly, the business side matters more: are decisions getting better? Is it saving time? Are people even using the damn thing? Connecting DSS usage to real outcomes like cost savings is pretty tough though. I'd start simple - user surveys and how long decisions take now vs before. Those are way easier to measure and you'll see results fast. ROI calculations can come later once you've got the basics down.
So AI is completely changing how decision support systems work - instead of those old rigid tools, you're getting smart systems that actually learn from what you do. They can predict stuff in real-time, let you ask questions in normal language, and spot patterns automatically. The crazy part is they'll start suggesting decisions before you even ask. Plus they pull data from everywhere and explain their reasoning like a person would. Honestly, if you're not looking into AI-enhanced platforms now, you'll be way behind. The gap between companies using this and those still stuck with basic tools is gonna be massive.
-
The designs are super attractive. Me and my team love using SlideTeam’s presentations.
-
Informative presentations that are easily editable.