

Driver diagram plan structure template ppt example file


Try Before you Buy Download Free Sample Product
 Impress Your
 Audience
Editable
of Time


Driver diagram plan structure template PPT example file PowerPoint template is an outstanding presentation to discuss the business strategies. The business force diagram model structure PowerPoint presentation is a great management tool to align the activities with other processes or factors and organizational strategies. This statistics of market driver picture plan body PowerPoint slide is an impressive and effective illustration to demonstrate your newly introduced strategies to your team members, employees or business partners to harvest expected and planned results in your business. This value driver schematic representation framework composition PPT has been designed by or professional experts keeping the view of enabling you to express your visionary ideas and projects to the concerned persons in order to win favorable and beneficial outcomes to you and your organization. This presentation is complete in itself, eye catchy and competent enough to draw the attention and interests of your clients, customers, team members etc. and ensures you positive results. This PPT slide is used by business analysts, business managers and team leaders. Our Driver Diagram Plan Structure Template Ppt Example File ensure you first billing. The advantage will be clearly with you.
People who downloaded this PowerPoint presentation also viewed the following :
Content of this Powerpoint Presentation
Description:
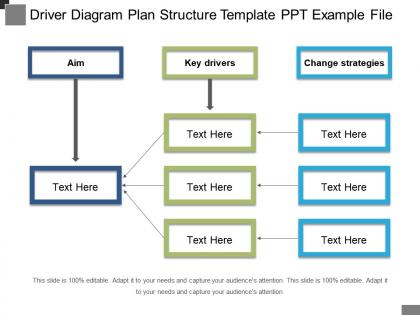
The image depicts a PowerPoint slide titled "Driver Diagram Plan Structure Template PPT Example File." This slide is a visual tool that helps to map out the relationship between a goal (Aim) and the factors that drive towards that goal (Key drivers), as well as the strategies to affect change (Change strategies). The diagram consists of:
1. A central aim represented by a rectangular box at the top.
2. Several key drivers indicated by boxes that branch off from the aim.
3. Specific change strategies aligned with each key driver, shown in adjacent boxes.
Each box has a placeholder "Text Here," allowing for the entry of details relevant to the individual's plan structure. The slide notes that it is "100% editable," which means it can be fully customized to suit the needs of the presenter and the audience.
Use Cases:
This diagram is versatile and can be applied in various industries to structure and communicate plans and strategies:
1. Healthcare:
Use: Developing patient care improvement plans.
Presenter: Healthcare Administrator.
Audience: Medical staff, department heads.
2. Education:
Use: Outlining school improvement initiatives.
Presenter: School Superintendent.
Audience: Educators, school board members.
3. Business Strategy:
Use: Crafting corporate strategic plans.
Presenter: Business Analyst.
Audience: Executives, management teams.
4. Environmental Management:
Use: Planning sustainability efforts.
Presenter: Sustainability Coordinator.
Audience: Environmental teams, stakeholders.
5. Public Policy:
Use: Designing government action plans.
Presenter: Policy Advisor.
Audience: Government officials, public servants.
6. Technology Development:
Use: Mapping technology roadmap objectives.
Presenter: CTO or Product Manager.
Audience: Development team, investors.
7. Non-Profit Organizations:
Use: Structuring program and outreach strategies.
Presenter: Program Director.
Audience: Volunteers, donors, community members.
Driver diagram plan structure template ppt example file with all 5 slides:
Folks eagerly come forward to join you due to our Driver Diagram Plan Structure Template Ppt Example File. They will accept your invitation.

FAQs for Driver diagram plan structure template
A driver diagram is a visual tool that maps the logical connections between strategic objectives, key drivers, and specific interventions needed to achieve desired outcomes. It enhances strategic planning by creating clear cause-and-effect relationships, aligning team efforts around priority initiatives, and enabling systematic progress tracking, with many organizations finding that this structured approach streamlines resource allocation and accelerates goal achievement.
A driver diagram template should include the primary outcome or aim, secondary outcome drivers, primary drivers with supporting change ideas, and clear visual connections between all elements. These components enhance strategic planning by organizing complex objectives, identifying actionable interventions, and mapping cause-and-effect relationships, with many organizations finding that this structured approach streamlines improvement initiatives and delivers measurable results.
Driver diagrams help teams identify root causes by visually mapping the relationship between primary drivers, secondary drivers, and specific change ideas that impact the overall project aim. Through systematic breakdown of complex problems into manageable components, teams can trace issues back to their fundamental sources, enabling targeted interventions that address underlying causes rather than symptoms, ultimately delivering more effective problem-solving and sustainable project outcomes.
Common mistakes when creating driver diagrams include overcomplicating the structure with too many levels, selecting unmeasurable or vague drivers, failing to establish clear cause-and-effect relationships, and lacking stakeholder input during development. These oversights can undermine strategic clarity, with many organizations finding that focusing on 3-5 key primary drivers, ensuring each connects measurably to outcomes, and involving cross-functional teams ultimately delivers more actionable insights and sustainable performance improvements.
A driver diagram facilitates communication by providing a shared visual framework that clearly connects project goals, primary drivers, and specific interventions in one comprehensive view. This transparent mapping enables stakeholders across departments, from executives to implementation teams, to understand their roles within the broader strategy, align priorities effectively, and track progress collaboratively, ultimately delivering enhanced coordination and accountability throughout complex organizational initiatives.
Driver diagram templates are highly adaptable across industries through customization of key performance indicators, outcome metrics, primary drivers, and change ideas specific to each sector's goals. Healthcare organizations might focus on patient safety outcomes while manufacturing companies emphasize operational efficiency, with both adapting the same structural framework to their unique processes, regulatory requirements, and strategic objectives, ultimately delivering targeted improvements.
Data plays a crucial role in driver diagram development by validating primary drivers, identifying key metrics for measurement, and establishing baseline performance levels for tracking progress. Through historical performance data and current system analytics, organizations can prioritize the most impactful drivers, set realistic targets, and continuously refine their improvement strategies, ultimately delivering more effective outcomes.
Teams can use driver diagrams to prioritize initiatives by mapping primary drivers to specific outcomes, identifying high-impact activities through visual hierarchy, and aligning resources with strategic objectives that deliver measurable results. This structured approach enables organizations to focus efforts on initiatives with the greatest potential impact, while eliminating redundant activities, ultimately streamlining resource allocation and accelerating goal achievement across departments.
**INPUT**: What visual elements are most effective in a driver diagram template to ensure comprehension? **OUTPUT**: Effective driver diagram templates include clear hierarchical flow charts, color-coded categories, directional arrows, consistent spacing, and distinct visual boundaries between primary drivers and secondary factors. These visual elements enhance comprehension by creating intuitive pathways from outcomes to root causes, with many organizations finding that strategic color schemes and standardized formatting significantly streamline problem-solving processes and accelerate decision-making across teams. [Word count: 58 words]
Driver diagrams should be revisited monthly during active project phases and quarterly during maintenance periods, with additional updates triggered by significant scope changes, stakeholder feedback, or performance data insights. Many organizations find that regular review cycles enable teams to refine primary and secondary drivers based on real-world outcomes, ultimately maintaining alignment between strategic objectives and operational activities while ensuring continuous improvement momentum.
Healthcare systems like Kaiser Permanente and manufacturing companies such as Toyota have successfully used driver diagrams to reduce patient readmission rates and eliminate production waste respectively. These organizations leveraged driver diagrams to identify key performance drivers, align cross-functional teams around measurable outcomes, and systematically address root causes, ultimately delivering improved operational efficiency and enhanced customer experiences while maintaining strategic focus.
Driver diagrams integrate seamlessly with project management methodologies like Lean Six Sigma, Agile frameworks, and balanced scorecards by providing visual clarity on cause-and-effect relationships between strategic objectives and operational activities. These templates enhance existing workflows by connecting high-level goals to specific initiatives, enabling project managers across manufacturing, healthcare, and financial services to streamline resource allocation, track measurable outcomes, and ultimately deliver more focused, results-driven project execution.
Teams learning to create driver diagrams benefit from process improvement training, systems thinking workshops, facilitation skills development, and hands-on practice with real organizational challenges. Healthcare systems, manufacturing companies, and service organizations often find that combining theoretical frameworks with collaborative team exercises, mentoring from experienced practitioners, and iterative feedback sessions accelerates proficiency while building sustainable improvement capabilities.
Technology and software aid driver diagram development by providing collaborative platforms, real-time data integration, automated visualization tools, and template libraries that streamline the mapping process. These digital solutions enable teams to efficiently identify key drivers, track performance metrics, and update diagrams dynamically, with many organizations finding that cloud-based tools enhance cross-functional collaboration and accelerate strategic planning initiatives.
Collaborating on driver diagrams enhances strategic alignment, leverages diverse perspectives, increases buy-in, and improves accuracy through collective expertise. Team-developed diagrams ensure comprehensive factor identification and shared ownership, with many organizations finding that collaborative approaches deliver stronger implementation success, reduced blind spots, and more robust change initiatives compared to individual efforts.
-
Unique research projects to present in meeting.
-
Thanks for all your great templates they have saved me lots of time and accelerate my presentations. Great product, keep them up!