Driving Value For Business Through Tech Investment Complete Deck
Technology is considered an essential component of organizational success. Businesses with access to the latest technologies have plus points among their competitors and can achieve their goals more quickly. To make more efficient operations, companies are investing more in innovative technologies. Check out our professionally designed presentation on Driving Value for Business through Tech Investment. It will assist FinTech organizations that want to collect information about the latest technology trends and invest in the one suitable for their business. Firstly, the companies can use sections, namely industry overview, and US market overview, to address critical information about the latest technologies at the global and domestic levels. Sections, namely investing in new technology, how technology will transform the future of work, and seamless customer journey will help the organization in providing in-depth information on IT investment approach, current versus future state of employee working post technology adoption, seamless customer journey map, etc. Lastly, with performance measuring touchpoints and KPI dashboards, organizations can monitor and measure the impact of technology adoption on their businesses. Get access to this powerful template now.
Technology is considered an essential component of organizational success. Businesses with access to the latest technologie..
- Google Slides is a new FREE Presentation software from Google.
- All our content is 100% compatible with Google Slides.
- Just download our designs, and upload them to Google Slides and they will work automatically.
- Amaze your audience with SlideTeam and Google Slides.
-
Want Changes to This PPT Slide? Check out our Presentation Design Services
- WideScreen Aspect ratio is becoming a very popular format. When you download this product, the downloaded ZIP will contain this product in both standard and widescreen format.
-

- Some older products that we have may only be in standard format, but they can easily be converted to widescreen.
- To do this, please open the SlideTeam product in Powerpoint, and go to
- Design ( On the top bar) -> Page Setup -> and select "On-screen Show (16:9)” in the drop down for "Slides Sized for".
- The slide or theme will change to widescreen, and all graphics will adjust automatically. You can similarly convert our content to any other desired screen aspect ratio.
Compatible With Google Slides

Get This In WideScreen
You must be logged in to download this presentation.
PowerPoint presentation slides
This complete deck covers various topics and highlights important concepts. It has PPT slides which cater to your business needs. This complete deck presentation emphasizes Driving Value For Business Through Tech Investment Complete Deck and has templates with professional background images and relevant content. This deck consists of total of fifty six slides. Our designers have created customizable templates, keeping your convenience in mind. You can edit the color, text and font size with ease. Not just this, you can also add or delete the content if needed. Get access to this fully editable complete presentation by clicking the download button below.
People who downloaded this PowerPoint presentation also viewed the following :
Content of this Powerpoint Presentation
Slide 1: This slide introduces Driving Value for Business Through Tech Investment. State your company name and begin.
Slide 2: This slide states Agenda of the presentation.
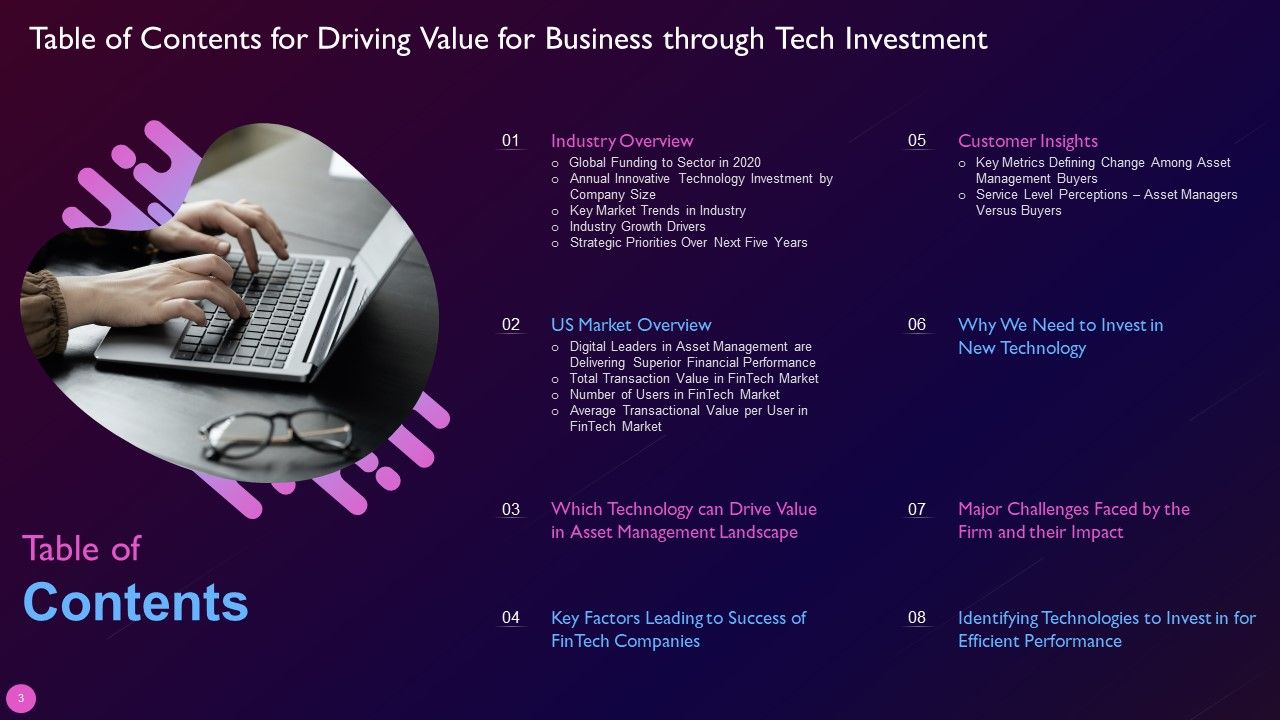
Slide 3: This slide presents Table of Content for the presentation.
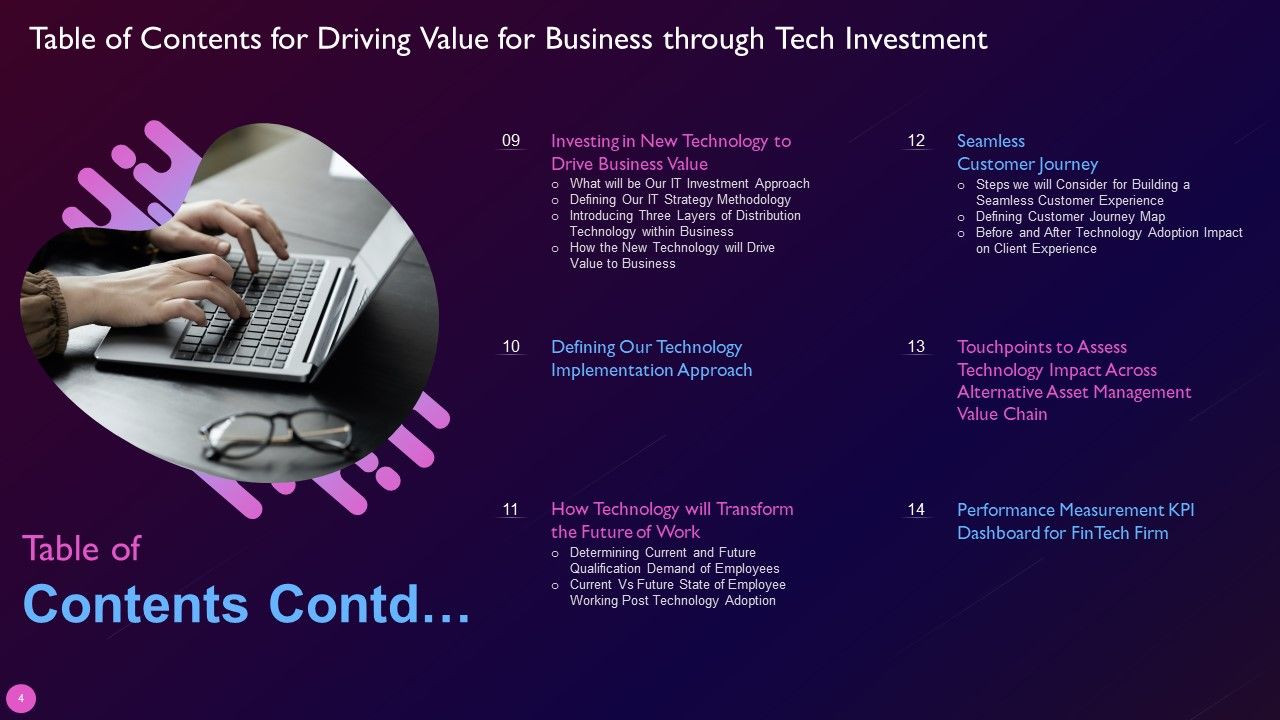
Slide 4: This is another slide continuing Table of Content for the presentation.
Slide 5: This slide highlights title for topics that are to be covered next in the template.
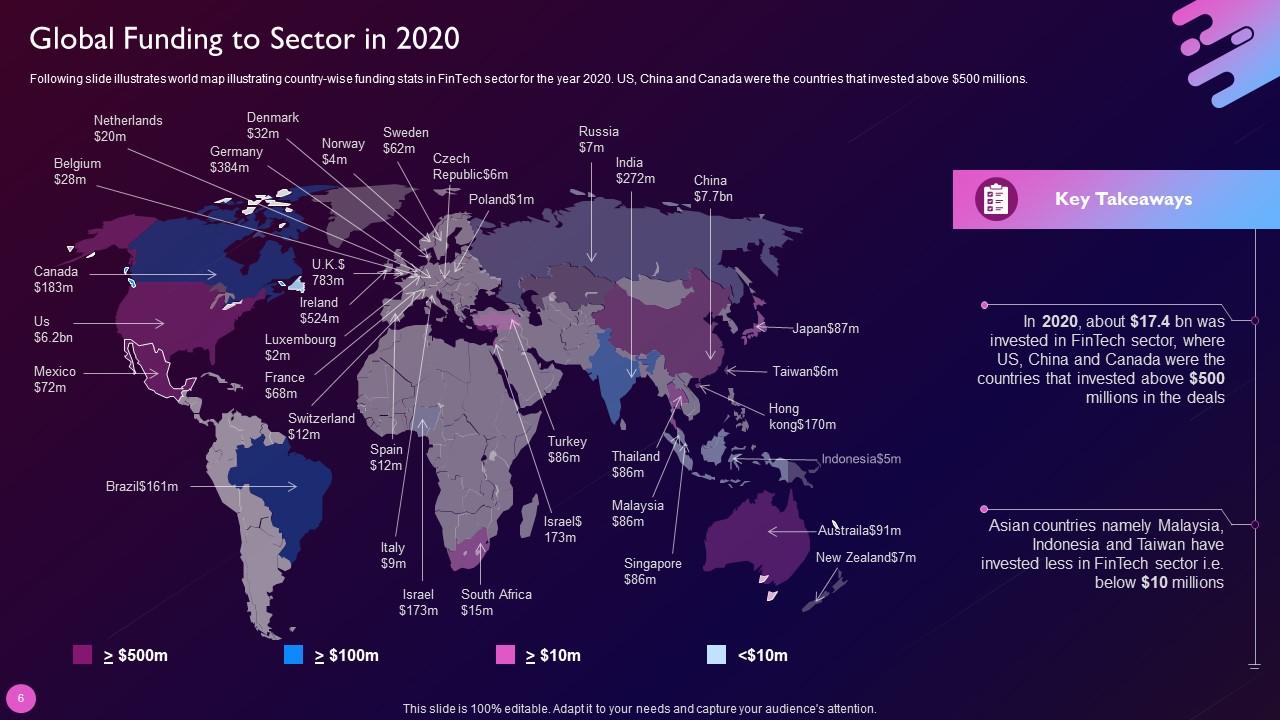
Slide 6: This slide shows world map illustrating country-wise funding stats in FinTech sector for the year 2020.
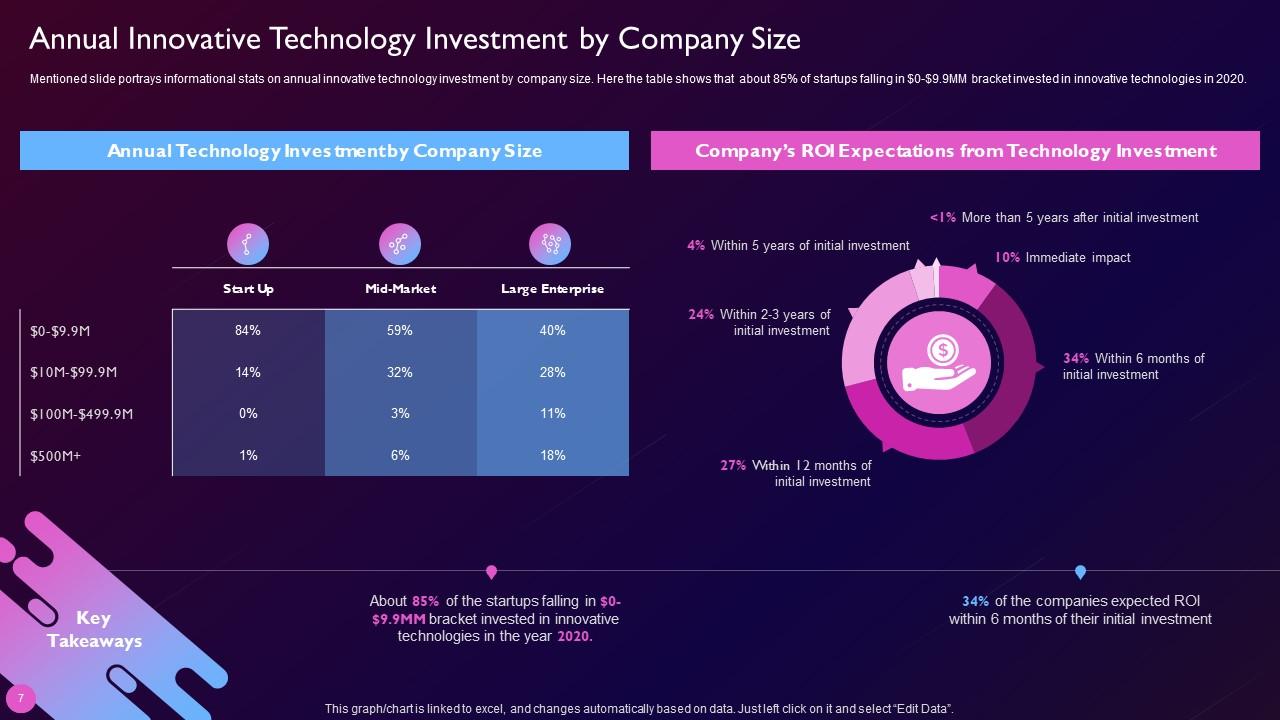
Slide 7: This slide presents Annual Innovative Technology Investment by Company Size.
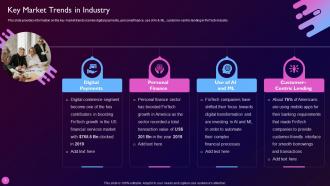
Slide 8: This slide provides information on the key market trends namely digital payments, personal finance, etc.
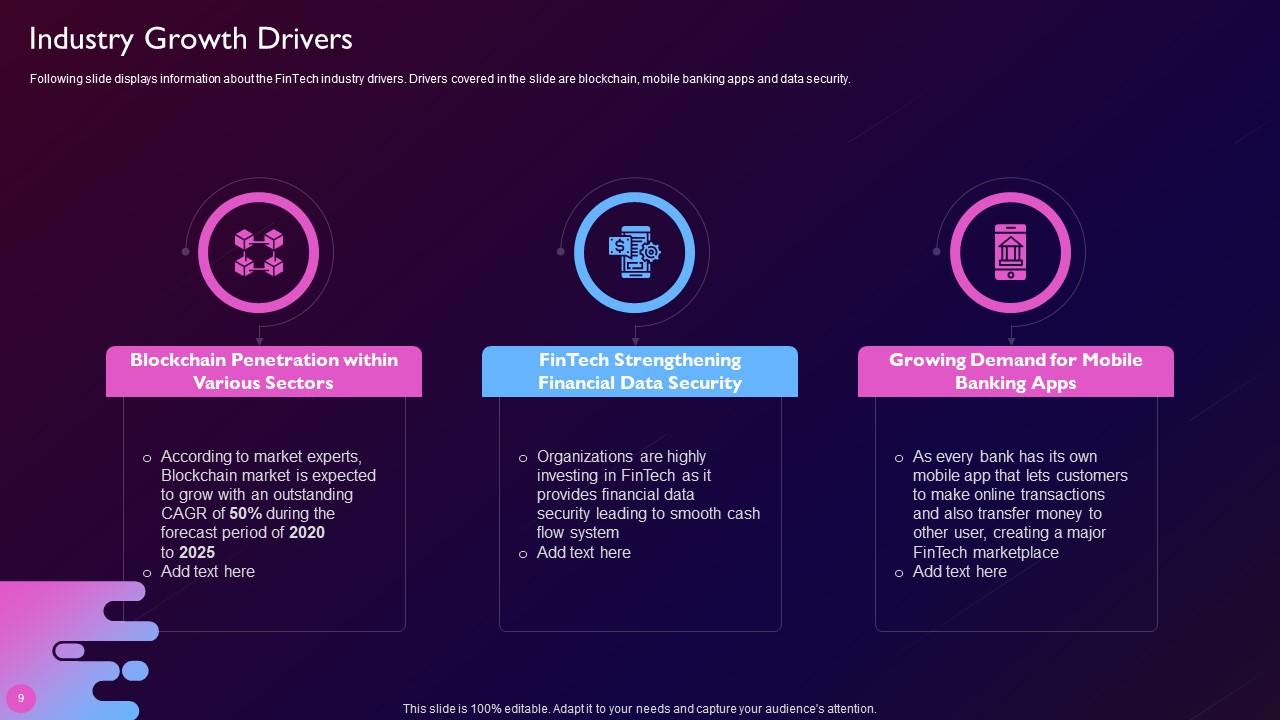
Slide 9: Following slide displays information about the FinTech industry drivers.
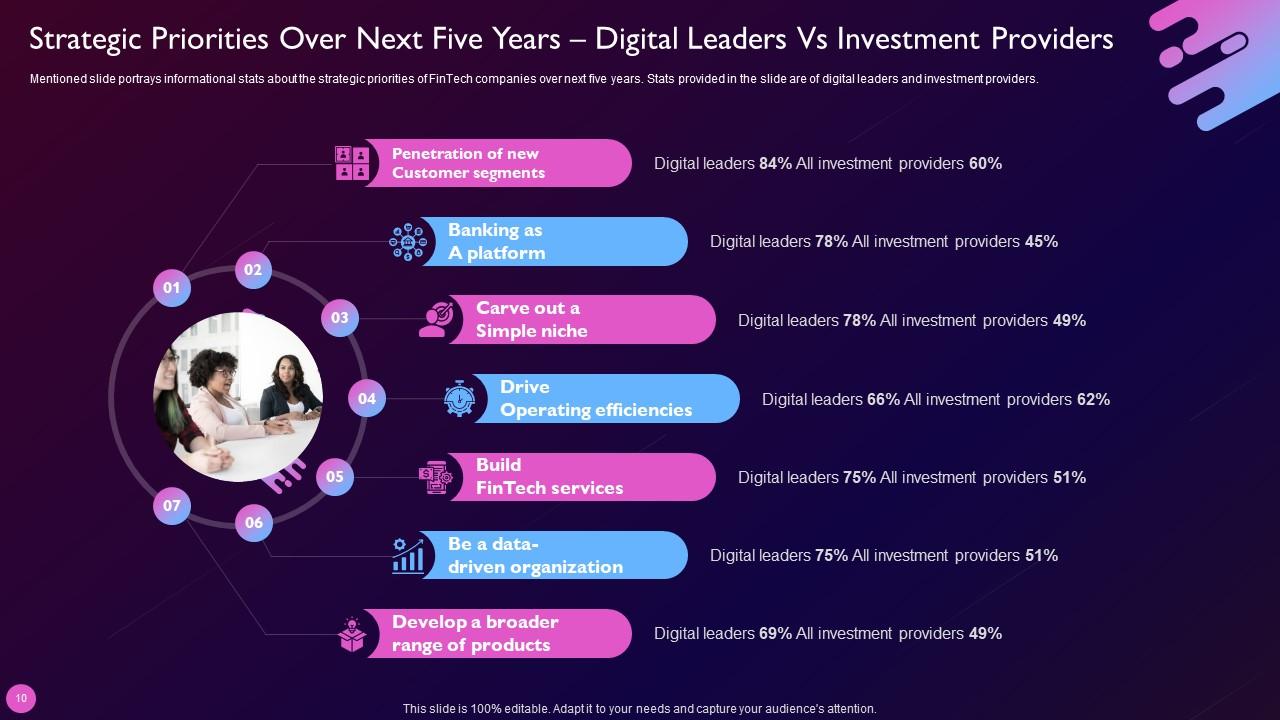
Slide 10: This slide represents stats about the strategic priorities of FinTech companies over next five years.
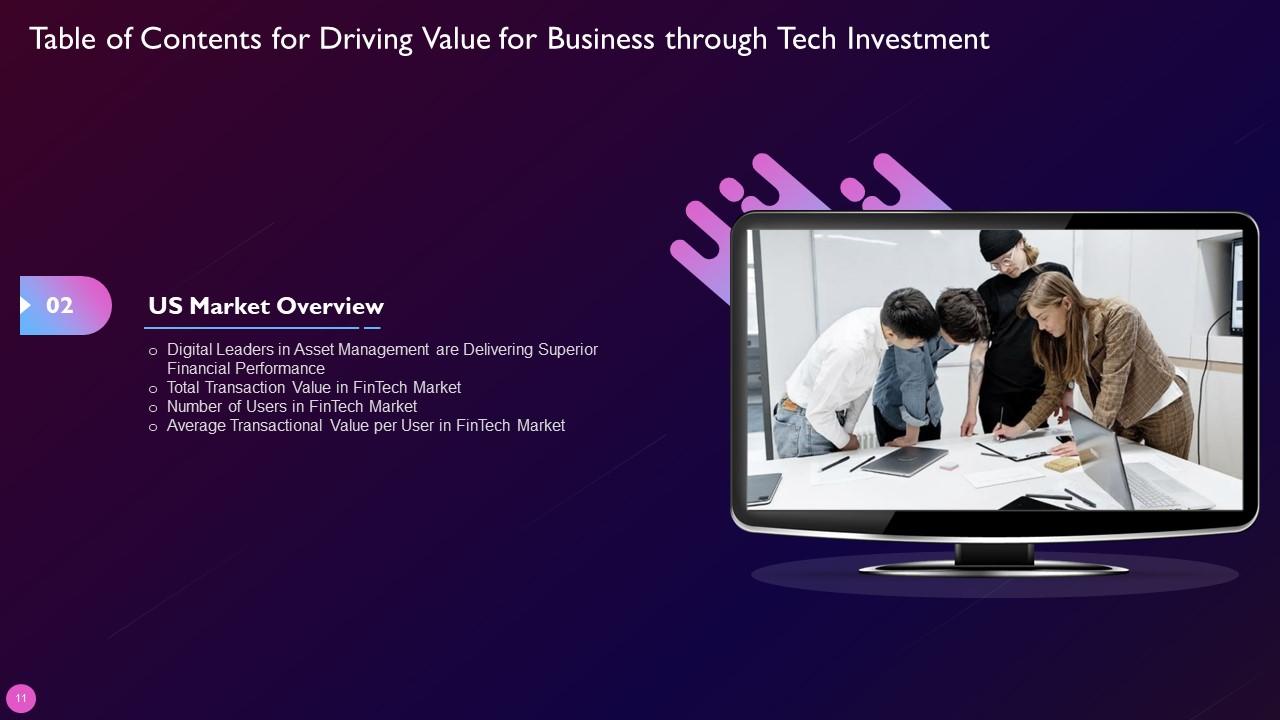
Slide 11: This slide highlights title for topics that are to be covered next in the template.
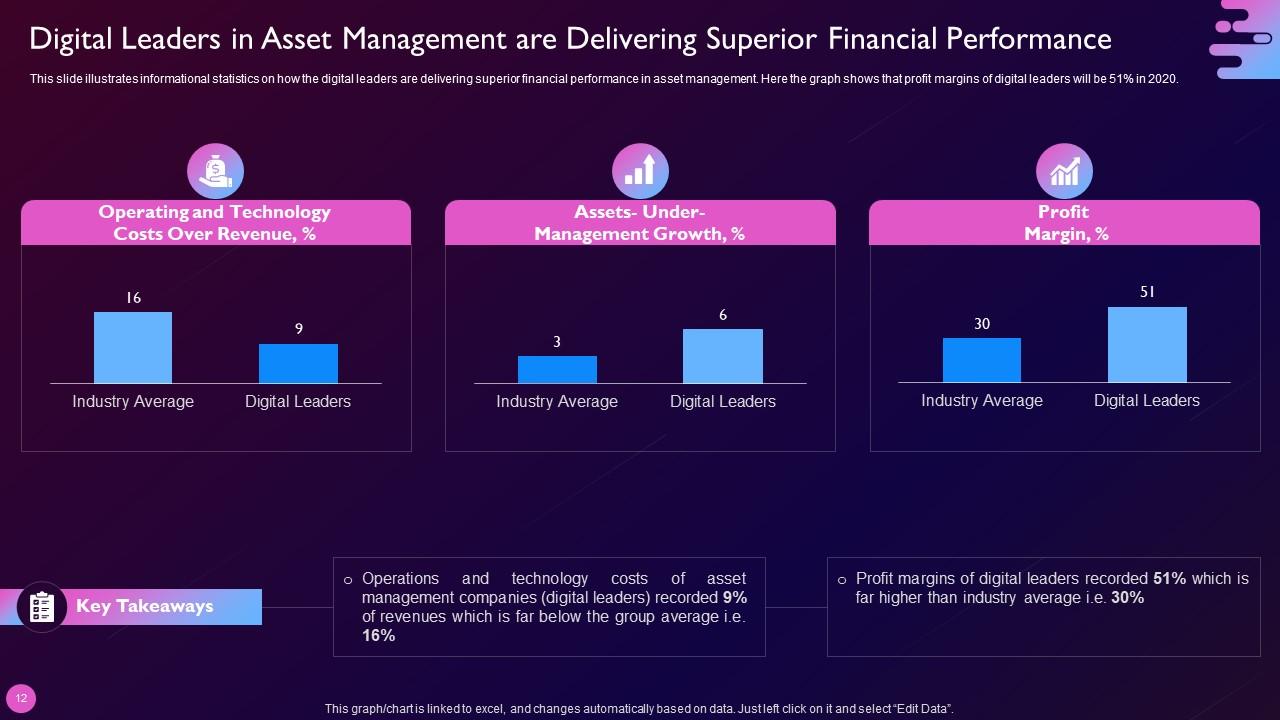
Slide 12: This slide illustrates informational statistics on how the digital leaders are delivering superior financial performance in asset management.
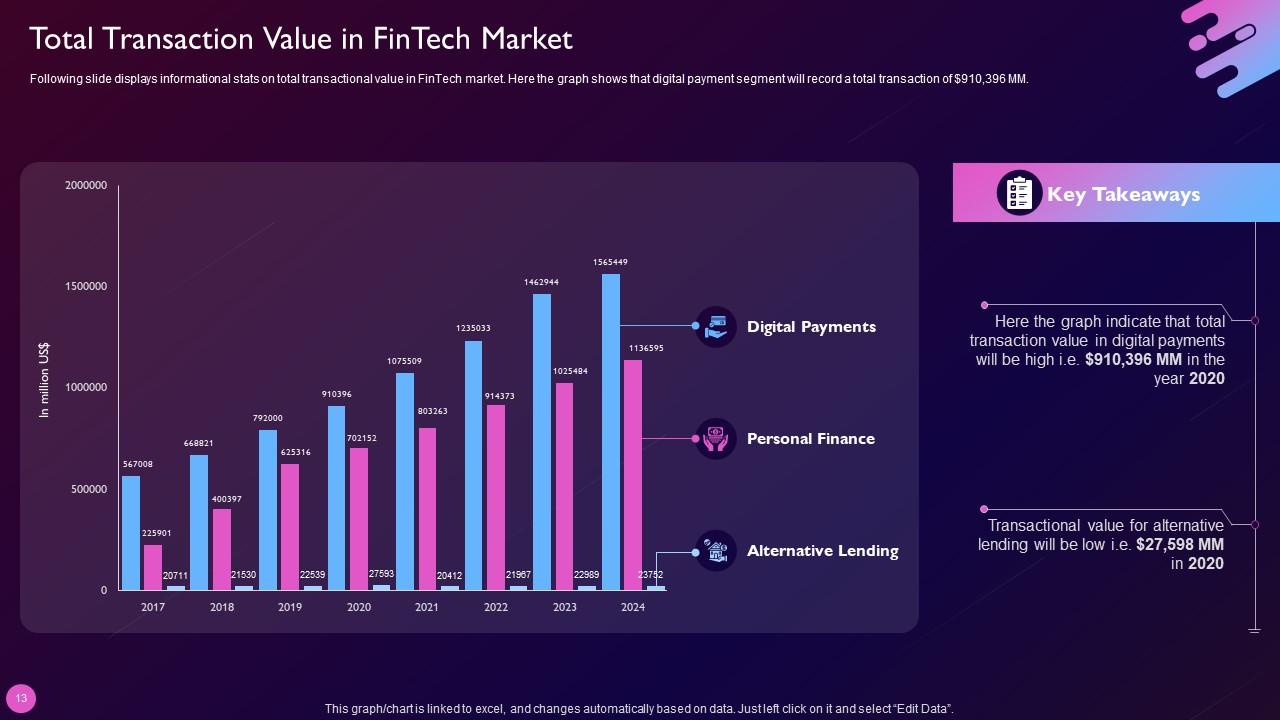
Slide 13: This slide displays Total Transaction Value in FinTech Market.
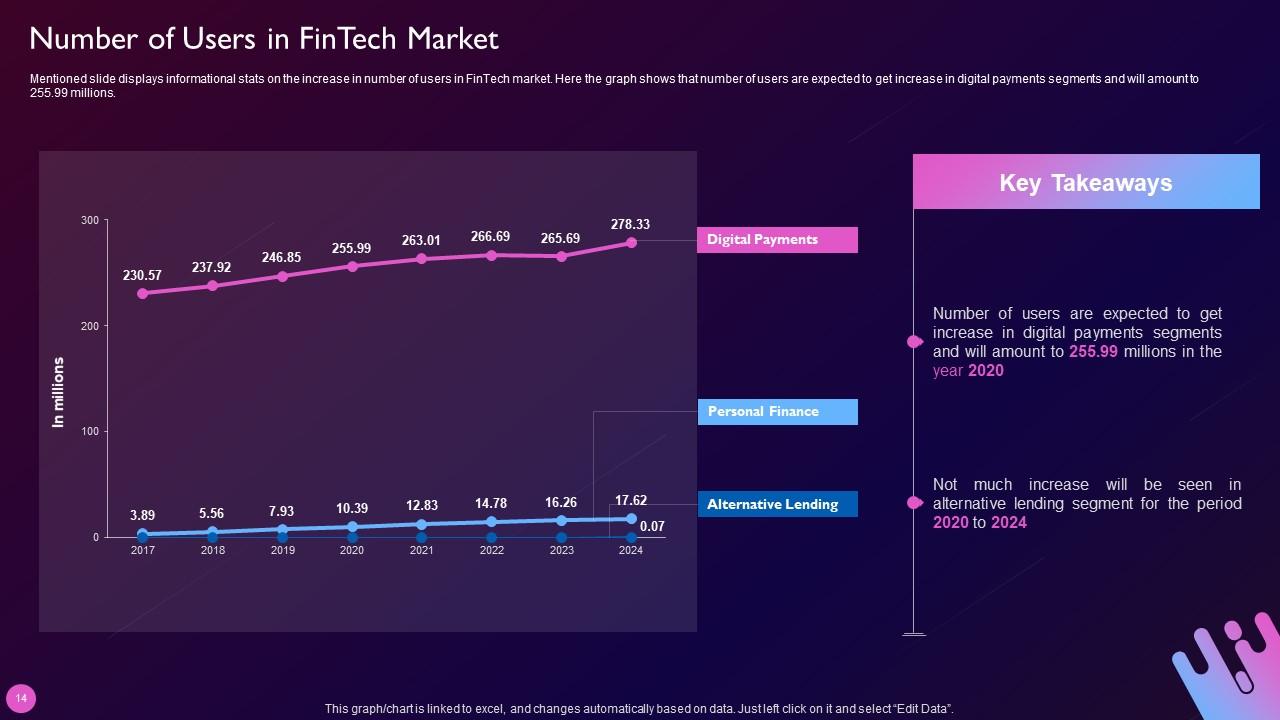
Slide 14: This slide represents Number of Users in FinTech Market.
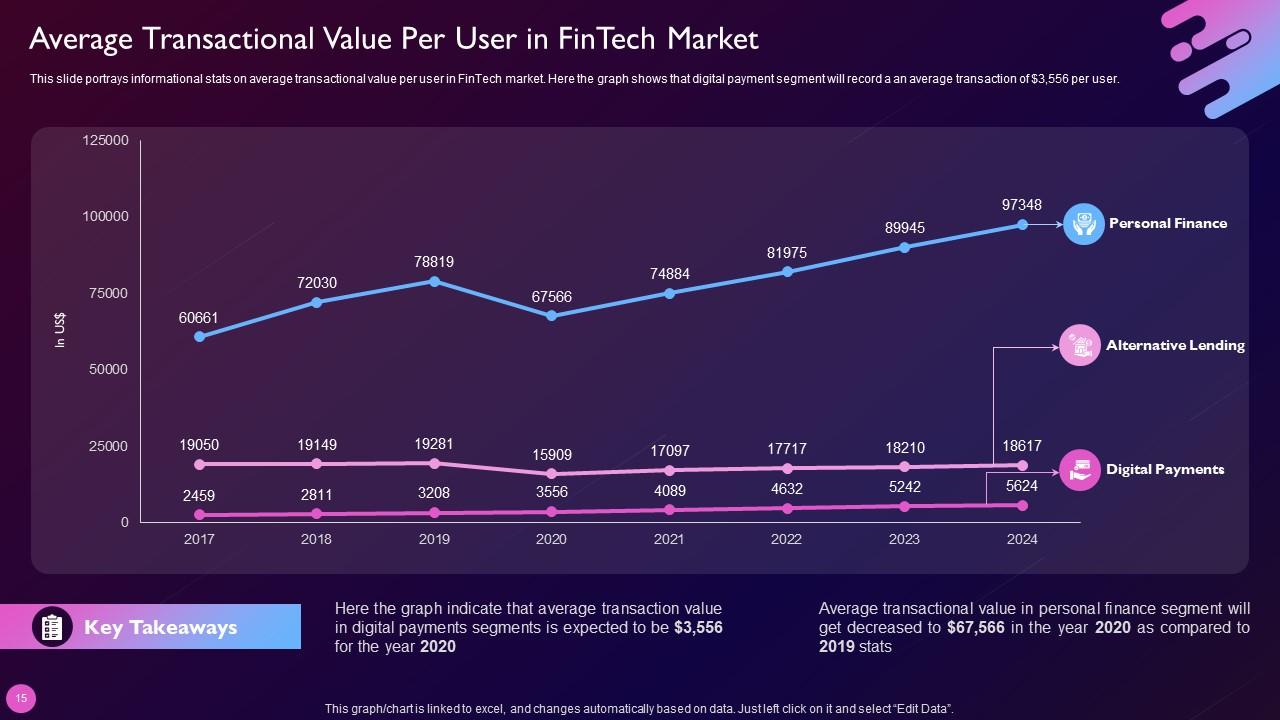
Slide 15: This slide showcases Average Transactional Value Per User in FinTech Market.
Slide 16: This slide highlights title for topics that are to be covered next in the template.
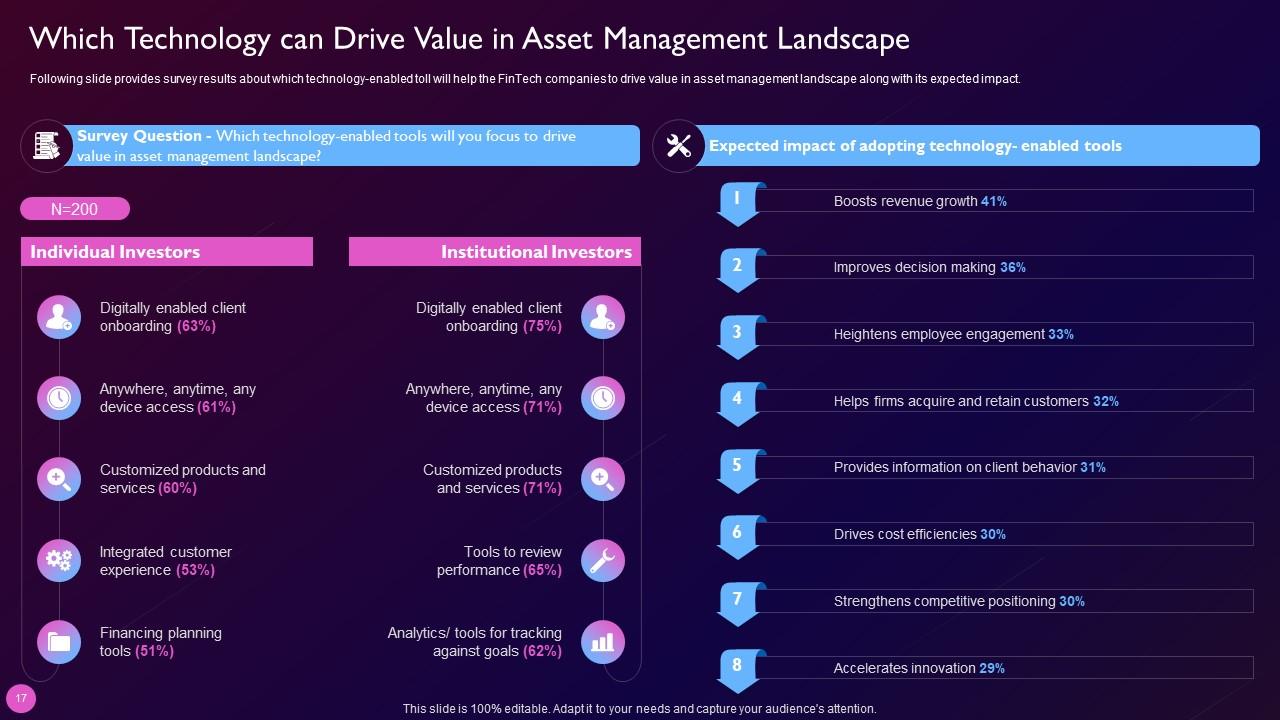
Slide 17: This slide shows Which Technology can Drive Value in Asset Management Landscape.
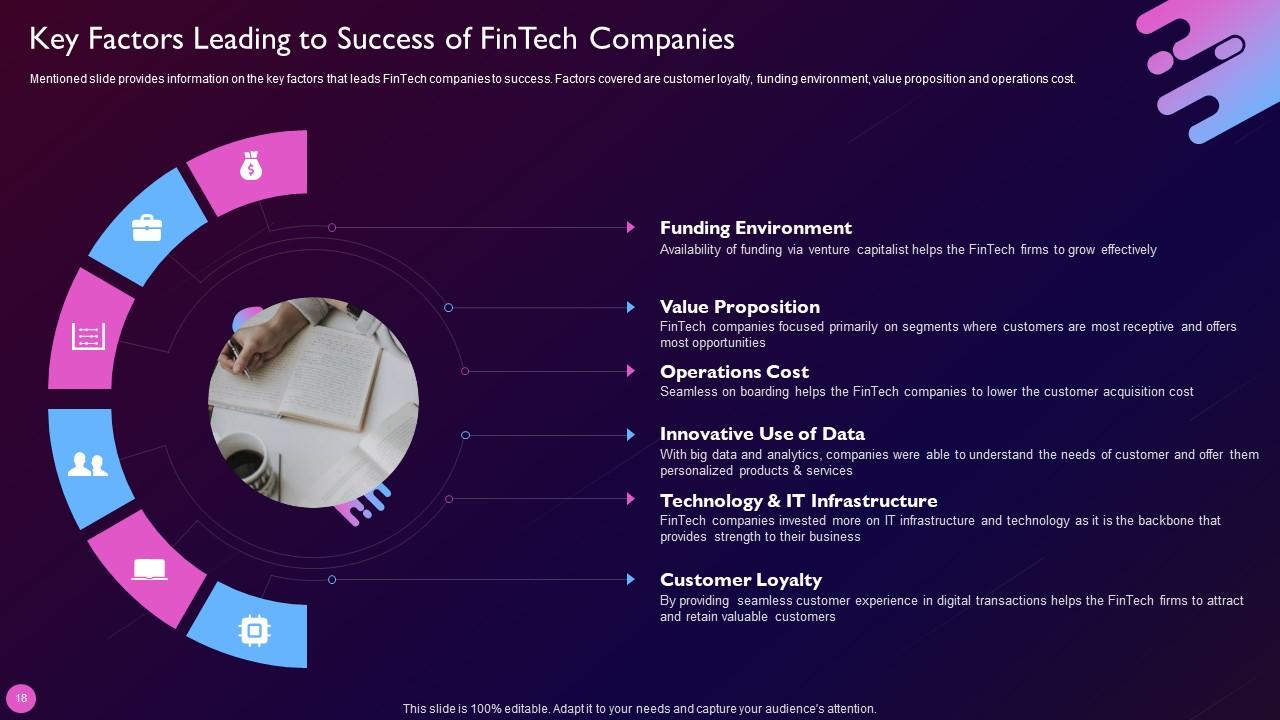
Slide 18: This slide presents Key Factors Leading to Success of FinTech Companies.
Slide 19: This slide highlights title for topics that are to be covered next in the template.
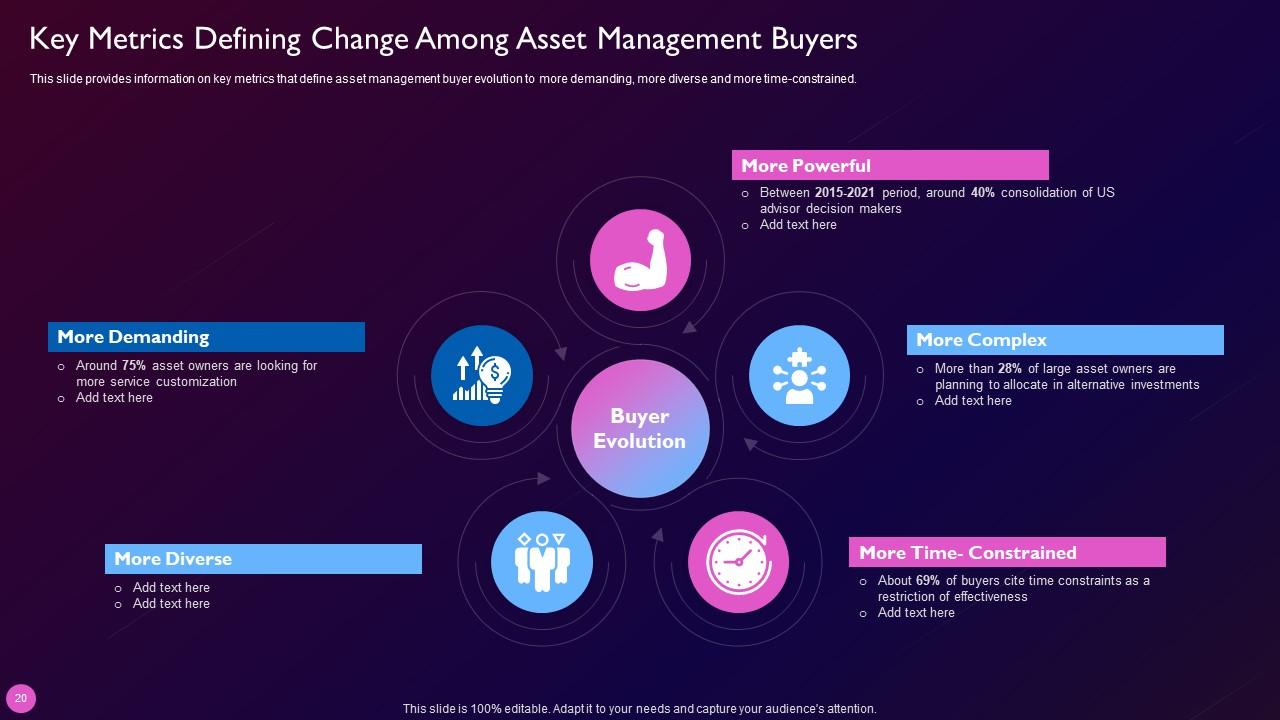
Slide 20: This slide displays Key Metrics Defining Change Among Asset Management Buyers.
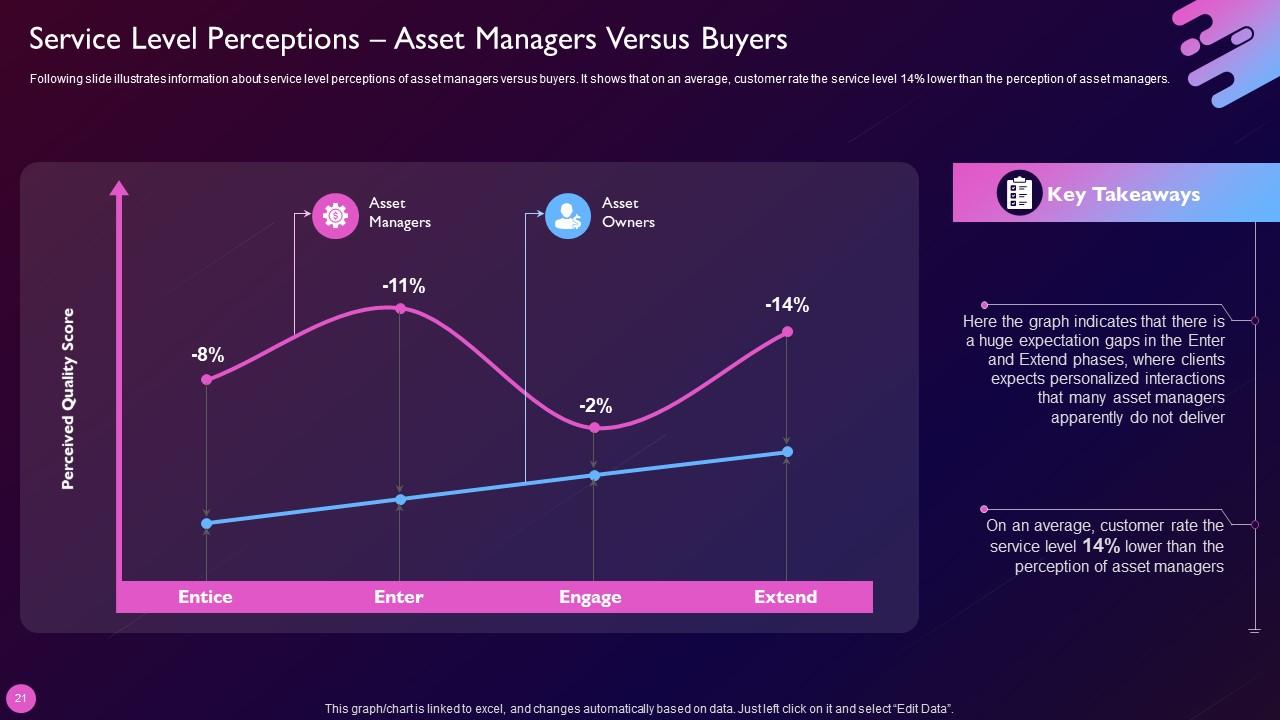
Slide 21: This slide represents service level perceptions of asset managers versus buyers.
Slide 22: This slide highlights title for topics that are to be covered next in the template.
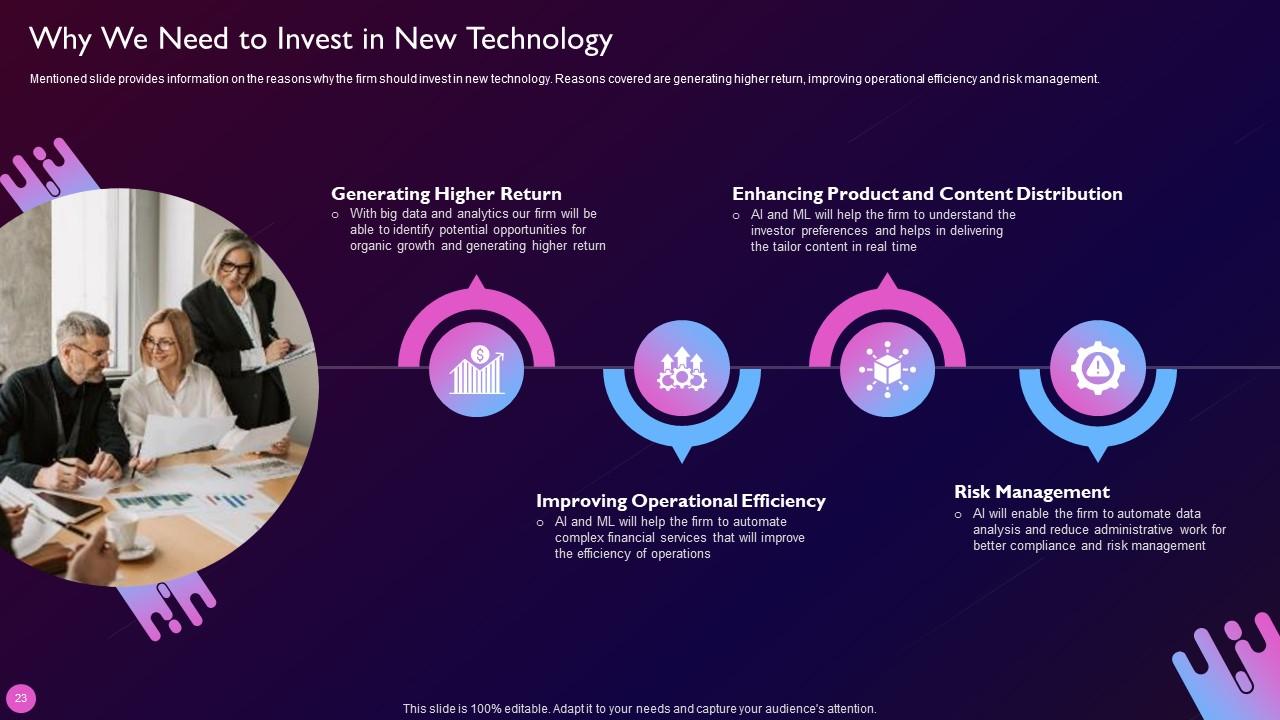
Slide 23: This slide showcases reasons why the firm should invest in new technology.
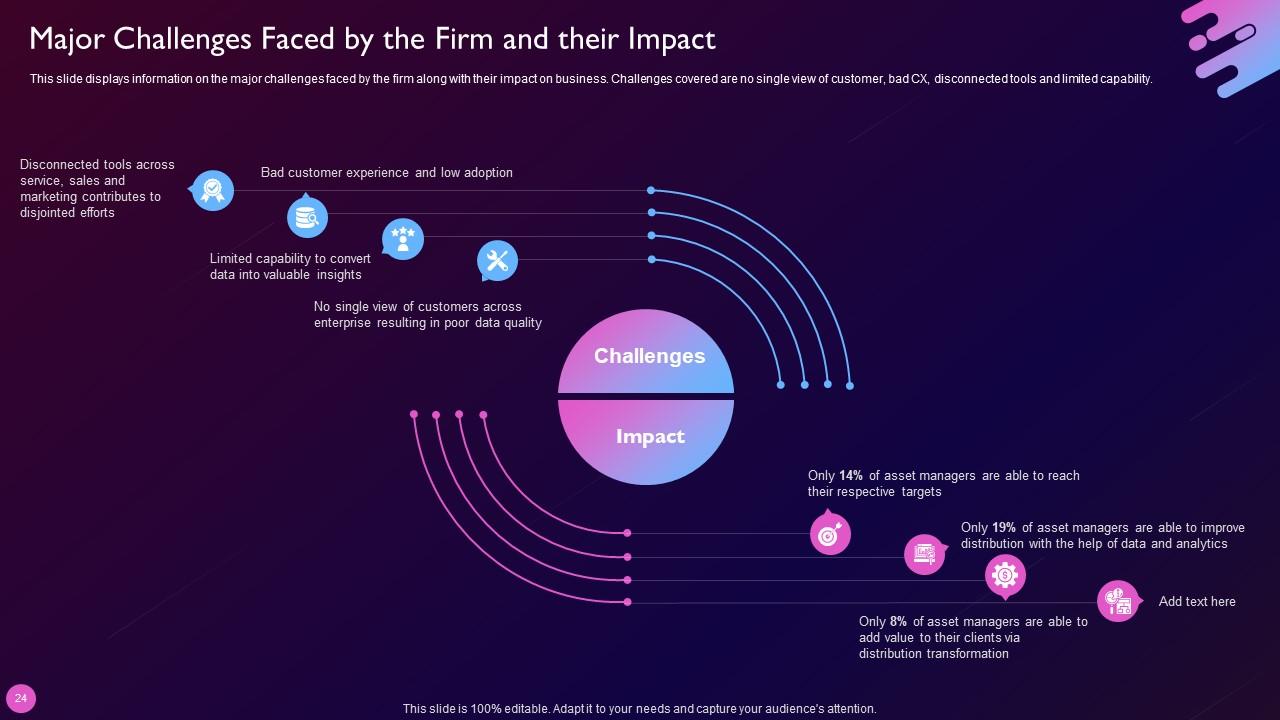
Slide 24: This slide showcases Major Challenges Faced by the Firm and their Impact.
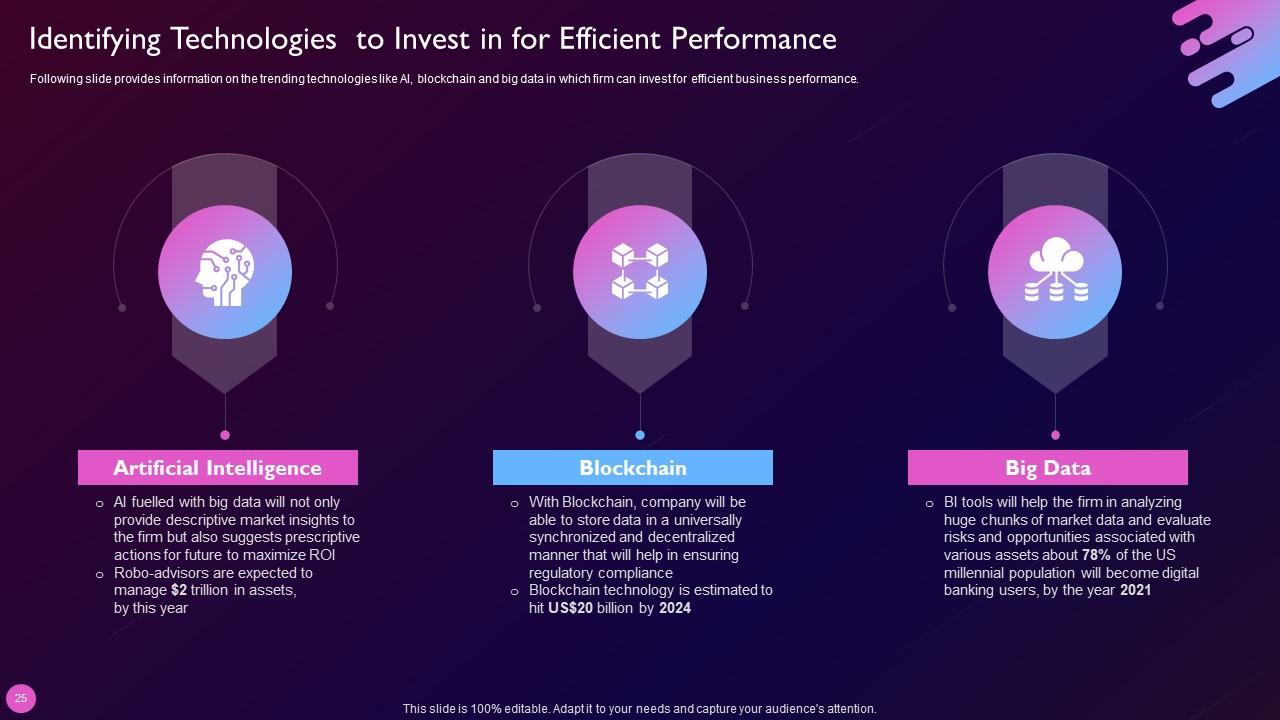
Slide 25: This slide shows Identifying Technologies to Invest in for Efficient Performance.
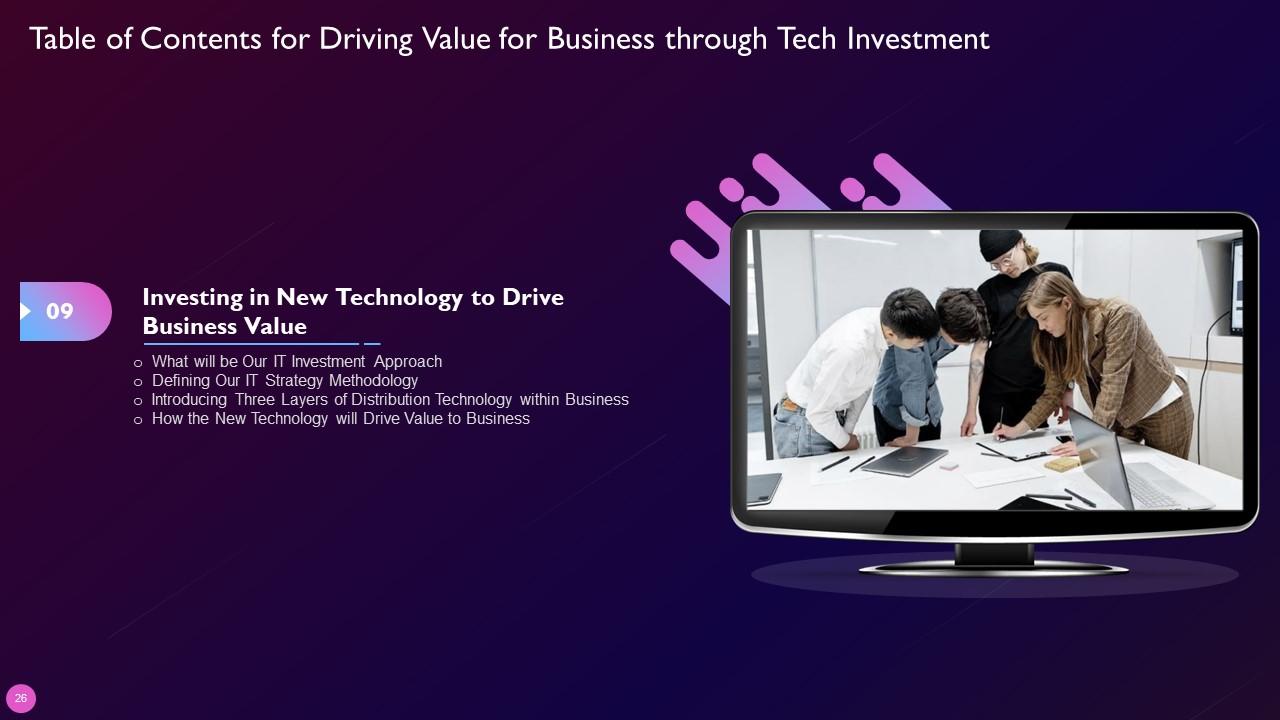
Slide 26: This slide highlights title for topics that are to be covered next in the template.
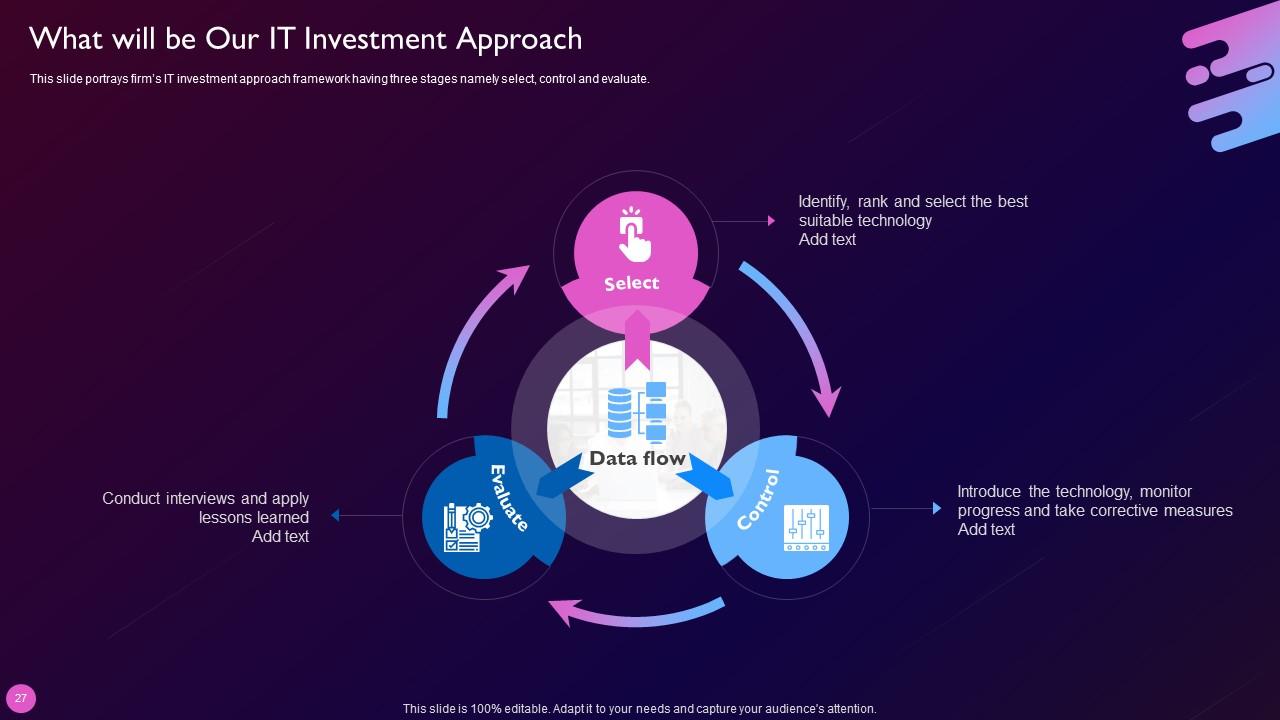
Slide 27: This slide portrays firm’s IT investment approach framework having three stages namely select, control and evaluate.
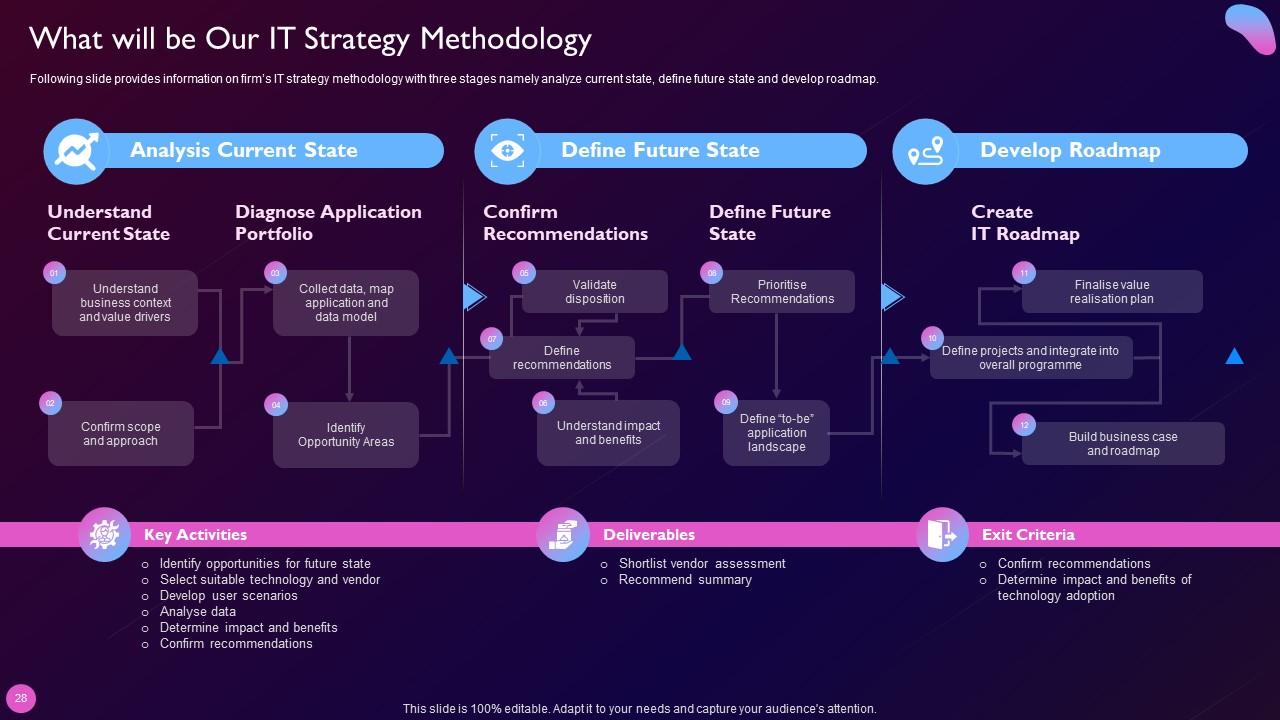
Slide 28: Following slide provides information on firm’s IT strategy methodology.
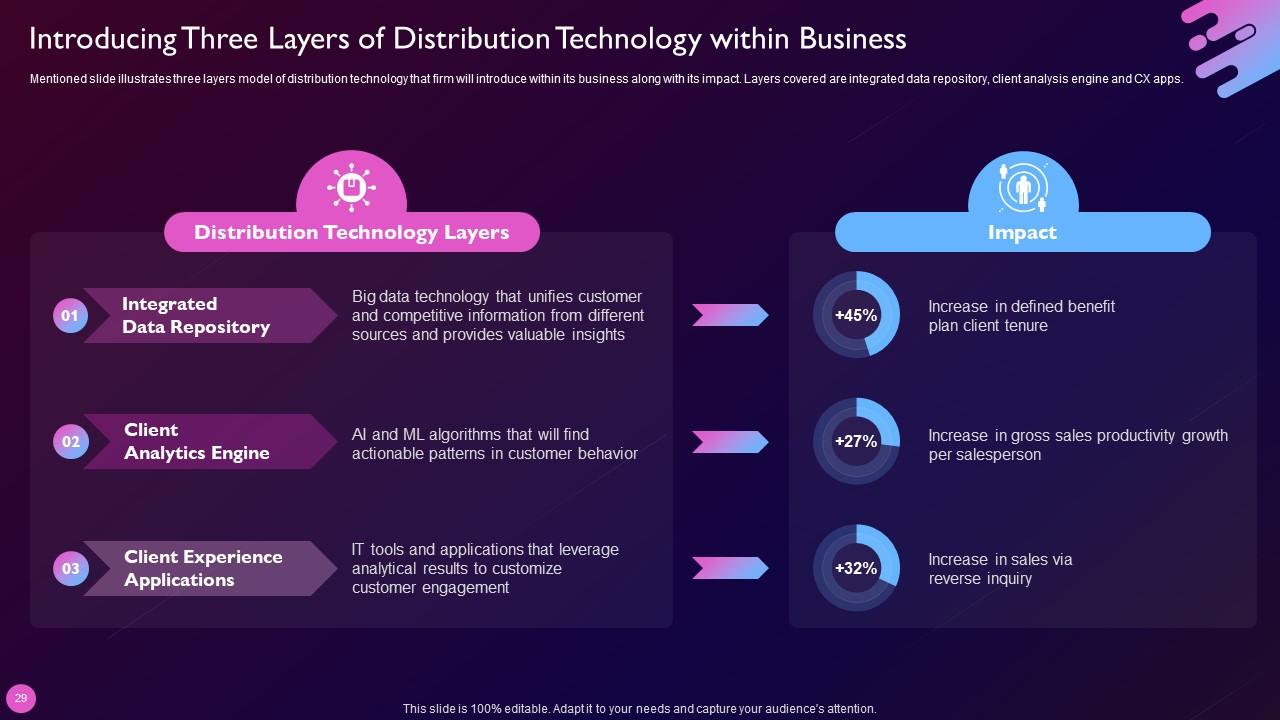
Slide 29: This slide presents Introducing Three Layers of Distribution Technology within Business.
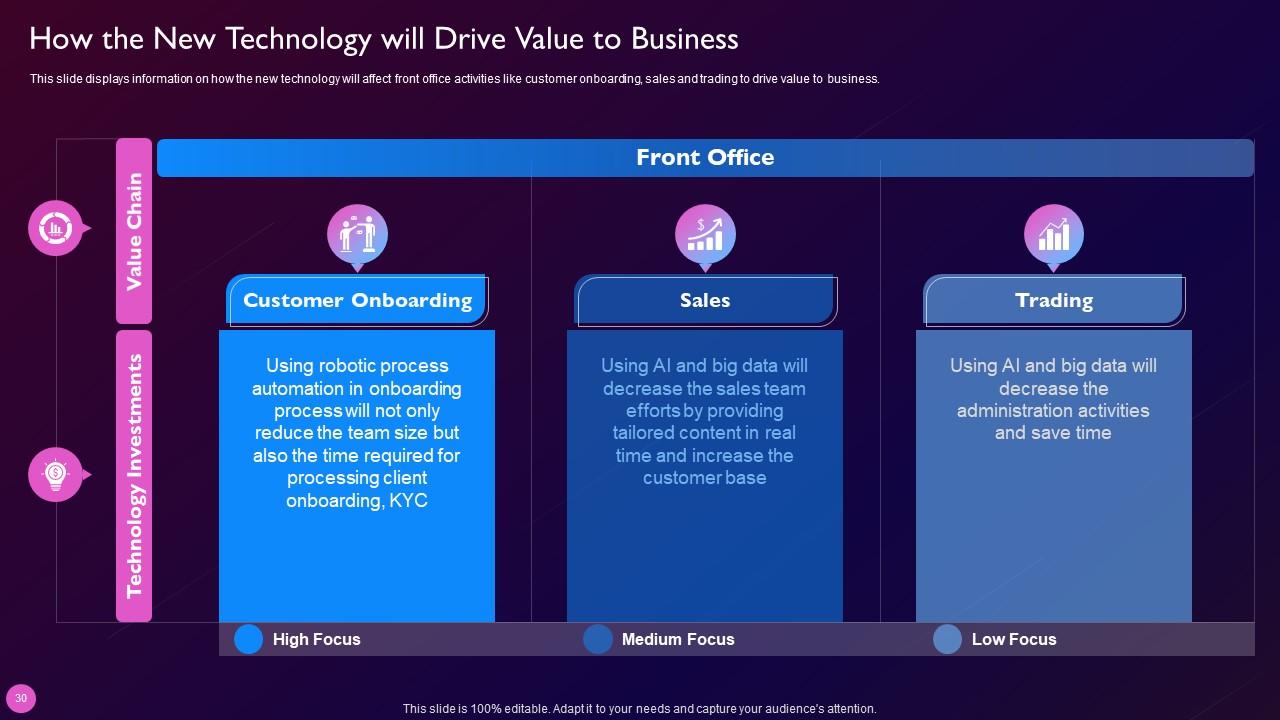
Slide 30: This slide displays How the New Technology will Drive Value to Business.
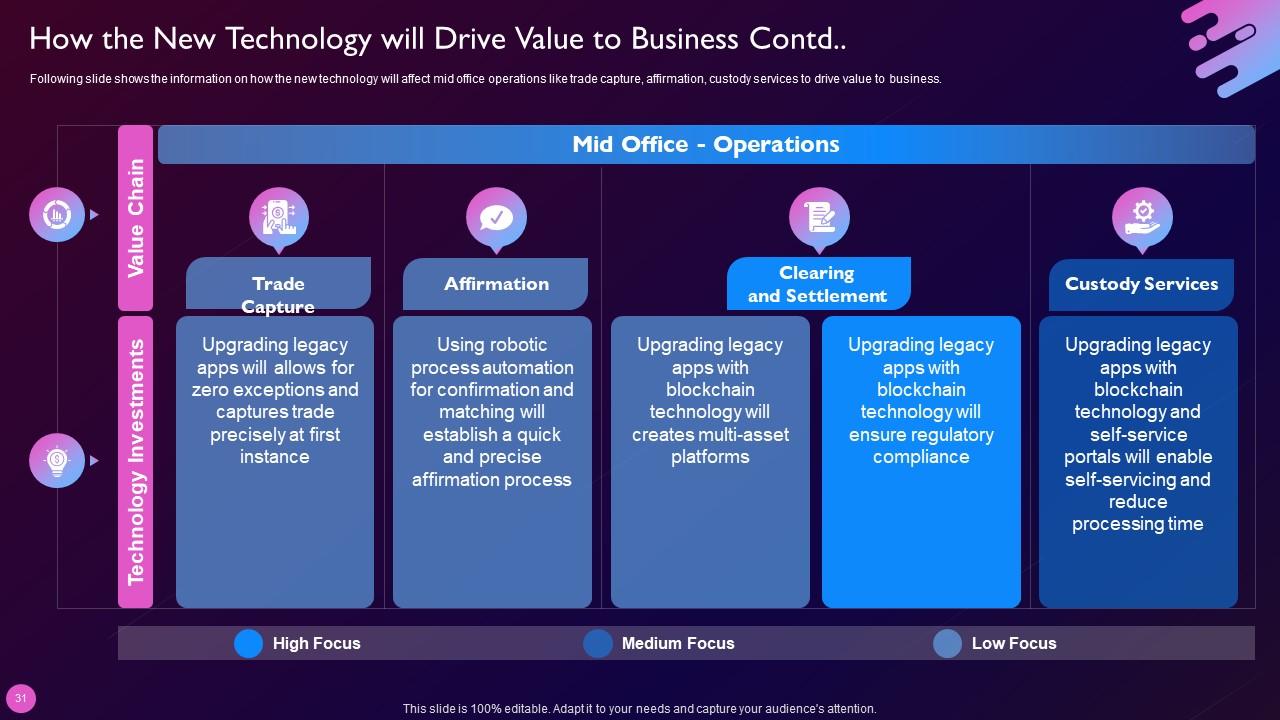
Slide 31: This is another slide continuing How the New Technology will Drive Value to Business.
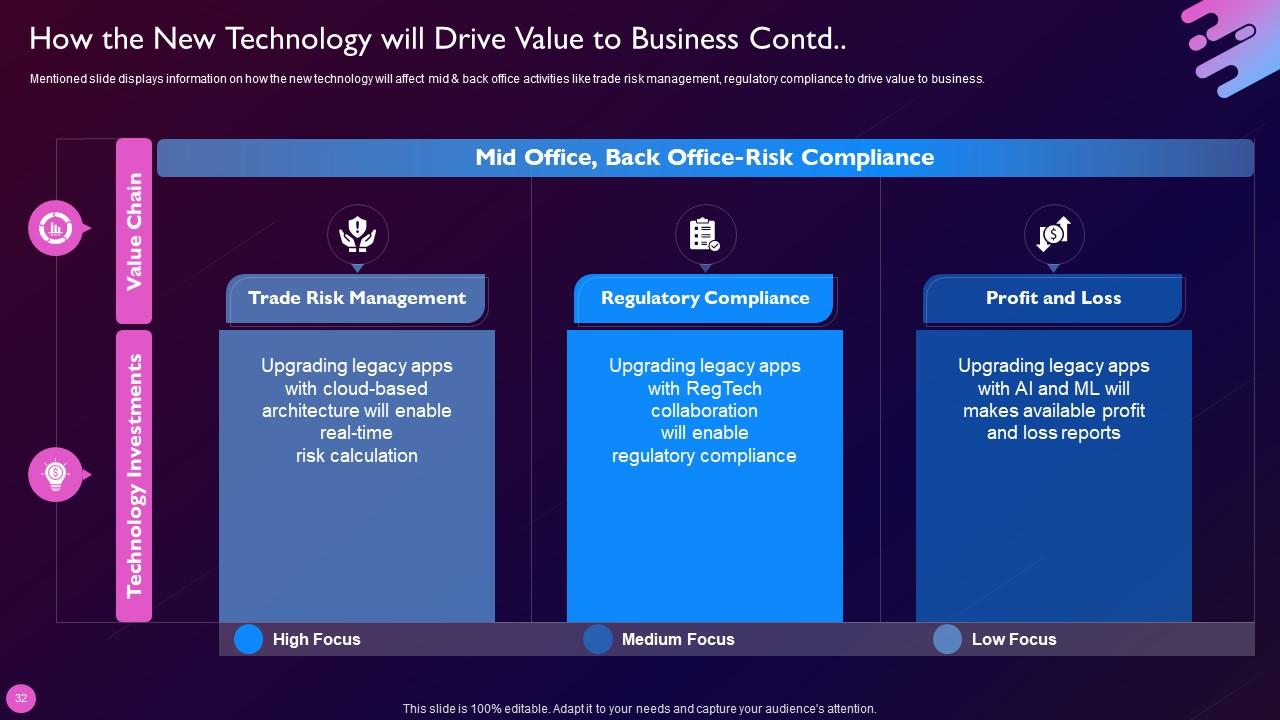
Slide 32: This is another slide continuing How the New Technology will Drive Value to Business.
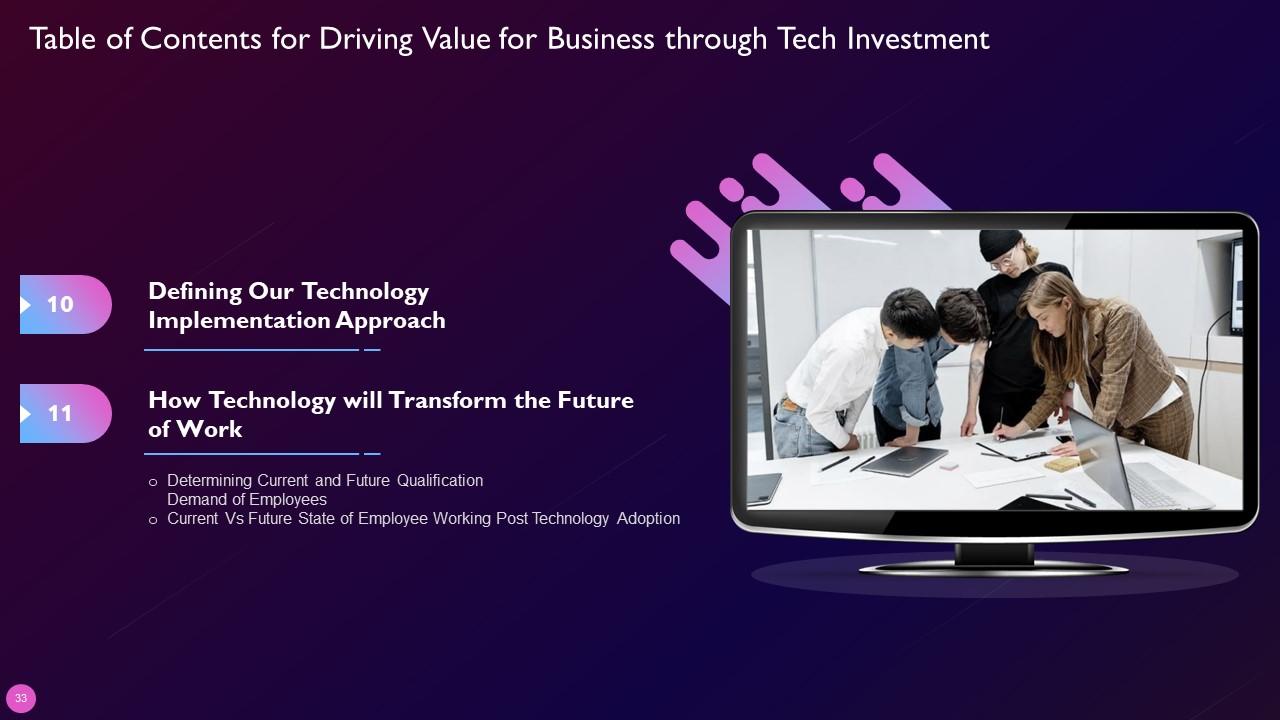
Slide 33: This slide highlights title for topics that are to be covered next in the template.
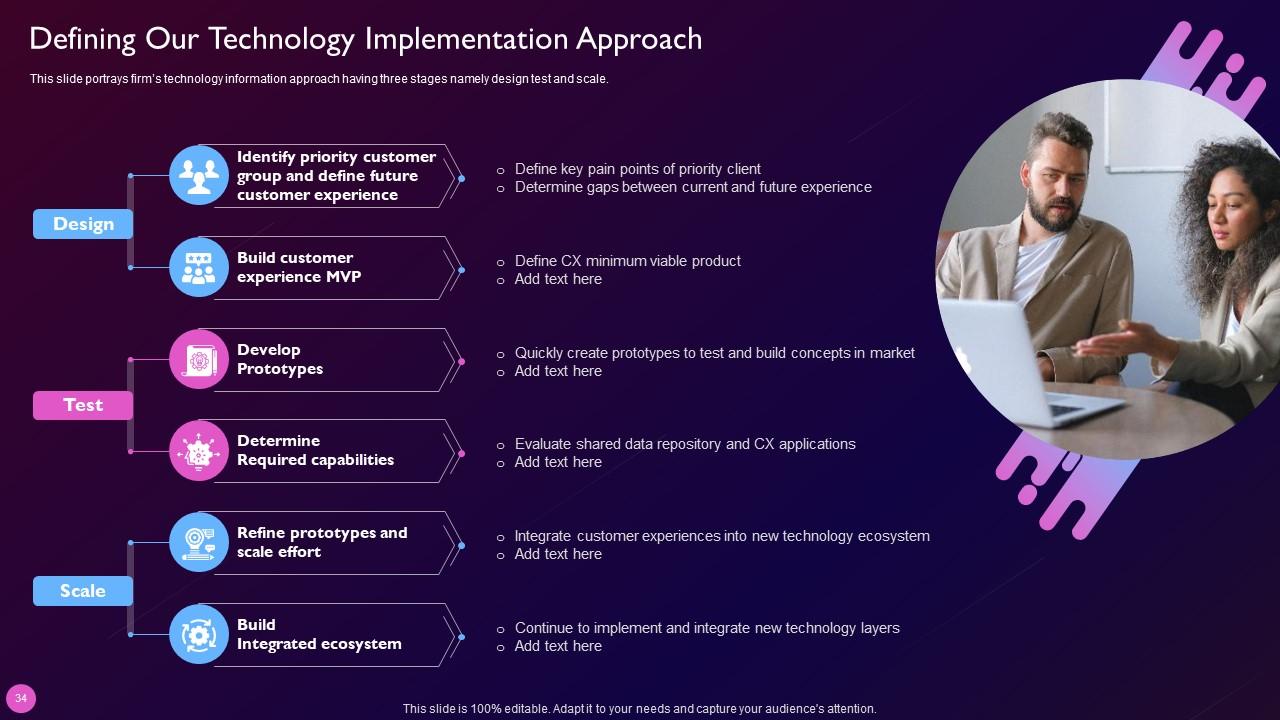
Slide 34: This slide represents Defining Our Technology Implementation Approach.
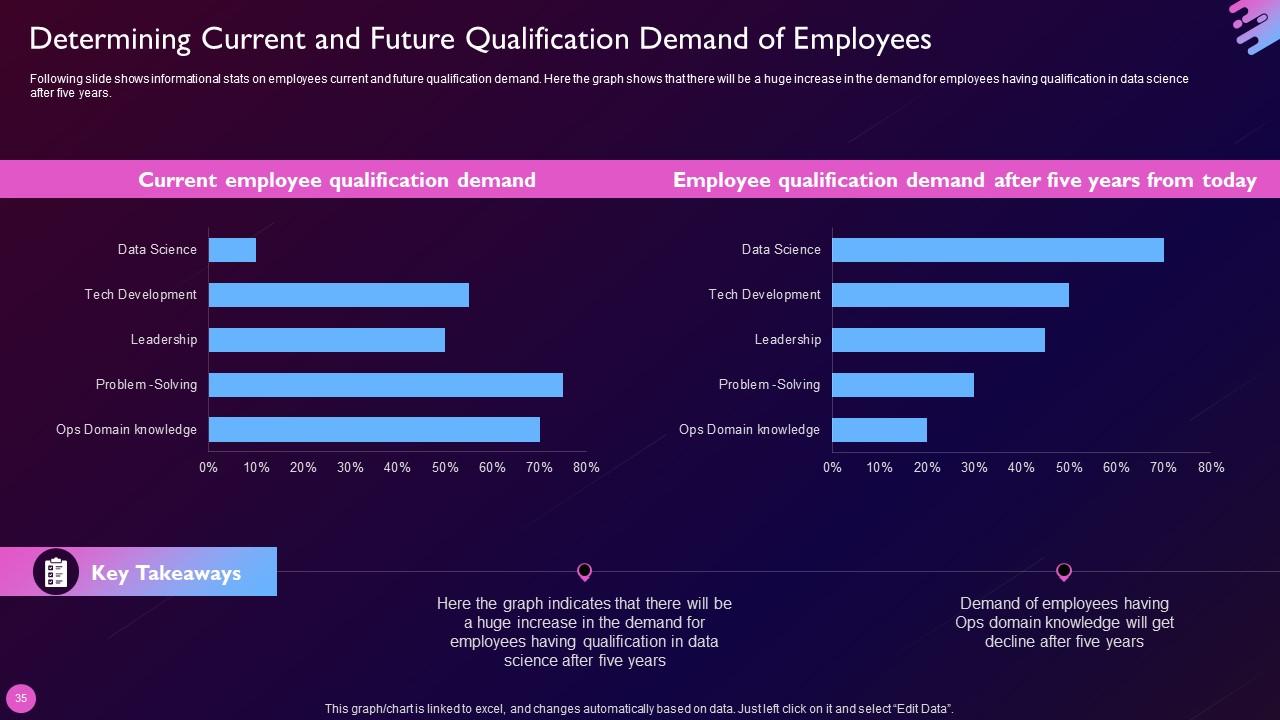
Slide 35: This slide showcases Determining Current and Future Qualification Demand of Employees.
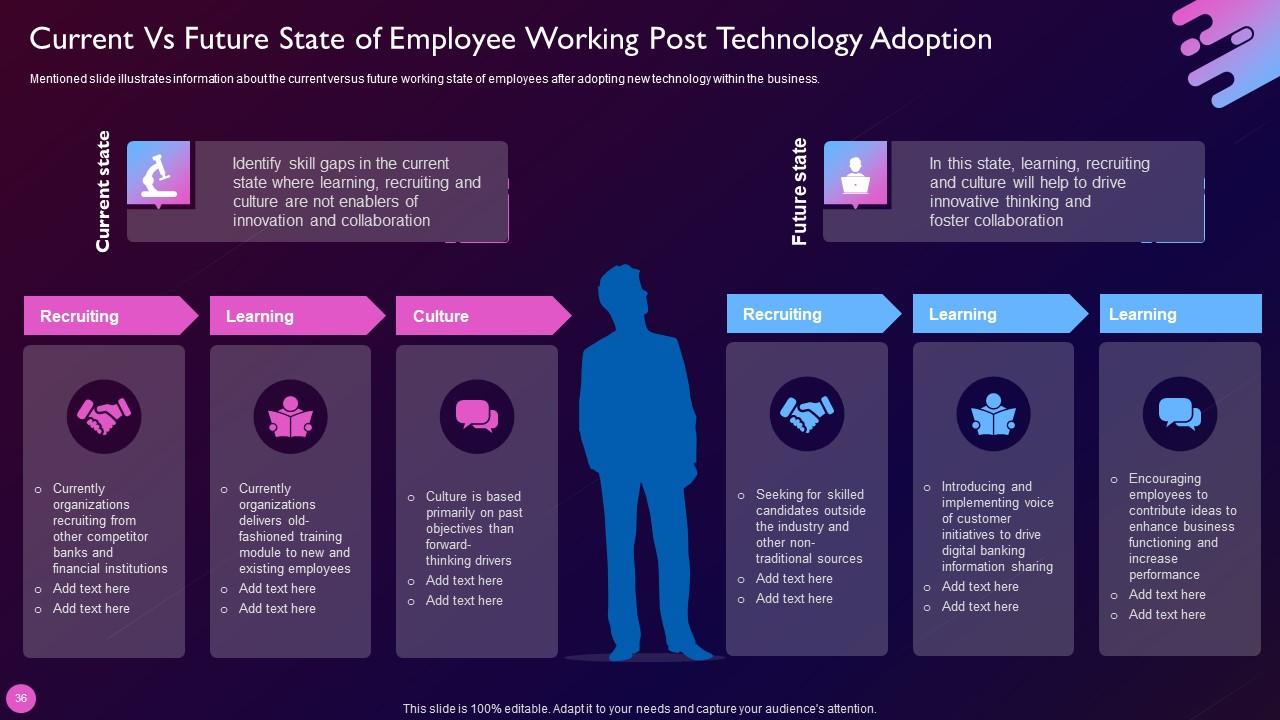
Slide 36: This slide shows Current Vs Future State of Employee Working Post Technology Adoption.
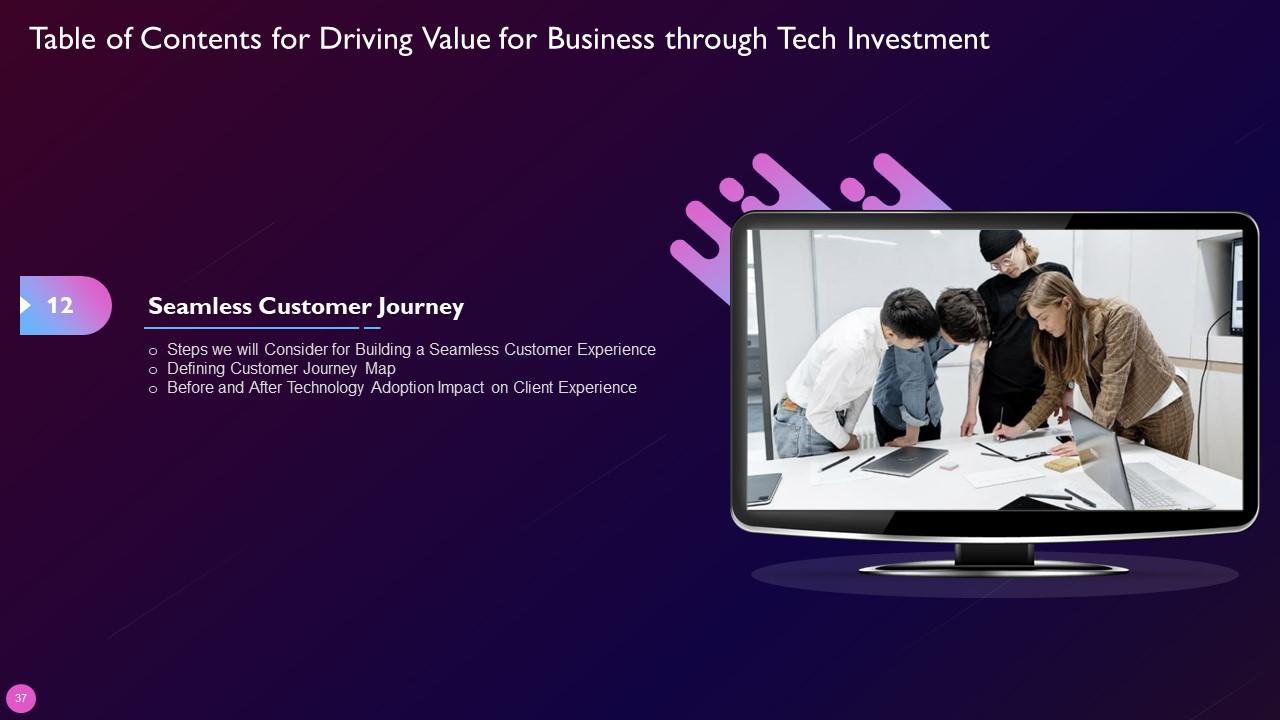
Slide 37: This slide highlights title for topics that are to be covered next in the template.
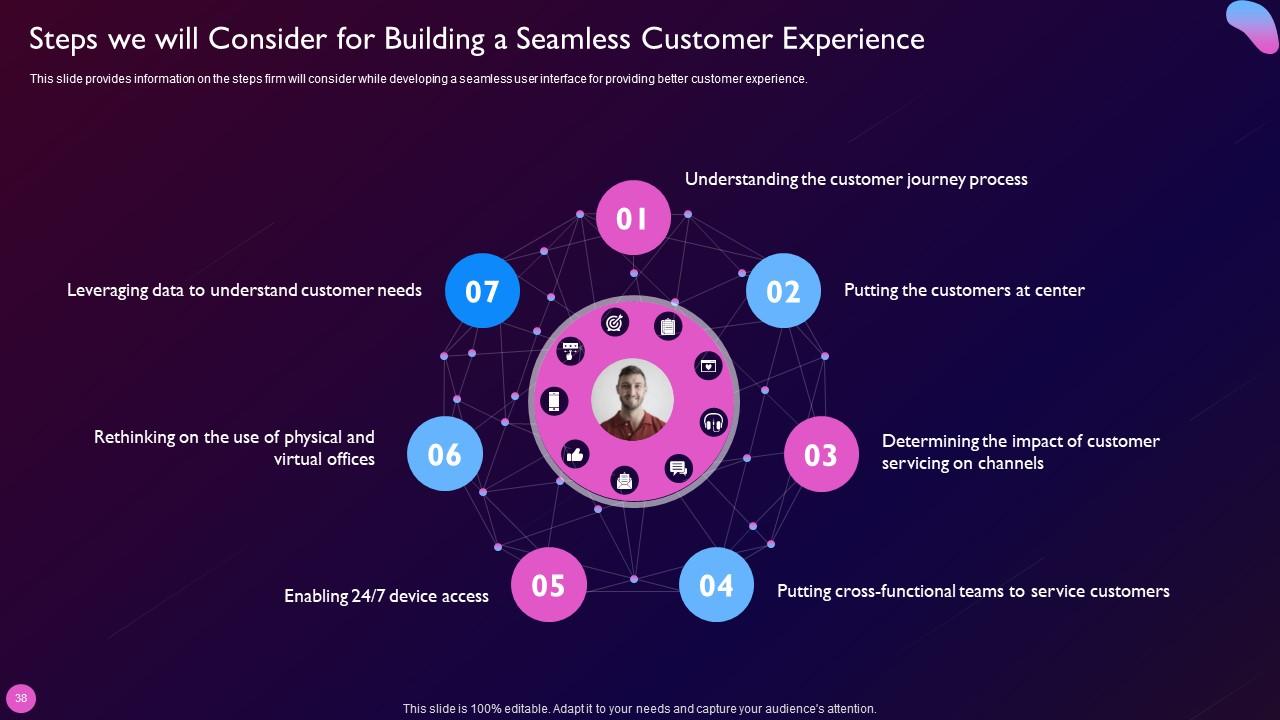
Slide 38: This slide presents Steps We will Consider for Building a Seamless Customer Experience.
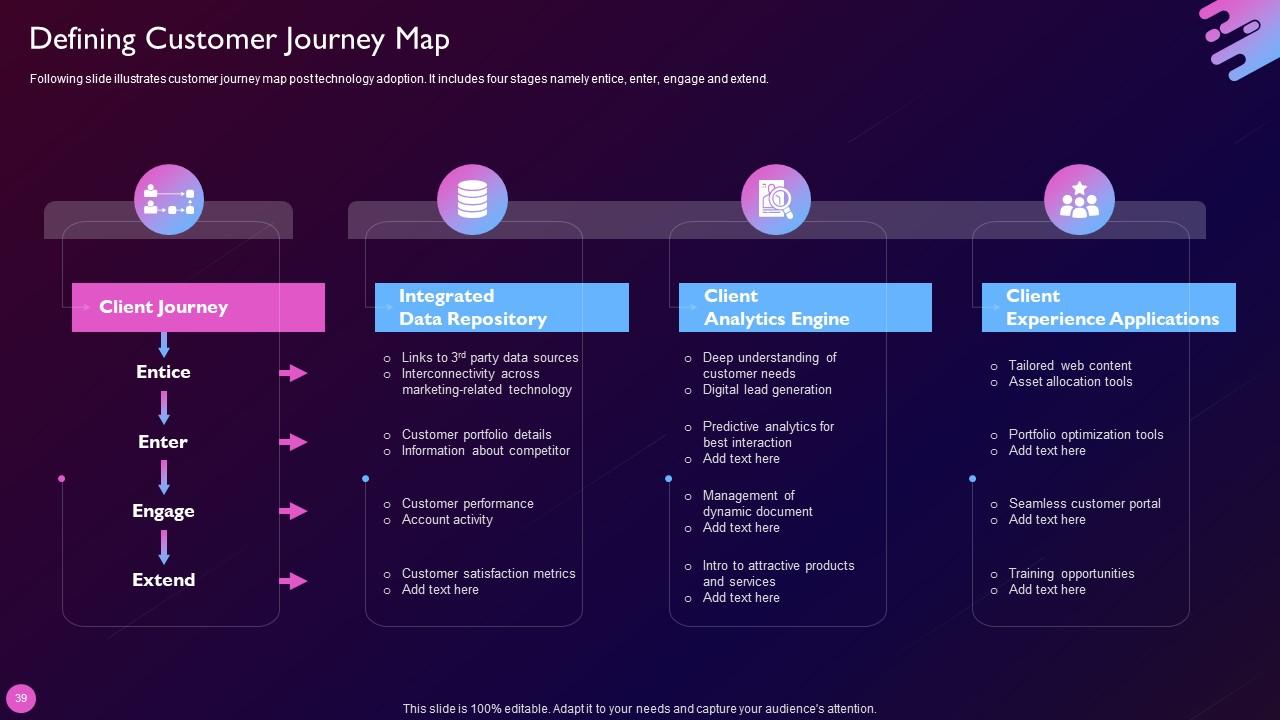
Slide 39: This slide displays customer journey map post technology adoption.
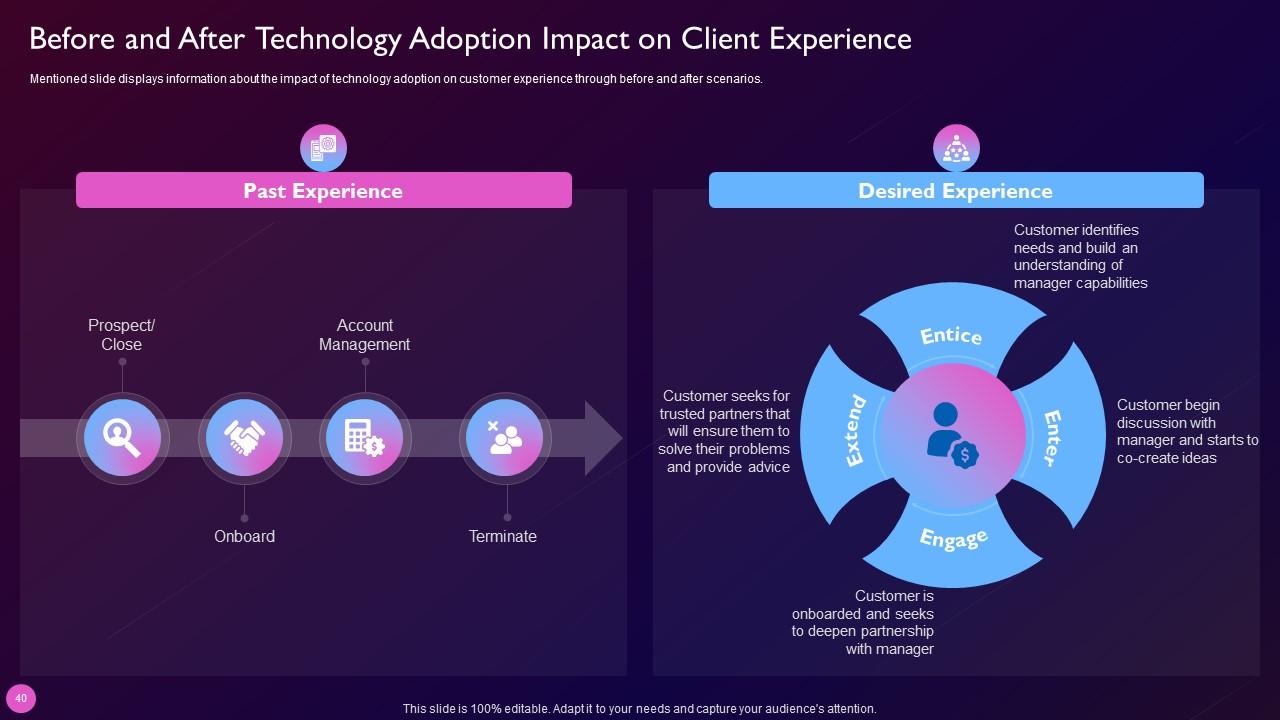
Slide 40: This slide represents Before and After Technology Adoption Impact on Client Experience.
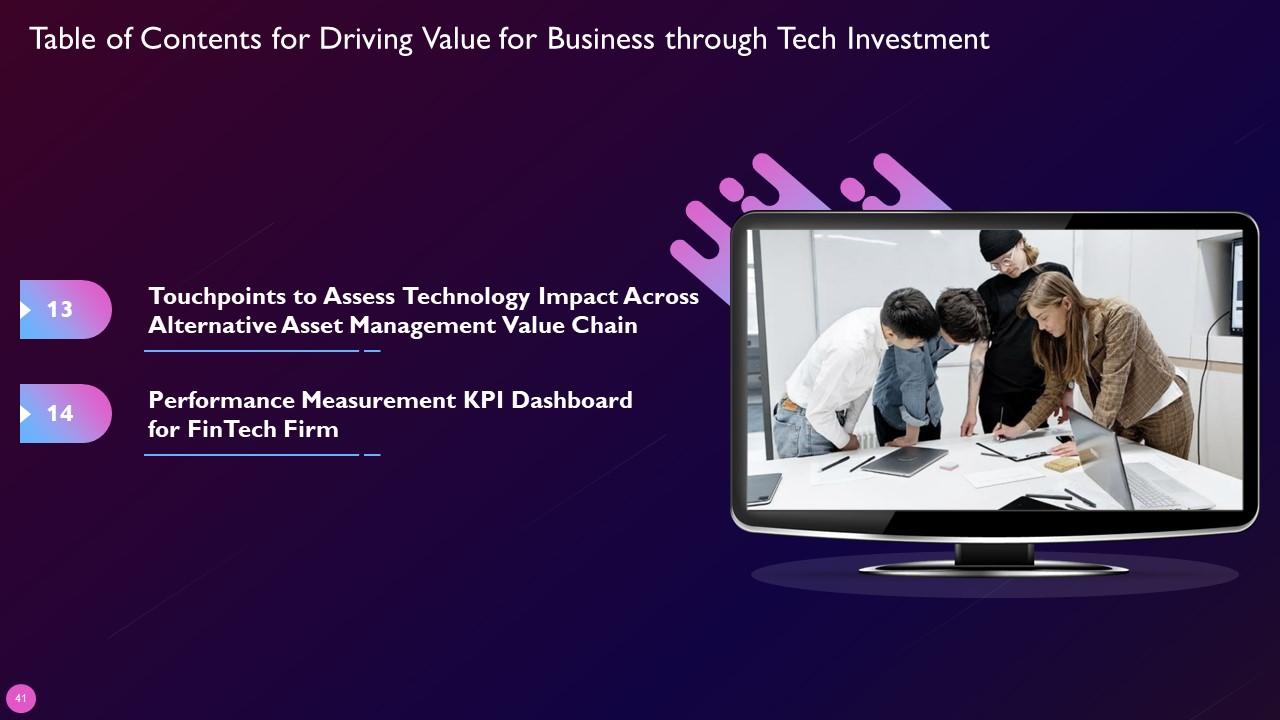
Slide 41: This slide highlights title for topics that are to be covered next in the template.
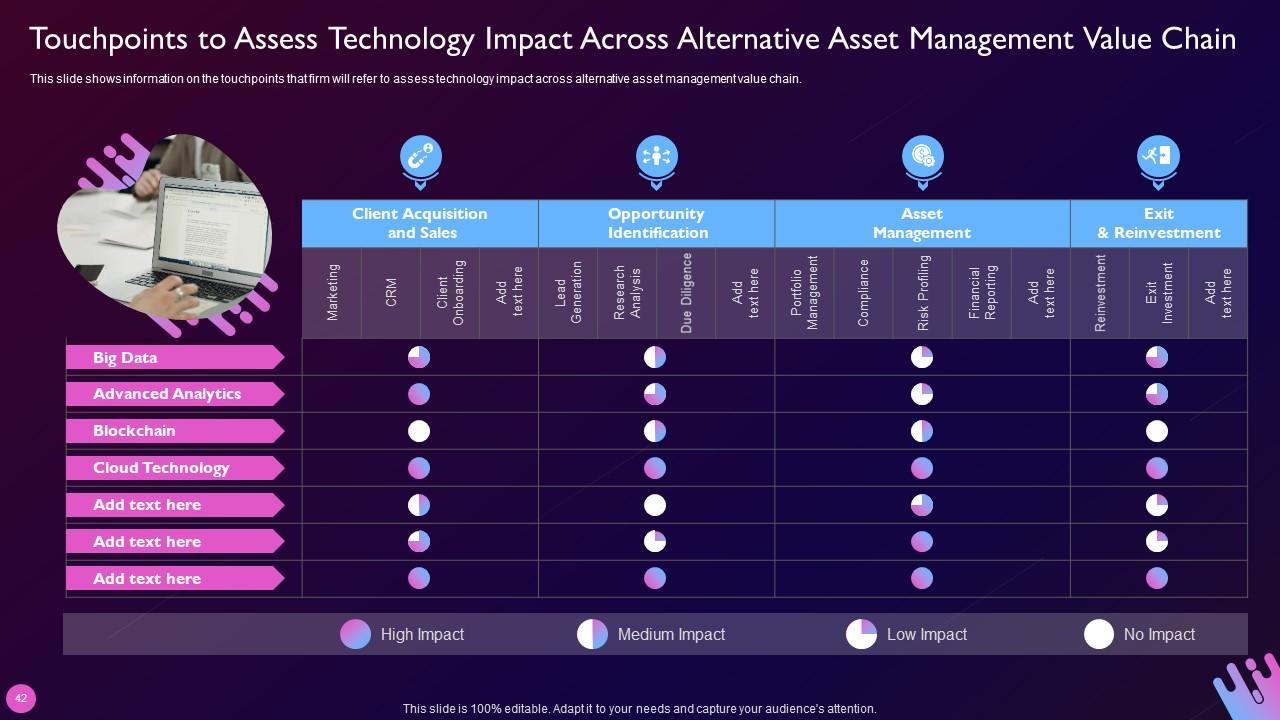
Slide 42: This slide showcases Touchpoints to Assess Technology Impact Across Alternative Asset Management Value Chain.
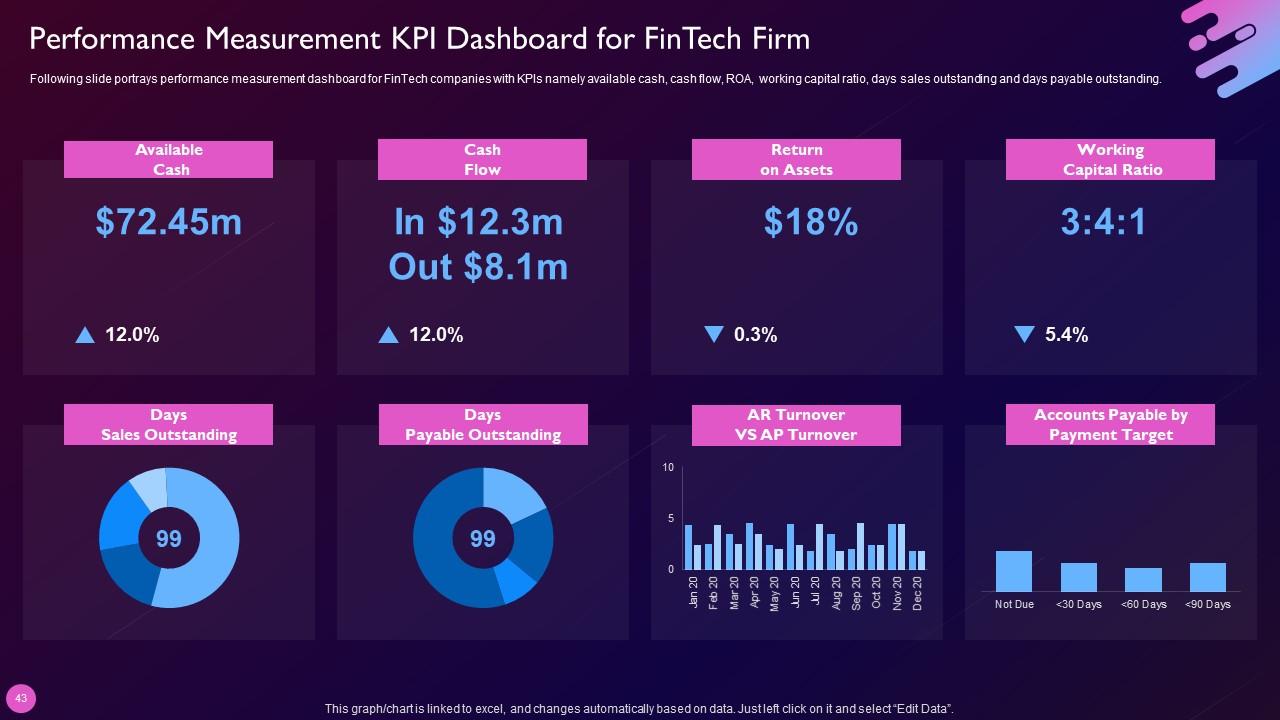
Slide 43: This slide shows Performance Measurement KPI Dashboard for FinTech Firm.
Slide 44: This slide contains all the icons used in this presentation.
Slide 45: This slide is titled as Additional Slides for moving forward.
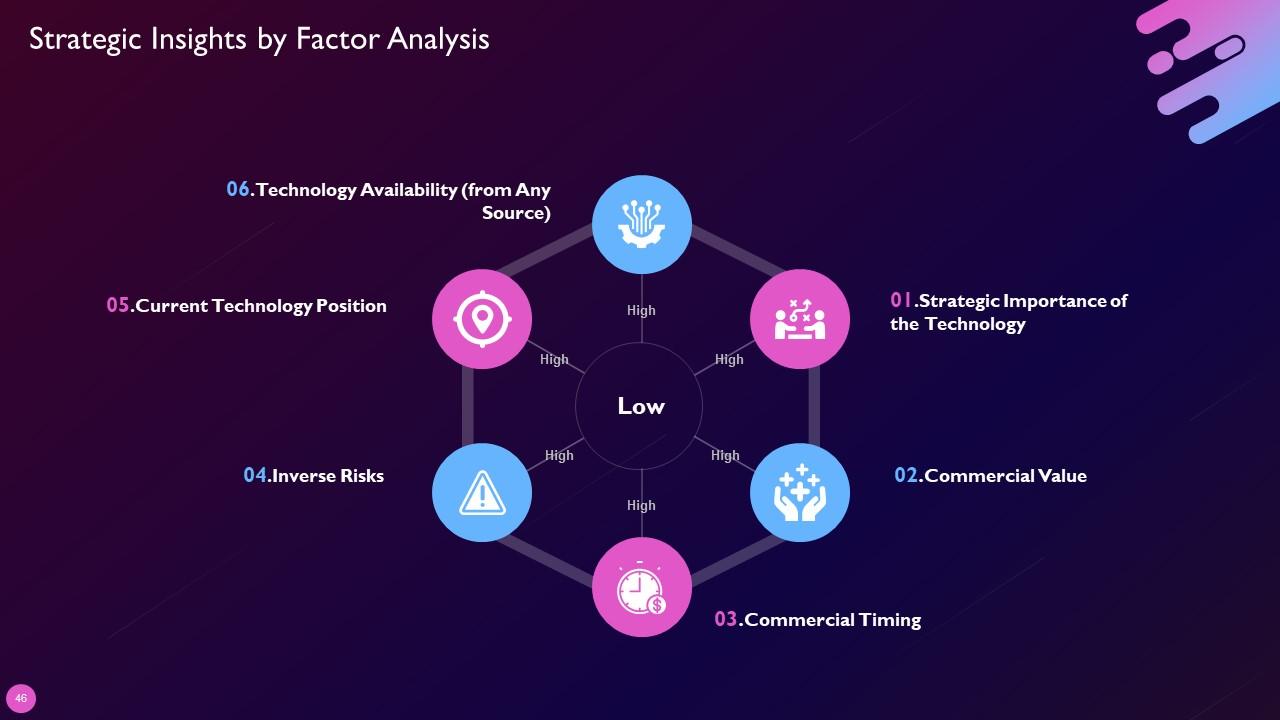
Slide 46: This slide shows Strategic Insights by Factor Analysis.
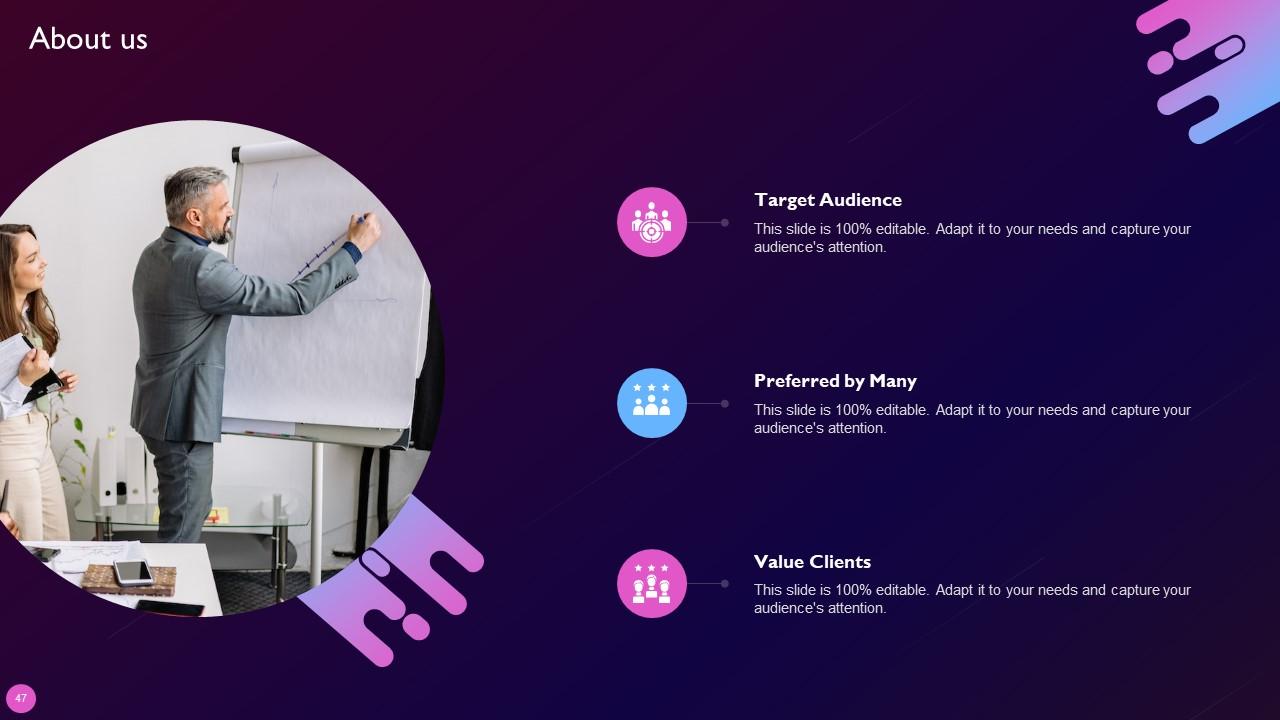
Slide 47: This is About Us slide to show company specifications etc.
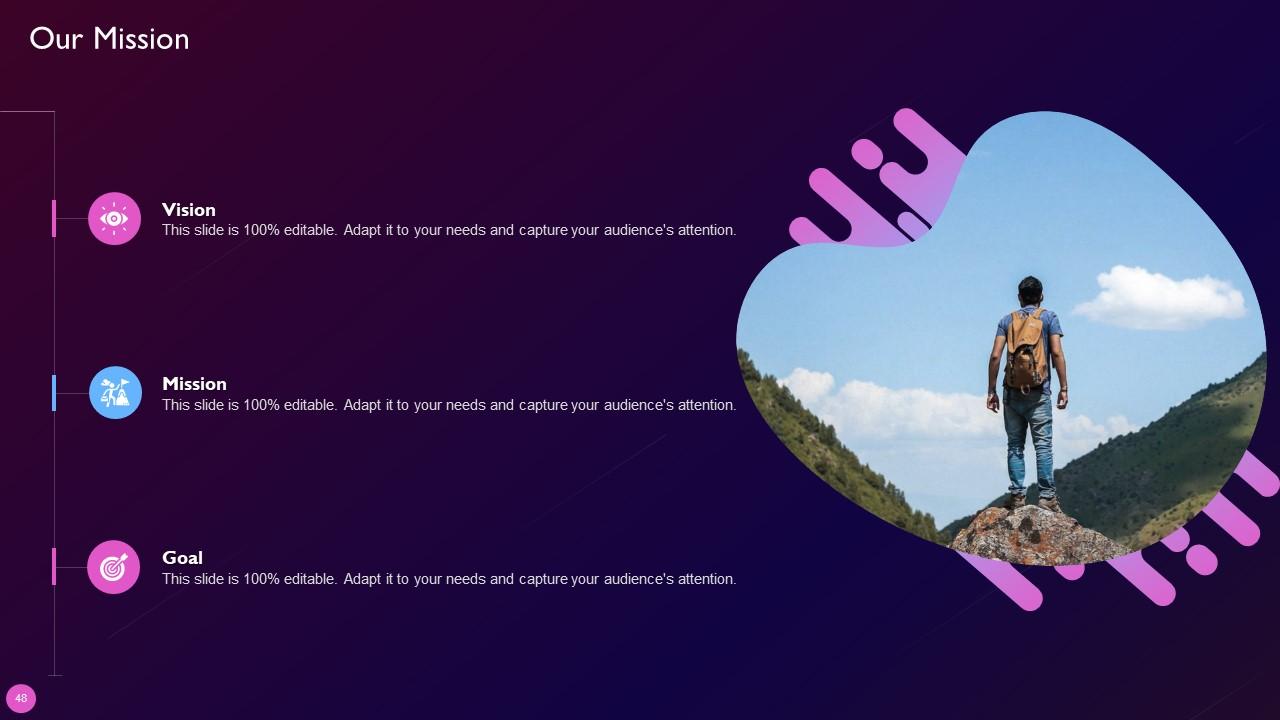
Slide 48: This is Our Mission slide with related imagery and text.
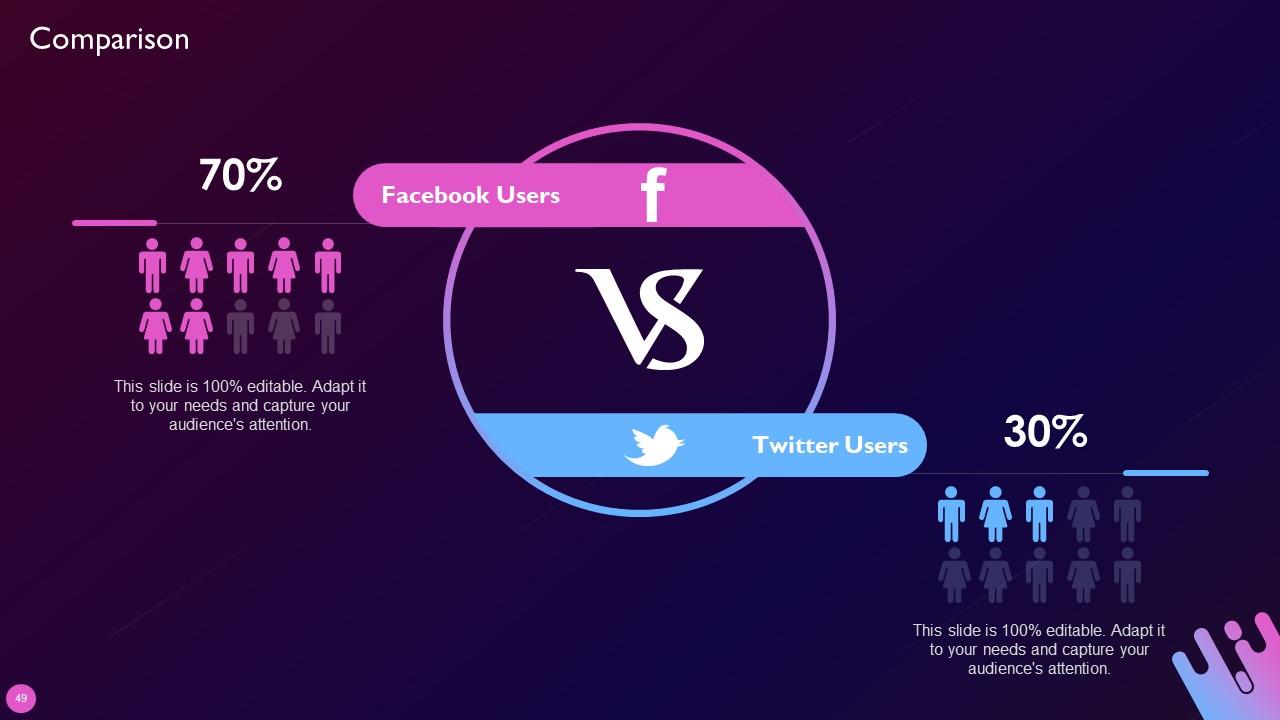
Slide 49: This is a Comparison slide to state comparison between commodities, entities etc.
Slide 50: This is Our Target slide. State your targets here.
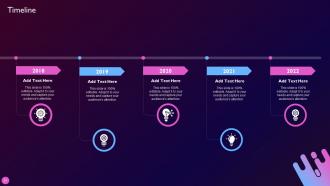
Slide 51: This is a Timeline slide. Show data related to time intervals here.
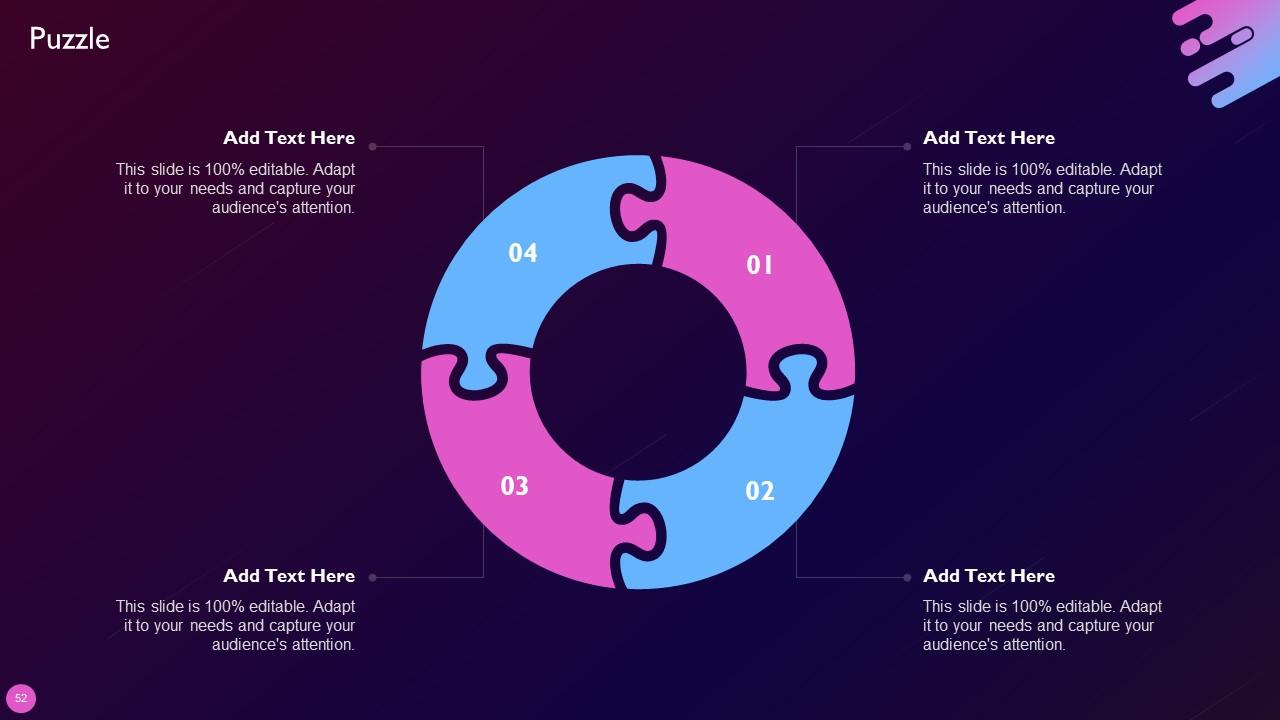
Slide 52: This slide contains Puzzle with related icons and text.
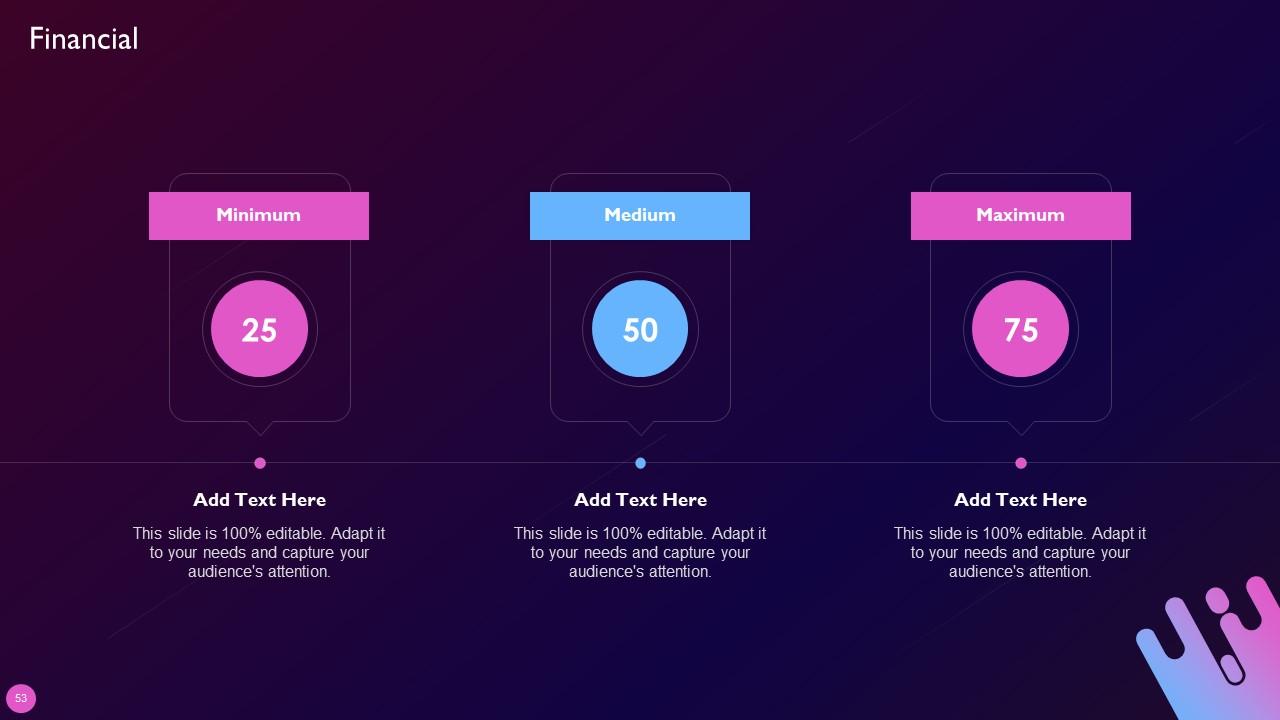
Slide 53: This is a Financial slide. Show your finance related stuff here.
Slide 54: This slide shows Post It Notes. Post your important notes here.
Slide 55: This slide contains Puzzle with related icons and text.
Slide 56: This is a Thank You slide with address, contact numbers and email address.
Driving Value For Business Through Tech Investment Complete Deck with all 61 slides:
Use our Driving Value For Business Through Tech Investment Complete Deck to effectively help you save your valuable time. They are readymade to fit into any presentation structure.
-
Editable, diversified, compatible with MS PPT and Google Slides, and on top of that finest graphics!! I mean in the words of the famous Ross Geller, “What more do you want!”
-
These stunning templates can help you create a presentation like a pro.


