


Earned Value Management To Integrate Schedule Cost And Project Scope Complete Deck




Try Before you Buy Download Free Sample Product
 Impress Your
 Audience
 100%
100% Editable
 Save Hours
 of Time


Grab our Earned Value Management to Integrate Schedule, Cost and Project Scope template. Earned value management EVM is a project management methodology that integrates scheduling, money, and scope to measure project performance. EVM forecasts the future based on intended and actual values, allowing project managers to make adjustments as needed. Our Presentation provides information on the project overview with objectives and goals, schedule timeline, tasks and phases. It also considers the project cost estimation with the proposed budget, the current budget variance status of the project, and the current earned value management performance indicators of the project. Additionally, our PPT exhibits the major financial statistics related to the project and the current earned value statistical overview. It also covers details on the process of improving the accumulated value of the project. Our template further showcases the benefits and outcomes of the selected software package for practical earned value analysis, future estimated budget variance status of the project and future estimated earned value management statistical overview of the company. Lastly, it provides details on solved project problems, the benefits of implementing an efficient project management process and earned value management dashboards. Get access now.
People who downloaded this PowerPoint presentation also viewed the following :
Content of this Powerpoint Presentation
Slide 1: This slide introduces Earned Value Management to Integrate Schedule Cost & Project Scope.
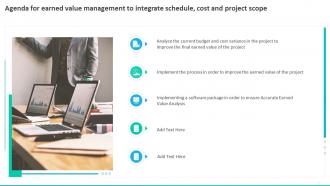
Slide 2: This slide depicts the Agenda of the presentation.
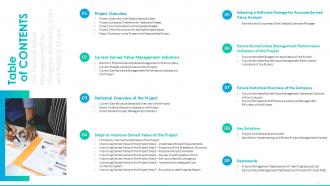
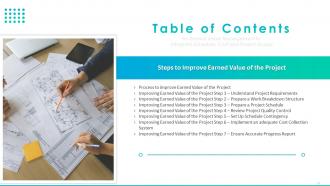
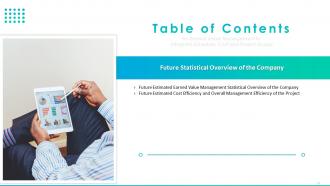
Slide 3: This slide includes the Table of Contents.
Slide 4: This slide highlights the Title for the Topics to be discussed further.
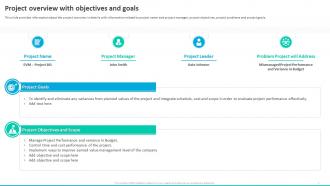
Slide 5: This slide provides information about the project overview in detail.
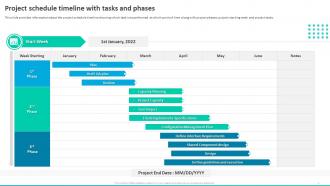
Slide 6: This slide reveals the Project schedule timeline with tasks and phases.
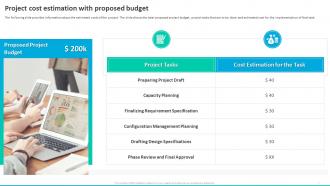
Slide 7: This slide highlights the Project cost estimation with proposed budget.
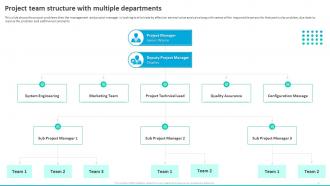
Slide 8: This slide shows the project problems that the management and project manager is looking to eliminate.
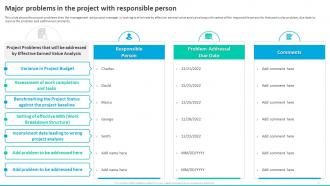
Slide 9: This slide exhibits the Major problems in the project with responsible person.
Slide 10: This slide contains the Heading for the Contents to be covered next.
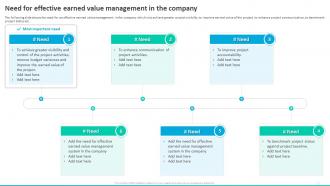
Slide 11: This slide exhibits the Need for effective earned value management in the company.
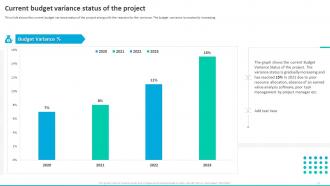
Slide 12: This slide shows the Current budget variance status of the project.
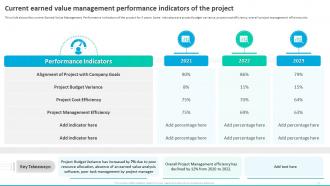
Slide 13: This slide highlights the Current earned value management performance indicators of the project.
Slide 14: This slide displays the Title for the Ideas to be discussed in the upcoming template.
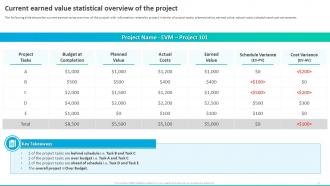
Slide 15: The following slide shows the current earned value overview of the project.
Slide 16: This slide mentions about the Major financial statistics related to the project.
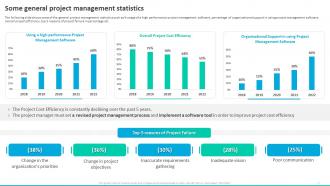
Slide 17: This slide states Some general project management statistics.
Slide 18: This slide indicates the Heading for the Ideas to be covered next.
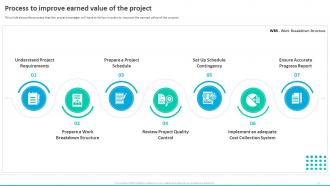
Slide 19: This slide highlights the Process to improve earned value of the project.
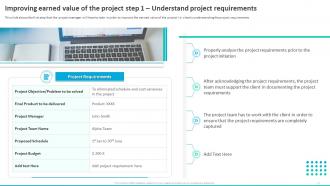
Slide 20: This slide talks about Improving earned value of the project step 1.
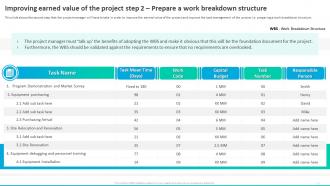
Slide 21: This slide shows the second step that the project manager will have to take in order to improve the earned value of the project.
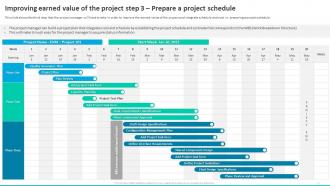
Slide 22: This slide deals with Improving earned value of the project step 3.
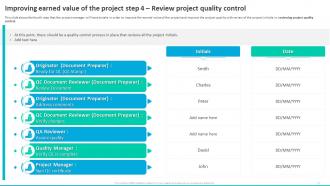
Slide 23: This slide shows Improving earned value of the project step 4.
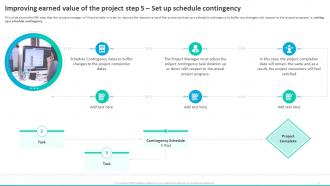
Slide 24: This slide highlights Improving earned value of the project step 5.
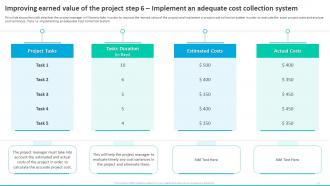
Slide 25: This slide states the sixth step that the project manager will have to take in order to improve the earned value of the project.
Slide 26: This slide talks about Improving earned value of the project step 7.
Slide 27: This slide indicates the Title for the Contents to be further discussed.
Slide 28: This slide focuses on Selecting a software package for accurate earned value analysis.
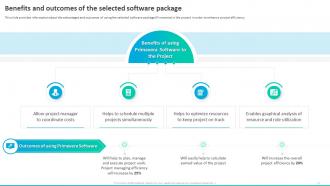
Slide 29: This slide exhibits the Benefits and outcomes of the selected software package.
Slide 30: This slide states the Heading for the Topics to be covered next.
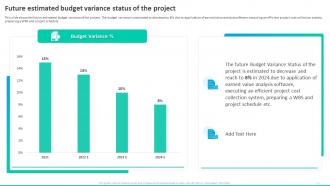
Slide 31: This slide shows the future estimated budget variance of the project.
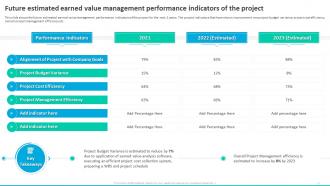
Slide 32: This slide reveals the Future estimated earned value management performance indicators of the project.
Slide 33: This slide contains the Title for the Topics to be discussed further.
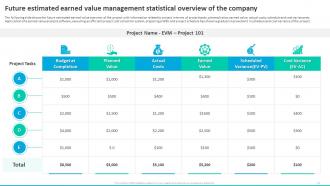
Slide 34: The following slide shows the future estimated earned value overview of the project.
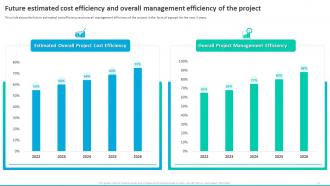
Slide 35: This slide reveals the future estimated cost efficiency and overall management efficiency of the project.
Slide 36: This slide indicates the Heading for the Contents to be covered next.
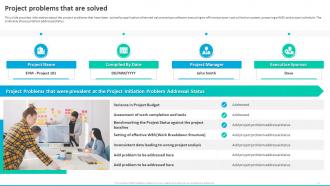
Slide 37: This slide presets the Project problems that are solved.
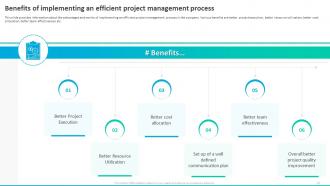
Slide 38: This slide focuses on the Benefits of implementing an efficient project management process.
Slide 39: This slide portrays the Title for the Ideas to be discussed further.
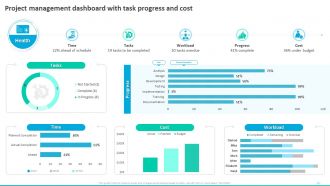
Slide 40: This slide illustrates the Project management dashboard with task progress and cost.
Slide 41: This slide exhibits the Project management dashboard with task progress and cost.
Slide 42: This is the Icons slide containing all the Icons used in the plan.
Slide 43: This slide is used for depicting some Additional information.
Slide 44: This slide elucidates the Hierarchy.
Slide 45: This is the Stacked chart slide.
Slide 46: This slide reveals the Pyramid.
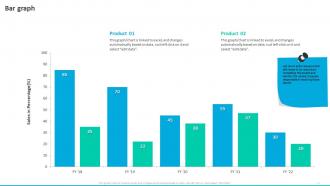
Slide 47: This is the Bar graph slide.
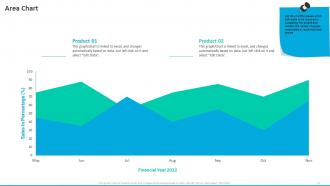
Slide 48: This slide presents the Area Chart.
Slide 49: This slide presents the Column chart.
Slide 50: This slide highlights the firm's Timeline.
Slide 51: This is the Venn diagram slide.
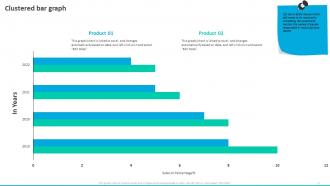
Slide 52: This is the Clustered bar graph slide.
Slide 53: This slide showcases the Circular process.
Slide 54: This slide indicates the Mind map of the organization.
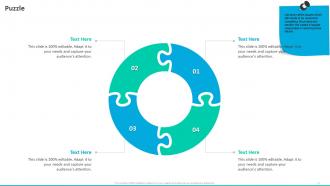
Slide 55: This is the Puzzle slide with related imagery.
Slide 56: This slide lists the organizational goals.
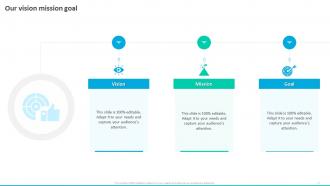
Slide 57: This slide incorporates the firm's vision, mission, and goal.
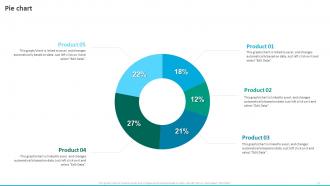
Slide 58: This slide elucidates the Pie chart.
Slide 59: This is the Idea generation sldie for encouraging innovative ideas.
Slide 60: This is the Bulb and idea slide with related imagery.
Slide 61: This slide represents the Spokes.
Slide 62: This slide displays the Matrix.
Slide 63: This is the Gear slide.
Slide 64: This slide shows the Concentric slide.
Slide 65: This is our Hub spoke slide.
Slide 66: This slide represents the Zig - Zag.
Slide 67: This slide presents the Roadmap of the company.
Slide 68: This slide reveals the Flowchart.
Slide 69: This is the Thank You slide for acknowledgement.
Earned Value Management To Integrate Schedule Cost And Project Scope Complete Deck with all 74 slides:
Use our Earned Value Management To Integrate Schedule Cost And Project Scope Complete Deck to effectively help you save your valuable time. They are readymade to fit into any presentation structure.













FAQs for Earned Value Management To Integrate Schedule Cost And Project
So you've got three main things to track: PV, EV, and AC. PV is your planned budget up to this point. EV shows the actual value of work you've finished. AC is what you've really spent so far - honestly, this one trips people up the most. Once you nail down clean data for these three, calculating your schedule and cost variances becomes way easier. I'd focus on getting solid numbers for those components first. Then you can start building out the rest of your EVM reports from there.
EVM fits pretty smoothly into whatever methodology you're already using - waterfall, PMBOK, whatever. Just layer the financial tracking on top of your existing WBS and milestones. The acronyms are honestly stupid, but you're just comparing three numbers: planned value, earned value, and actual costs. Most PM tools have this stuff built in already, so don't overthink it. I'd say start small - track those three metrics on your next project and watch how the performance indicators catch issues way before your regular status reports do. Way better early warning system than I expected when I first tried it.
So CPI is just Earned Value divided by Actual Cost - pretty straightforward math. If you hit 1.0, you're spending exactly what you budgeted for the work done. Above 1.0? You're crushing it under budget. Below 1.0 means you're bleeding money faster than planned. Honestly, I like it way better than staring at random dollar figures trying to figure out what's going on. It gives you this clean efficiency ratio that makes problems obvious right away. Catch cost issues early and you won't be scrambling later when everything's already gone sideways.
So you take your budgeted cost (BCWS) and multiply it by how much work you've actually finished. Like if your project's $100K and you're 30% complete, your EV is $30K. The real pain though? Figuring out that completion percentage accurately. I've seen too many projects get stuck in "90% done" hell where nothing ever seems to actually finish. You need solid milestones to track against. Don't just go by hours worked - that's misleading. Focus on what's actually been delivered and completed.
So schedule variance is like your project's health check for timing - it tells you if you're running late or early based on actual work done vs what you planned. Quick math: earned value minus planned value. Negative number? You're behind. Positive? You're cruising ahead of schedule. I swear, checking this weekly has saved my ass more times than I can count. The whole point is catching problems before they snowball into total disasters. When you see trends going south, that's your cue to shuffle resources around or maybe cut some scope.
Yeah totally! You'll need to adjust how you track things though. Measure earned value after each sprint using your completed story points instead of the usual baseline approach. The scope changes way more than waterfall (honestly makes it more fun imo). Calculate your schedule and cost variance after every iteration - gives you solid real-time data on team velocity and budget burn. Just update your baseline regularly when scope shifts happen. It's definitely doable, just requires tweaking your measurement approach.
Honestly, data quality is your biggest enemy here. People just dump random numbers in because they think it's busywork. Getting buy-in is brutal too - half your team will roll their eyes at the whole thing. Training sessions are where souls go to die, I swear. Most folks zone out completely. Your current PM processes probably won't play nice with EVM either, so you'll end up with this weird frankenstein setup. Oh, and don't even think about going company-wide right away. Pick one small project first, nail the training part, then expand from there.
So basically EVM cuts through all the BS and shows you real numbers about your project. No more wondering if you're actually on track or just hoping for the best. The schedule and cost performance indexes tell you exactly where you stand - super helpful honestly. What I love most is the forecasting part though. You can see your estimate-at-completion based on how things are actually going, not just your original guess. Problems show up way earlier this way. Track your earned value every week and watch those trends - they'll save your butt when planning the next project.
Look, SPI and CPI are your best friends here - they show schedule and cost performance in simple ratios. Above 1.0 means you're doing well, below means trouble. Most executives honestly don't want the technical deep dive anyway. SPI tells them if you're on time, CPI shows if you're burning through budget efficiently. Always throw in EAC too since they're constantly asking "what's this gonna cost us in the end?" Charts work way better than spreadsheets - nobody wants to squint at raw numbers. Keep it visual and you'll actually hold their attention.
So basically EVM compares your planned spend vs actual spend vs work done. Pretty straightforward stuff. When your cost performance dips below 1.0 or schedule performance starts going sideways, that's your red flag before things get ugly. Think of it like a project health dashboard - though honestly most PMs I know are terrible at actually using it consistently. The variance analysis pinpoints exactly where you're hemorrhaging time or cash. Monthly reviews are clutch, but focus on trends rather than just current snapshots. You'll catch problems while you can still fix them instead of explaining disasters later.
Most people go with Microsoft Project or Primavera P6 for the basic earned value stuff. P6's honestly way too much unless you're running massive projects - total overkill for most situations. Cobra's great for the advanced analysis and those S-curve reports management always wants to see, but man is it expensive. Deltek's another option in that space. Some teams just use Excel with custom templates which feels janky but actually works fine for smaller projects. I'd honestly just test out whatever project management software you're already using first - see if their EVM features do what you need before dropping cash on specialized tools.
So when scope changes mess with your project, EVM helps you see what's actually happening. Your Planned Value shifts when you update the baseline - totally normal, happens all the time. Compare your CPI and SPI before and after the change though. Big CPI drop? That scope change is killing your efficiency. Also watch your EAC since scope creep usually means you're going over budget (ugh). Here's what I learned the hard way: document those metrics BEFORE you approve changes. Otherwise you can't prove to stakeholders what each change actually costs you. Trust me on this one.
Here's the thing - traditional project tracking looks at cost, schedule, and scope like they're totally separate animals. EVM smashes them together into one system. Super helpful when you think you're doing fine budget-wise but you're actually way behind and cutting corners on deliverables. With EVM, you get metrics like CPI and SPI that show if you've truly "earned" value from what you've spent. Traditional methods? They'll just tell you "hey, 50% of budget's gone!" Without context, that's pretty useless honestly. Try EVM on your next project - beats getting blindsided later.
Honestly, just drill the basics first - PV, EV, AC and those core formulas. The math always confuses people at the start, but it'll click pretty quick. Get them practicing with actual project examples instead of boring theory stuff. Oh, and definitely pair your newbies with someone who's done this before. That mentoring thing really works. Make sure they understand what the numbers actually mean though, not just how to crunch them. I'd probably test it on a smaller project first before going all-in company-wide. Builds confidence that way.
First thing - nail down your work breakdown structure because fixing it later is a nightmare. Your performance measurement baseline needs to be realistic, not some fantasy timeline. Train everyone on the three metrics (BCWS, BCWP, ACWP) upfront or you'll get terrible data. Monthly reporting usually works well, though honestly adjust based on your project length. Oh and definitely start simple - don't go crazy with complexity right away. People need time to get used to the whole process before you pile on more features.
-
Love how there are no boring templates here! The design is fresh and creative, just the way I like it. Can't wait to edit and use them for my extended projects!
-
I am so thankful for all of the templates I've found on your site. They have saved me hours every week and helped make my presentations come alive. Keep up with these amazing product releases!