Effective Benchmarking Process For Marketing Project Management CRP CD
Check out our professionally designed Effective benchmarking process for marketing project management PowerPoint presentation. This Performance benchmarking PPT provides a comprehensive overview of the companys significant sales and marketing challenges, with project benchmarking as a solution to overcome these barriers. Moreover, the Project management presentation provides information regarding the fundamentals of project benchmarking, its importance, and the key approaches used. Also, the Marketing project PowerPoint includes benchmarking process implementation, which provides for establishing objectives, collecting and analyzing data, comparing results with competitors and past standards, developing improvement plans, defining marketing strategies, and monitoring Performance. Lastly, the Competitor Benchmarking Template showcases activities for successfully implementing and managing the project benchmarking process with its impact on overall sales and marketing performance. Get access to this powerful template now.
You must be logged in to download this presentation.
 Impress your
 audience
Editable
of Time
PowerPoint presentation slides
Deliver this complete deck to your team members and other collaborators. Encompassed with stylized slides presenting various concepts, this Effective Benchmarking Process For Marketing Project Management CRP CD is the best tool you can utilize. Personalize its content and graphics to make it unique and thought-provoking. All the seventy three slides are editable and modifiable, so feel free to adjust them to your business setting. The font, color, and other components also come in an editable format making this PPT design the best choice for your next presentation. So, download now.
People who downloaded this PowerPoint presentation also viewed the following :
Content of this Powerpoint Presentation
Slide 1: The slide introduces Effective Benchmarking Process for Marketing Project Management. State Your Company Name.
Slide 2: This is an Agenda slide. State your agendas here.
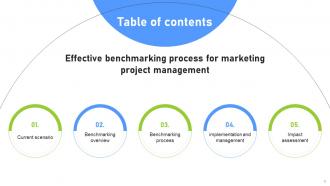
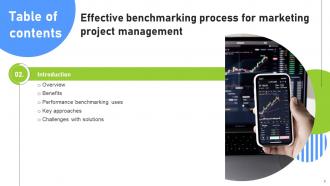
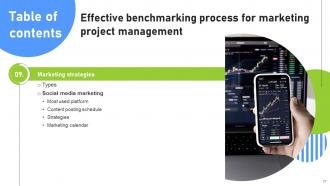
Slide 3: The slide displays Table of contents for the presentation.
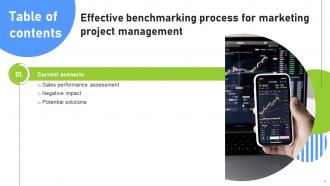
Slide 4: The slide continues Table of contents.
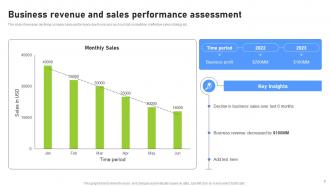
Slide 5: This slide showcases declining company sales performance.
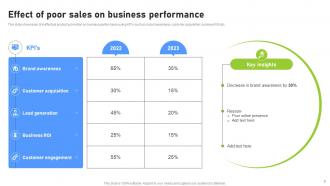
Slide 6: This slide describes ineffectual product promotion on business performance using KPI’s.
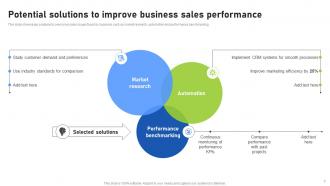
Slide 7: This slide showcases solutions to overcome sales issues faced by business.
Slide 8: The slide renders Title of contents further.
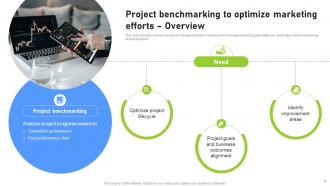
Slide 9: This slide provides overview of project management benchmarking which includes optimizing project lifecycle, goals alignment and analyzing project progress.
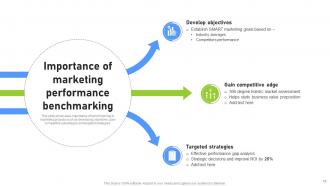
Slide 10: This slide showcases importance of benchmarking in marketing projects such as developing objectives, gain competitive advantages and targeted strategies.
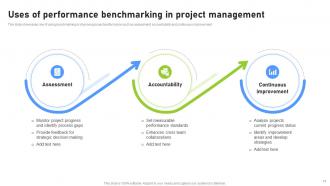
Slide 11: This slide highlights role of using benchmarking in improving project performance such as assessment, accountability and continuous improvement.
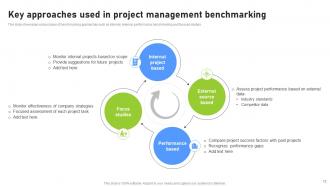
Slide 12: This slide shows various types of benchmarking approaches such as internal, external, performance benchmarking and focused studies.
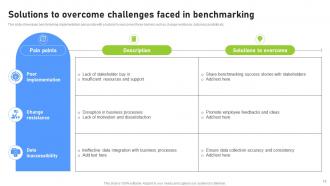
Slide 13: This slide renders benchmarking implementation pain points with solutions to overcomes these barriers.
Slide 14: The slide continues Title of contents further.
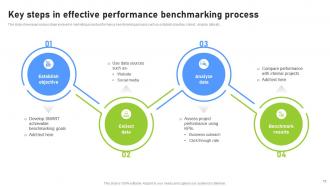
Slide 15: This slide renders various steps involved in marketing project performance benchmarking process.
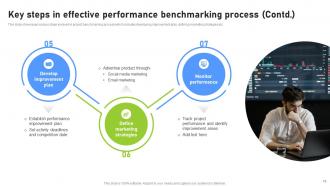
Slide 16: This slide displays various steps involved in project benchmarking process which includes developing improvement plan, defining marketing strategies etc.
Slide 17: The slide depicts Title of contents which is to be discussed further.
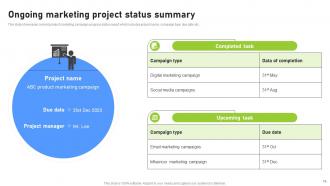
Slide 18: This slide showcases current product marketing campaign progress status report which includes project name, campaign type, due date etc.
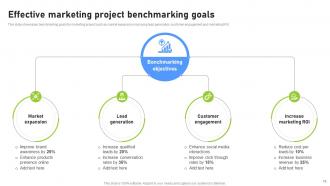
Slide 19: This slide shows benchmarking goals for marketing project such as market expansion, improving lead generation, customer engagement and marketing ROI.
Slide 20: The slide depicts Title of contents further.
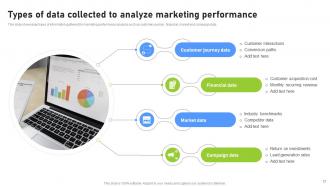
Slide 21: This slide represents types of information gathered for marketing performance analysis such as customer journey , financial, market and campaign data.
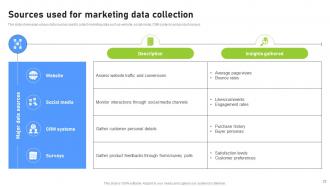
Slide 22: This slide highlights various data sources used to collect marketing data such as website, social media, CRM systems and product surveys.
Slide 23: The slide depicts Title of contents further.
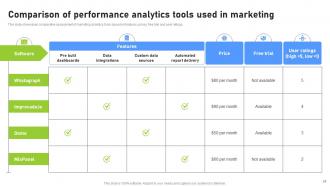
Slide 24: This slide showcases comparative assessment of marketing analytics tools based on features, prices, free trail and user ratings.
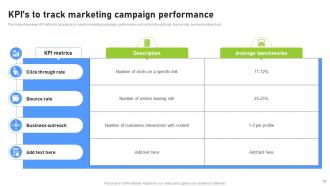
Slide 25: This slide renders JPI metrics to be analyze to monitor marketing campaign performance such as click through rate, bounce rate, business outreach etc.
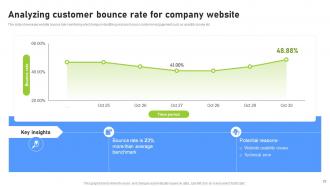
Slide 26: This slide showcases website bounce rate monitoring which helps in identifying reasons for poor customer engagement such as usability issues etc.
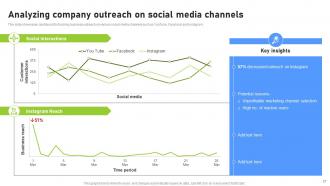
Slide 27: This slide renders dashboard for tracking business outreach on various social media channels such as YouTube, Facebook and Instagram.
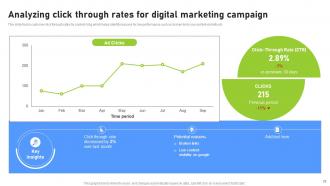
Slide 28: This slide tracks customer click through rates for content blog which helps identify reasons for low performance.
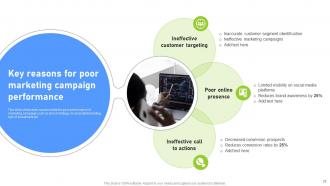
Slide 29: This slide showcases causes related to poor performance of marketing campaign such as lack of strategy, inconsistent branding, lack of investment etc.
Slide 30: The slide continues Title of contents further.
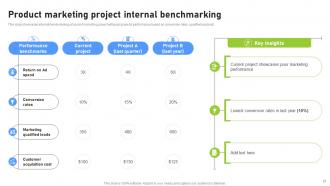
Slide 31: This slide showcases internal benchmarking of current marketing project with past projects performance based on conversion rates, qualified leads etc.
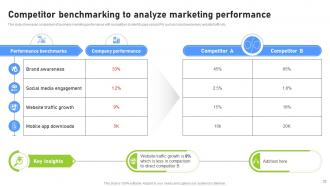
Slide 32: This slide highlights comparison of business marketing performance with competitors to identify gaps using KPIs.
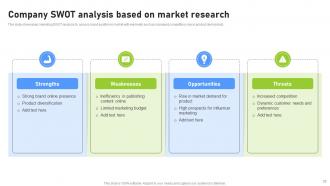
Slide 33: This slide displays marketing SWOT analysis to assess brand position in market with elements such as increased competition, rise in product demand etc.
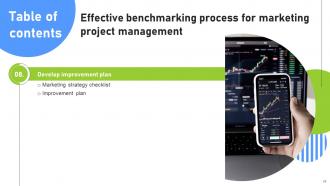
Slide 34: The slide represents Title of contents further.
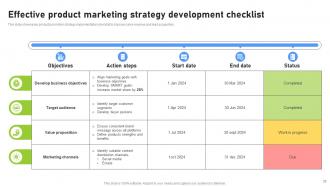
Slide 35: This slide shows product promotion strategy implementation checklist to improve sales revenue and lead acquisition.
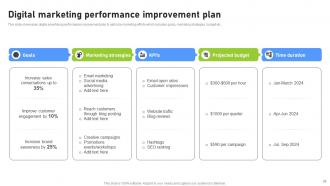
Slide 36: This slide renders digital advertising performance improvement plan to optimize marketing efforts which includes goals, marketing strategies, budget etc.
Slide 37: The slide presents Title of contents which is to be discussed further.
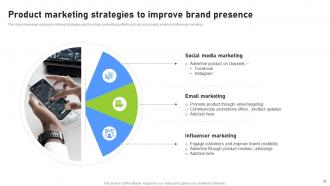
Slide 38: This slide showcases various promotional strategies used to enhance advertising efforts such as social media, email and influencer marketing.
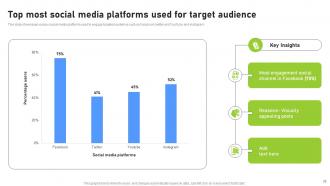
Slide 39: This slide highlights various social media platforms used to engage targeted audience such as Facebook, twitter and YouTube and Instagram.
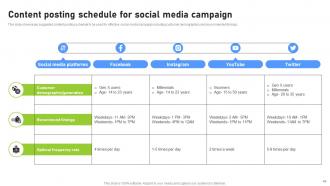
Slide 40: This slide renders suggested content posting schedule to be used for effective social media campaign including customer demographics and recommended timings.
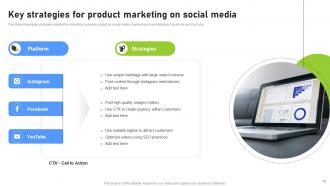
Slide 41: This slide showcases strategies adopted for marketing business product on social media channels such as Instagram, Facebook and YouTube.
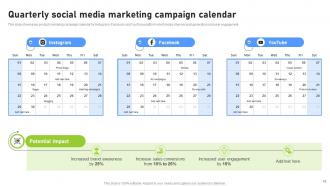
Slide 42: This slide renders product marketing campaign calendar for Instagram, Facebook and YouTube platform which helps improve lead generation and user engagement.
Slide 43: The slide represents Title of contents further.
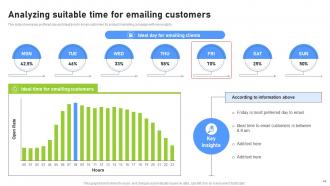
Slide 44: This slide showcases proffered day and ideal time to email customers for product marketing campaign with key insights.
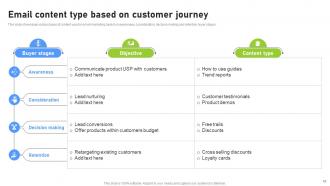
Slide 45: This slide renders various types of content used in email marketing based on awareness, consideration, decision making and retention buyer stages.
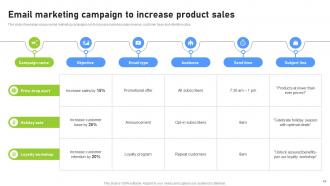
Slide 46: This slide highlights various email marketing campaigns run to increase business sales revenue, customer base and retention rates.
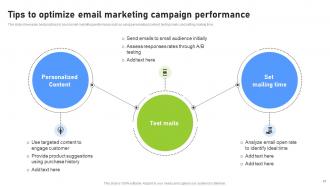
Slide 47: This slide shows best practices to boost email marketing performance such as using personalized content, testing mails, and setting mailing time.
Slide 48: The slide describes Title of contents further.
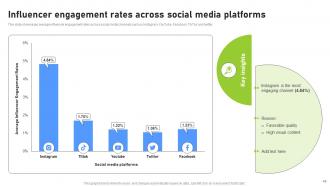
Slide 49: This slide showcases average influencer engagement rates across social media channels such as Instagram, YouTube, Facebook, TikTok and twitter.
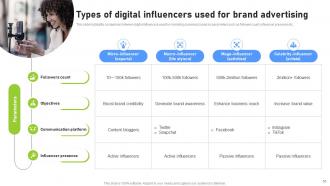
Slide 50: This slide highlights comparison between digital influencers used for marketing business based on parameters.
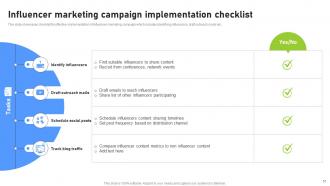
Slide 51: This slide showcases checklist for effective implementation of influencer marketing campaign.
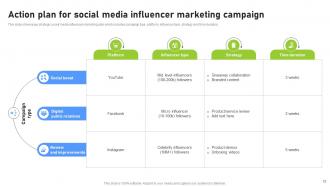
Slide 52: This slide renders strategic social media influencer marketing plan which includes campaign type, platform, influencer type, strategy and time duration.
Slide 53: The slide depicts Title of contents further.
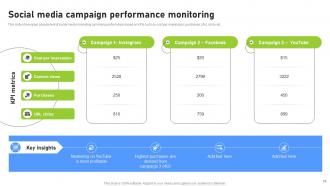
Slide 54: This slide showcases assessment of social media marketing cameoing performance based on KPIs such as cost per impression, purchases, URL clicks etc.
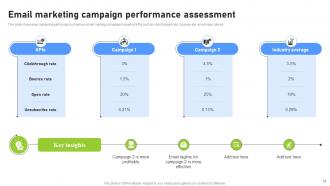
Slide 55: This slide shows measuring performance of various email marking campaigns based on KPIs such as click through rate, bounce rate, email open rate etc.
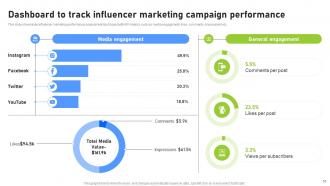
Slide 56: This slide highlights influencer marketing performance assessment dashboard with KPI metrics such as media engagement, likes, comments, impressions etc.
Slide 57: The slide represents Title of contents which is to be discussed further.
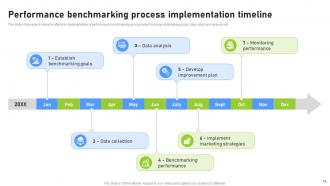
Slide 58: This slide shows timeline for effective implementation of performance benchmarking process which includes establishing goals, data collect and analysis etc.
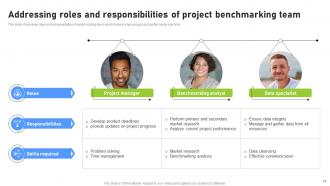
Slide 59: This slide renders roles and responsibilities of benchmarking team which helps in improving project performance over time.
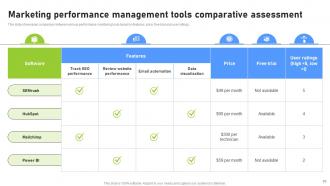
Slide 60: This slide showcases comparison between various performance monitoring tools based on features, price, free trial and user ratings.
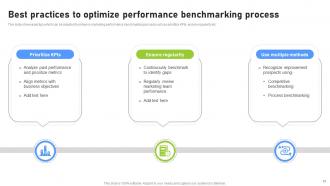
Slide 61: This slide displays tips which can be adopted to enhance marketing performance benchmarking process such as prioritize KPIs, ensure regularity etc.
Slide 62: The slide renders Title of contents further.
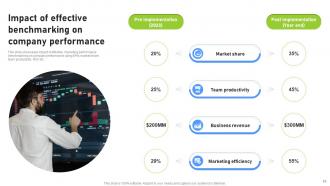
Slide 63: This slide showcases impact of effective marketing performance benchmarking on company performance using KPIs market share, team productivity, ROI etc.
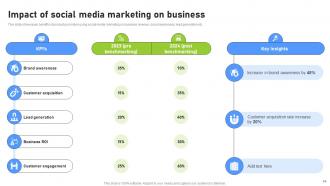
Slide 64: This slide highlights benefits of product promotion using social media marketing on business revenue, brand awareness, lead generation etc.
Slide 65: This slide shows all the icons included in the presentation.
Slide 66: This slide is titled as Additional Slides for moving forward.
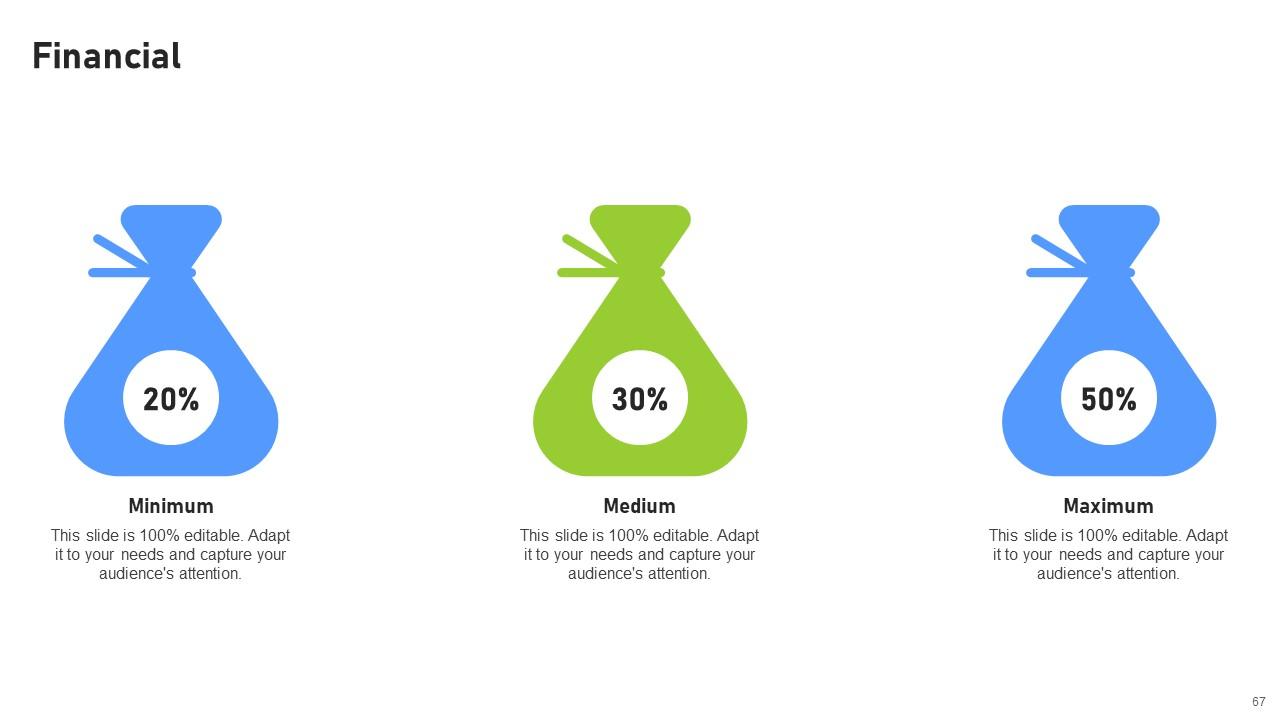
Slide 67: This is a Financial slide. Show your finance related stuff here.
Slide 68: This slide provides 30 60 90 Days Plan with text boxes.
Slide 69: This is a Quotes slide to convey message, beliefs etc.
Slide 70: This slide contains Puzzle with related icons and text.
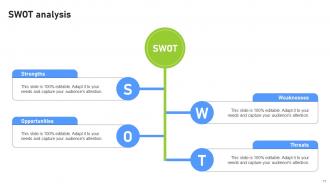
Slide 71: This slide shows SWOT describing- Strength, Weakness, Opportunity, and Threat.
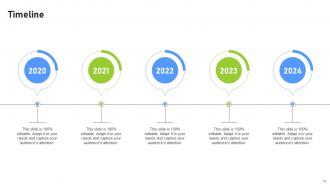
Slide 72: This is a Timeline slide. Show data related to time intervals here.
Slide 73: This is a Thank You slide with address, contact numbers and email address.
Effective Benchmarking Process For Marketing Project Management CRP CD with all 82 slides:
Use our Effective Benchmarking Process For Marketing Project Management CRP CD to effectively help you save your valuable time. They are readymade to fit into any presentation structure.
-
“Easy to use. I always wanted to have a quick search for products and SlideTeam has helped me have it.”
-
I am not the best at presentations but using SlideTeam’s PPT template made it easier for me. Thank you SlideTeam!


