Enhancing Decision Making Through Portfolio Analysis Fin CD
Embark on a transformative journey towards smarter decision-making with our meticulously crafted presentation deck, Enhancing Decision-Making Through Portfolio Analysis. In todays dynamic landscape, understanding the broader needs for portfolio analysis is crucial. Our presentation sheds light on the quantitative impact of relying solely on intuition-based decisions, revealing the pitfalls and risks involved. Dive deep into portfolio analysis, uncover its benefits, and learn how to conduct an insightful analysis. Explore various types and features, from portfolio positioning to style box and portfolio characteristics. Through comprehensive insights on mean-variance optimization, attribution analysis, benchmarking, performance analysis, risk analysis, stress testing, and portfolio optimization, this deck guides you to identify opportunities, evaluate risk exposure, and enhance accountability. Experience the impact of implementing portfolio analysis solutions, witnessed through real-world case studies. Witness the quantitative benefits of data-driven decisions, revolutionizing your decision-making ability. Do not miss the chance to elevate your strategies. Download our presentation deck now and revolutionize your decision-making paradigm.
Embark on a transformative journey towards smarter decision-making with our meticulously crafted presentation deck, Enhanci..
- Google Slides is a new FREE Presentation software from Google.
- All our content is 100% compatible with Google Slides.
- Just download our designs, and upload them to Google Slides and they will work automatically.
- Amaze your audience with SlideTeam and Google Slides.
-
Want Changes to This PPT Slide? Check out our Presentation Design Services
- WideScreen Aspect ratio is becoming a very popular format. When you download this product, the downloaded ZIP will contain this product in both standard and widescreen format.
-

- Some older products that we have may only be in standard format, but they can easily be converted to widescreen.
- To do this, please open the SlideTeam product in Powerpoint, and go to
- Design ( On the top bar) -> Page Setup -> and select "On-screen Show (16:9)” in the drop down for "Slides Sized for".
- The slide or theme will change to widescreen, and all graphics will adjust automatically. You can similarly convert our content to any other desired screen aspect ratio.
Compatible With Google Slides

Get This In WideScreen
You must be logged in to download this presentation.
PowerPoint presentation slides
Enthrall your audience with this Enhancing Decision Making Through Portfolio Analysis Fin CD. Increase your presentation threshold by deploying this well-crafted template. It acts as a great communication tool due to its well-researched content. It also contains stylized icons, graphics, visuals etc, which make it an immediate attention-grabber. Comprising seventy one slides, this complete deck is all you need to get noticed. All the slides and their content can be altered to suit your unique business setting. Not only that, other components and graphics can also be modified to add personal touches to this prefabricated set.
People who downloaded this PowerPoint presentation also viewed the following :
Content of this Powerpoint Presentation
Slide 1: This slide showcase title Enhancing Decision-Making Through Portfolio Analysis. State Your Company Name
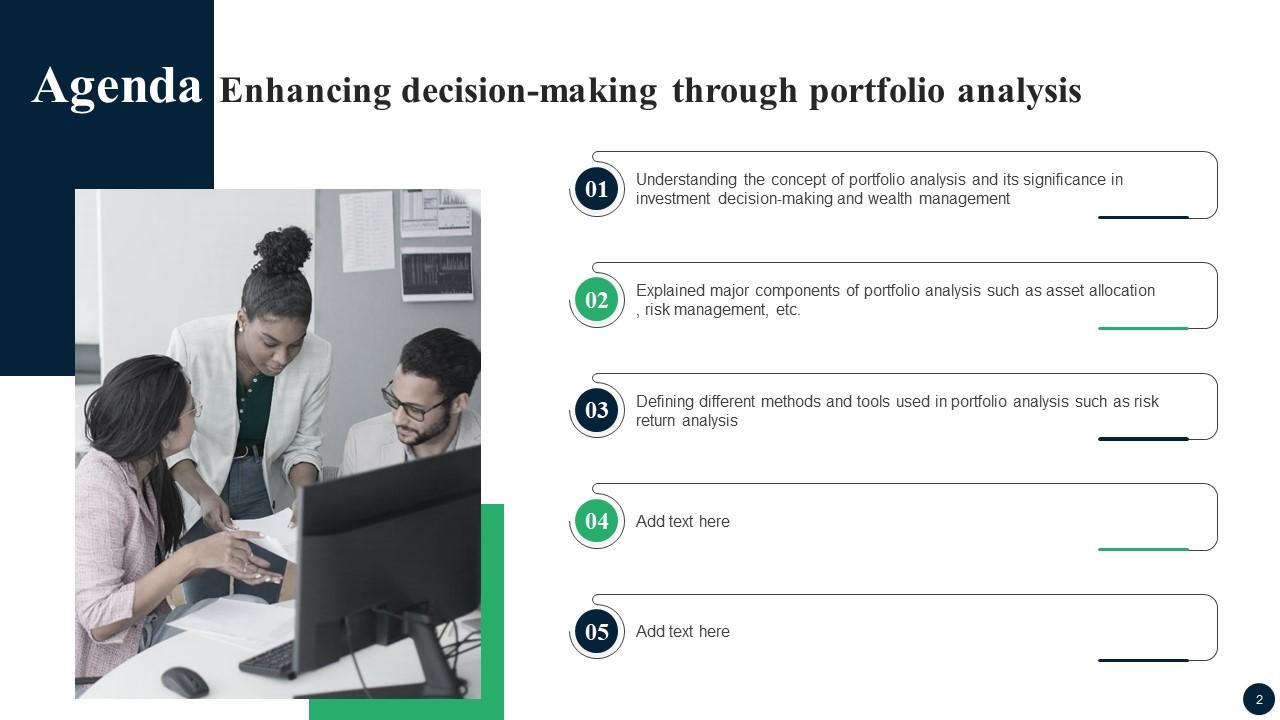
Slide 2: This slide showcase title Agenda Enhancing decision-making through portfolio analysis.
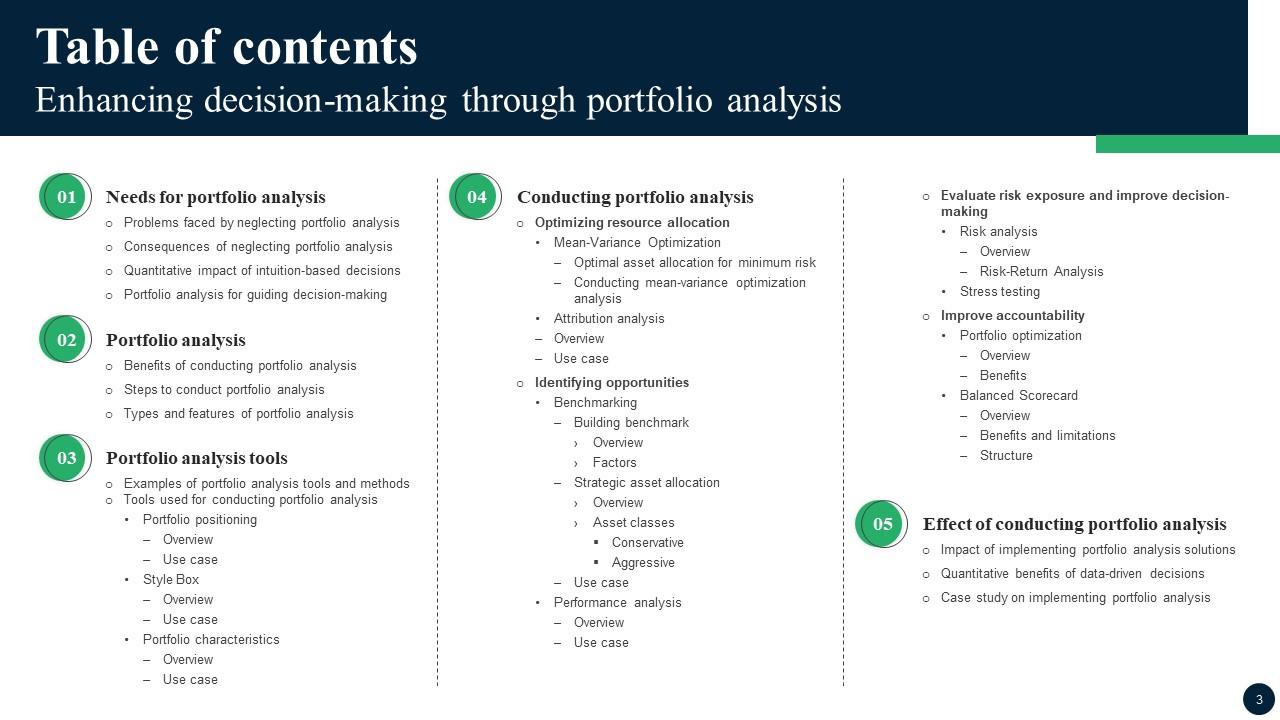
Slide 3: This slide exhibit Table of Content.
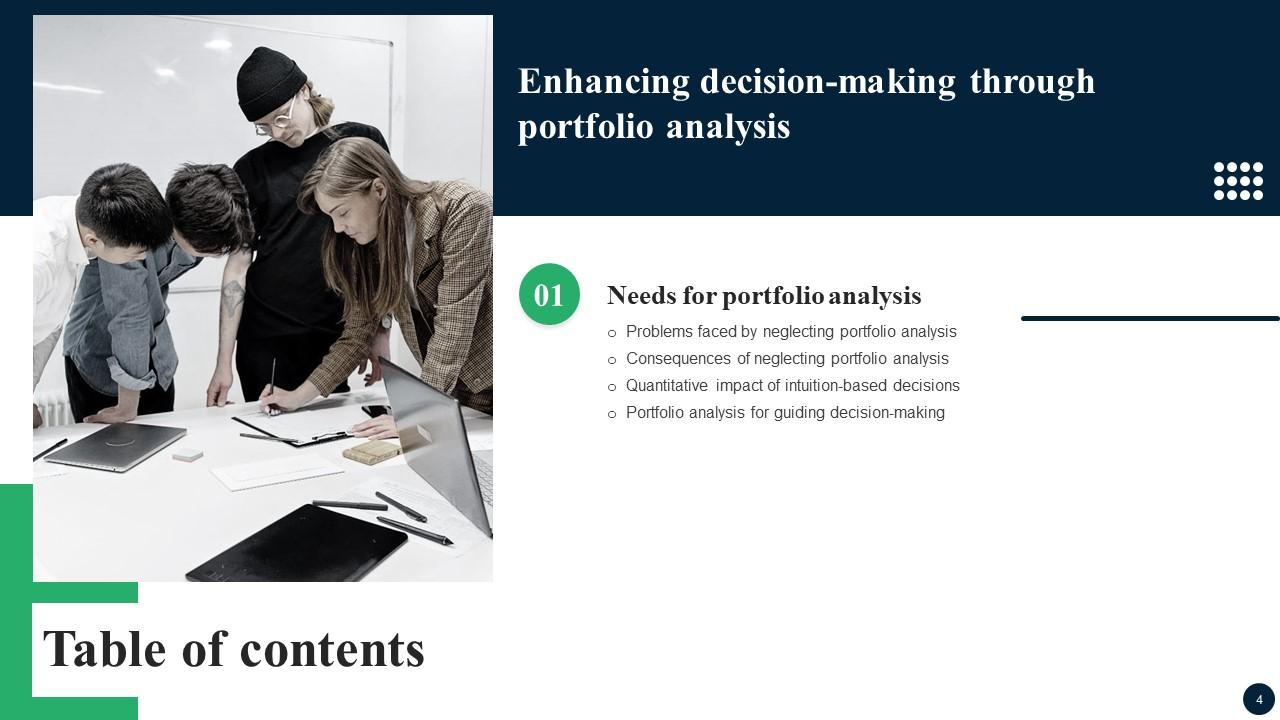
Slide 4: This slide exhibit Table of Content: Needs for portfolio analysis.
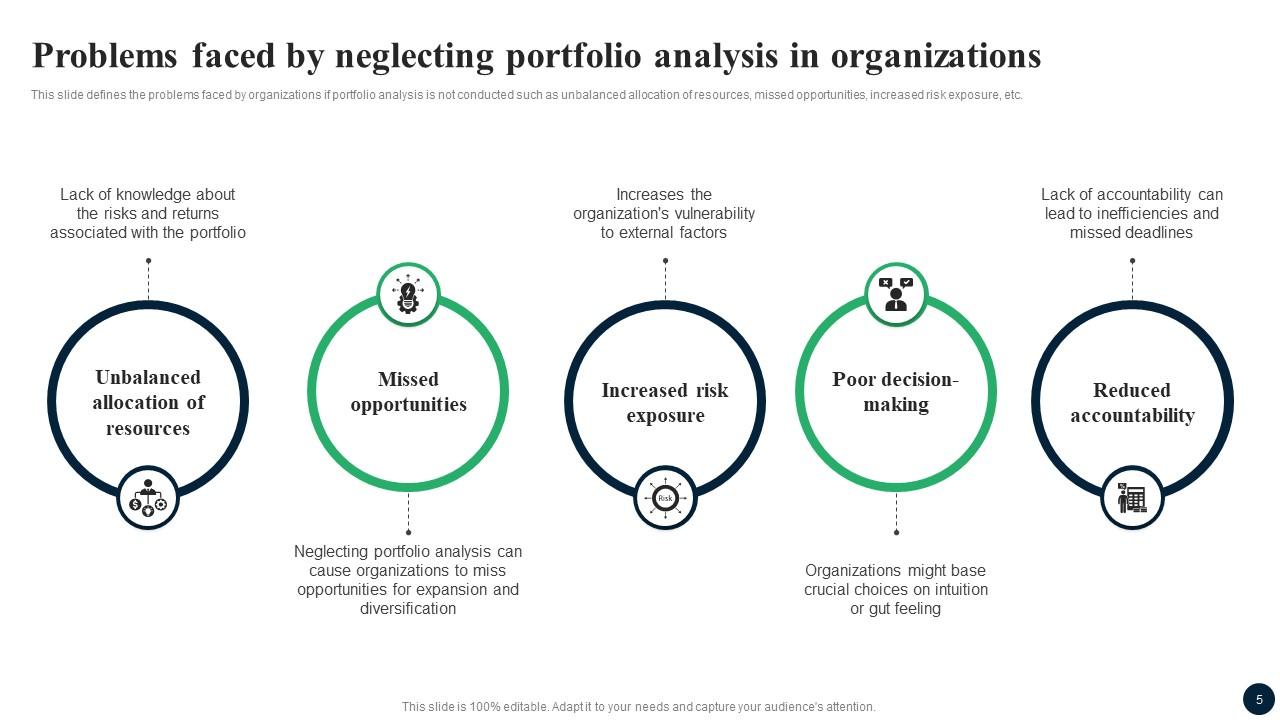
Slide 5: This slide defines the problems faced by organizations if portfolio analysis is not conducted.
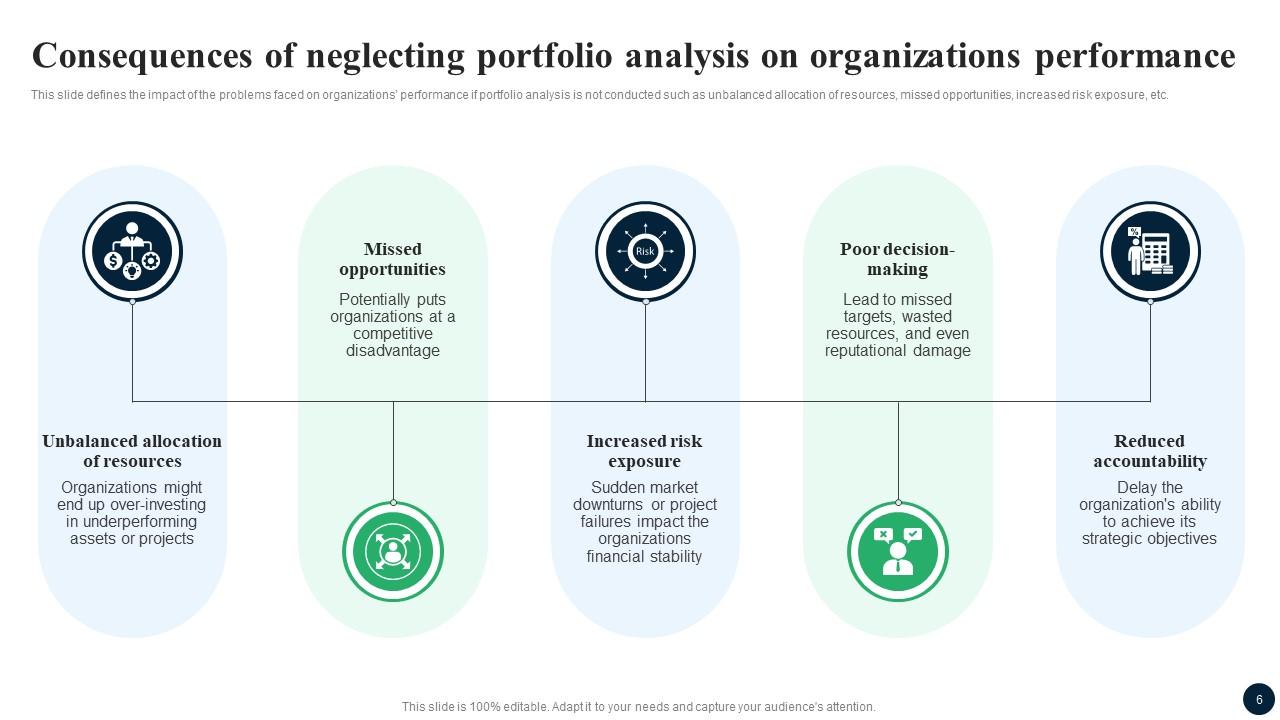
Slide 6: This slide defines the impact of the problems faced on organizations’ performance if portfolio analysis is not conducted.
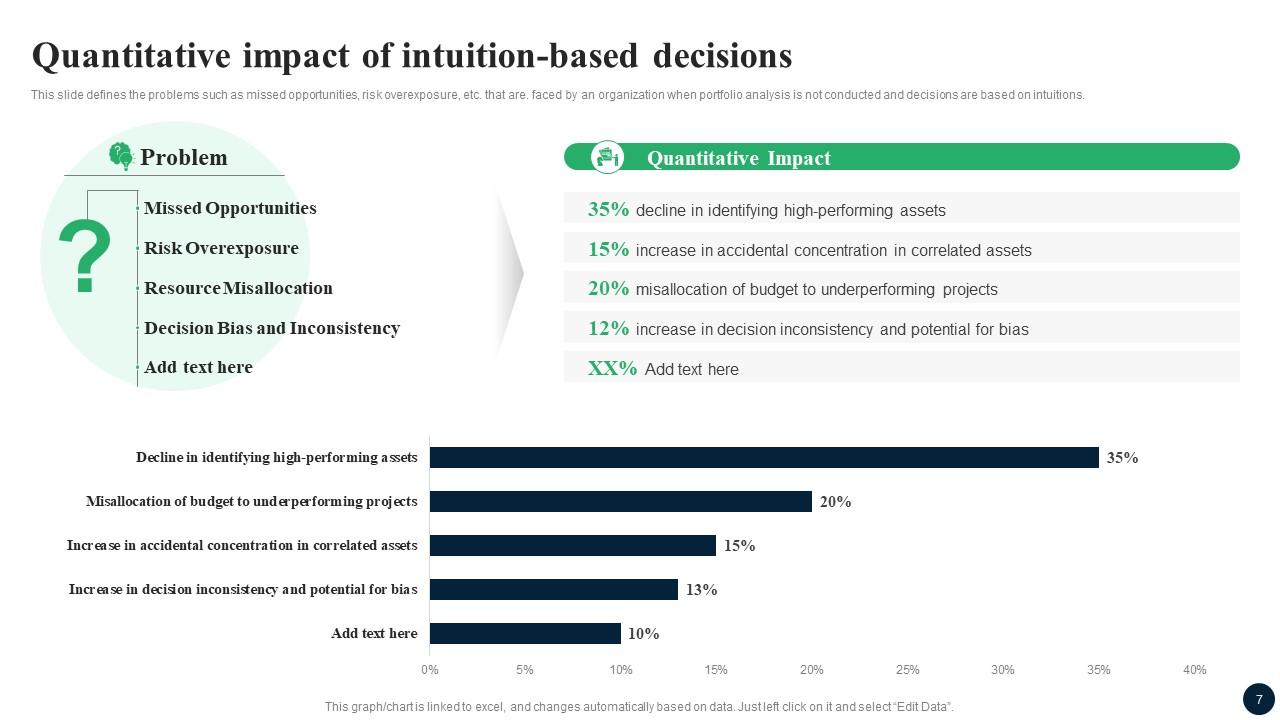
Slide 7: This slide defines the problems such as missed opportunities, risk overexposure, etc. that are. faced by an organization when portfolio analysis is not conducted.
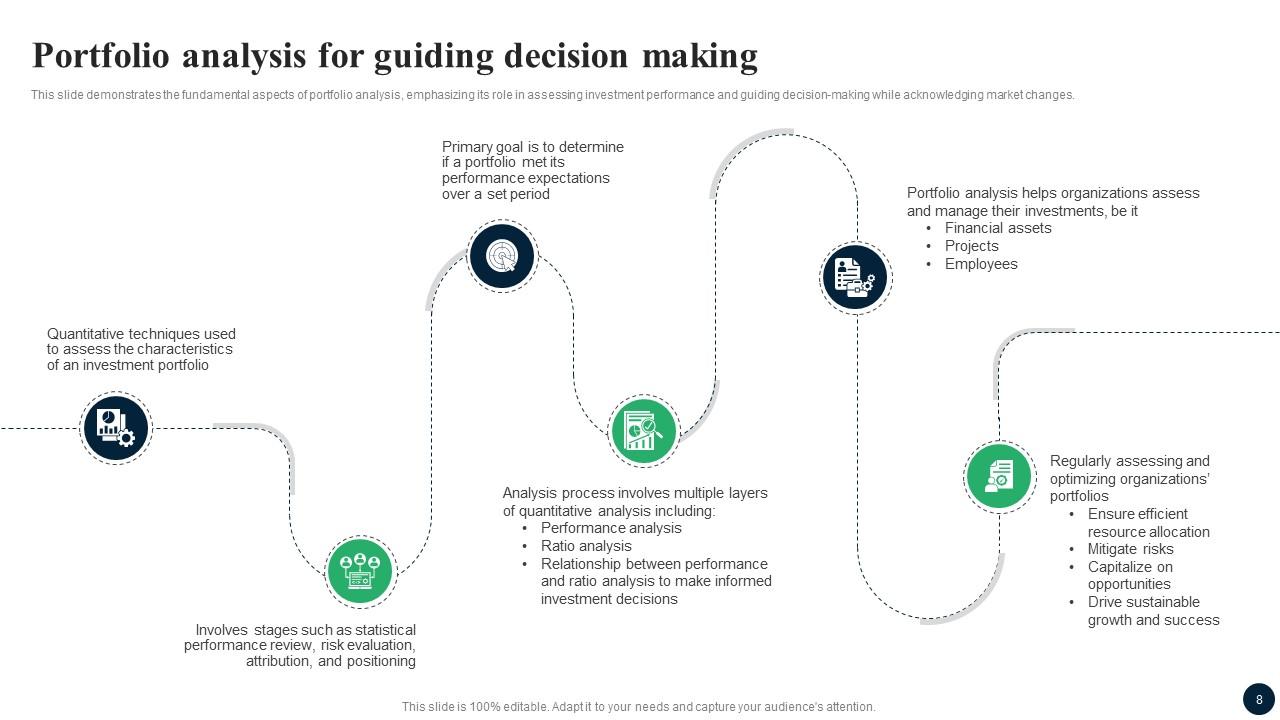
Slide 8: This slide demonstrates the fundamental aspects of portfolio analysis, emphasizing its role in assessing investment performance.
Slide 9: This slide exhibit Table of Content: Portfolio analysis.
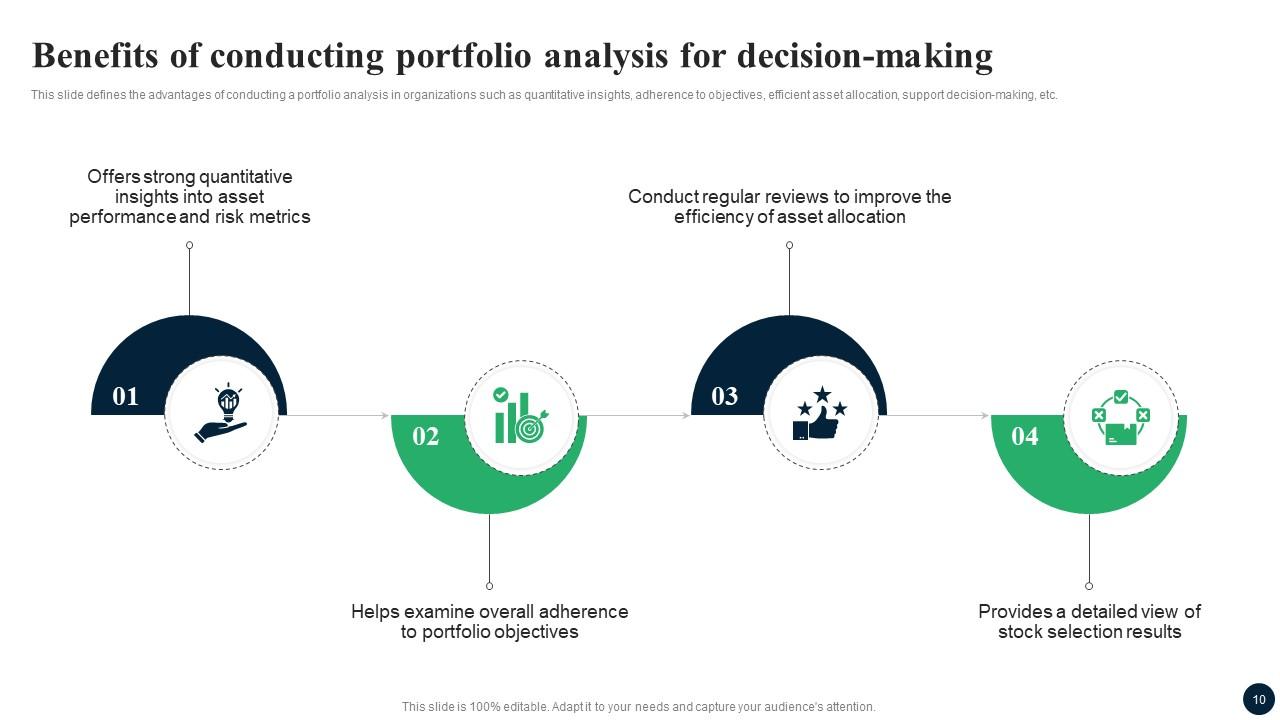
Slide 10: This slide defines the advantages of conducting a portfolio analysis in organizations.
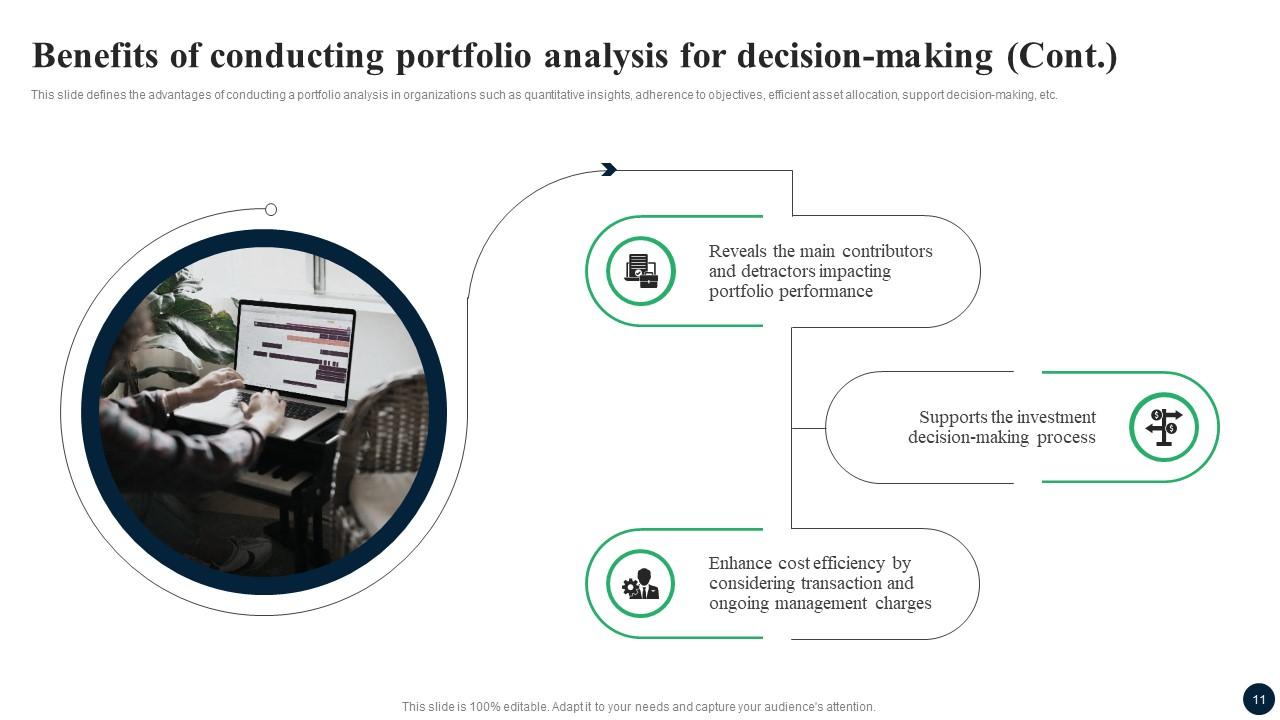
Slide 11: This slide defines the advantages of conducting a portfolio analysis in organizations.
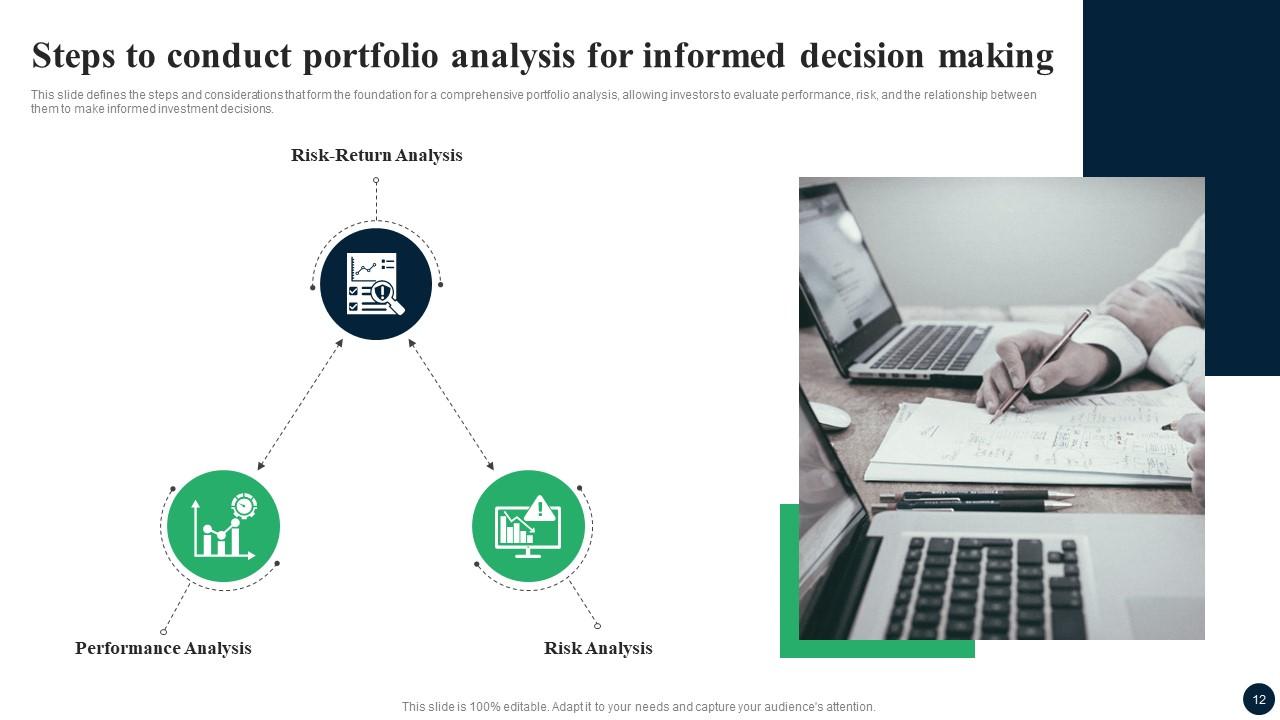
Slide 12: This slide defines the steps and considerations that form the foundation for a comprehensive portfolio analysis, allowing investors to evaluate performance.
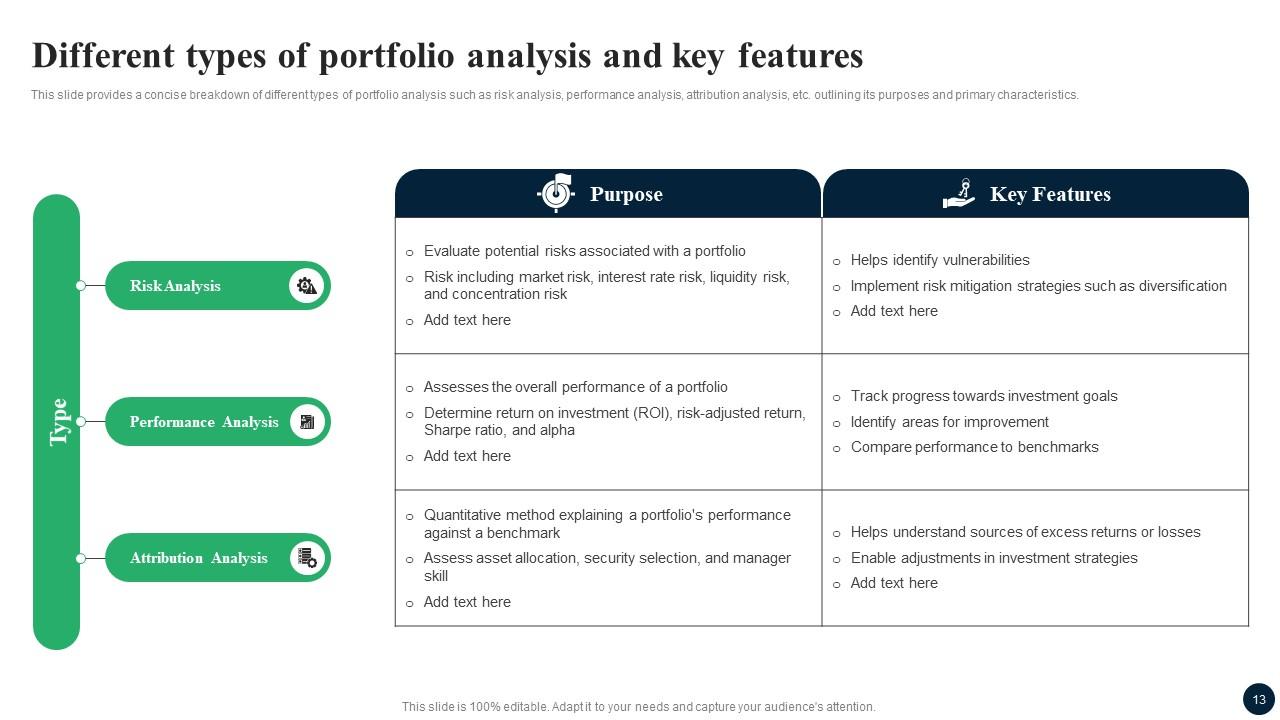
Slide 13: This slide provides a concise breakdown of different types of portfolio analysis such as risk analysis, performance analysis, attribution analysis, etc.
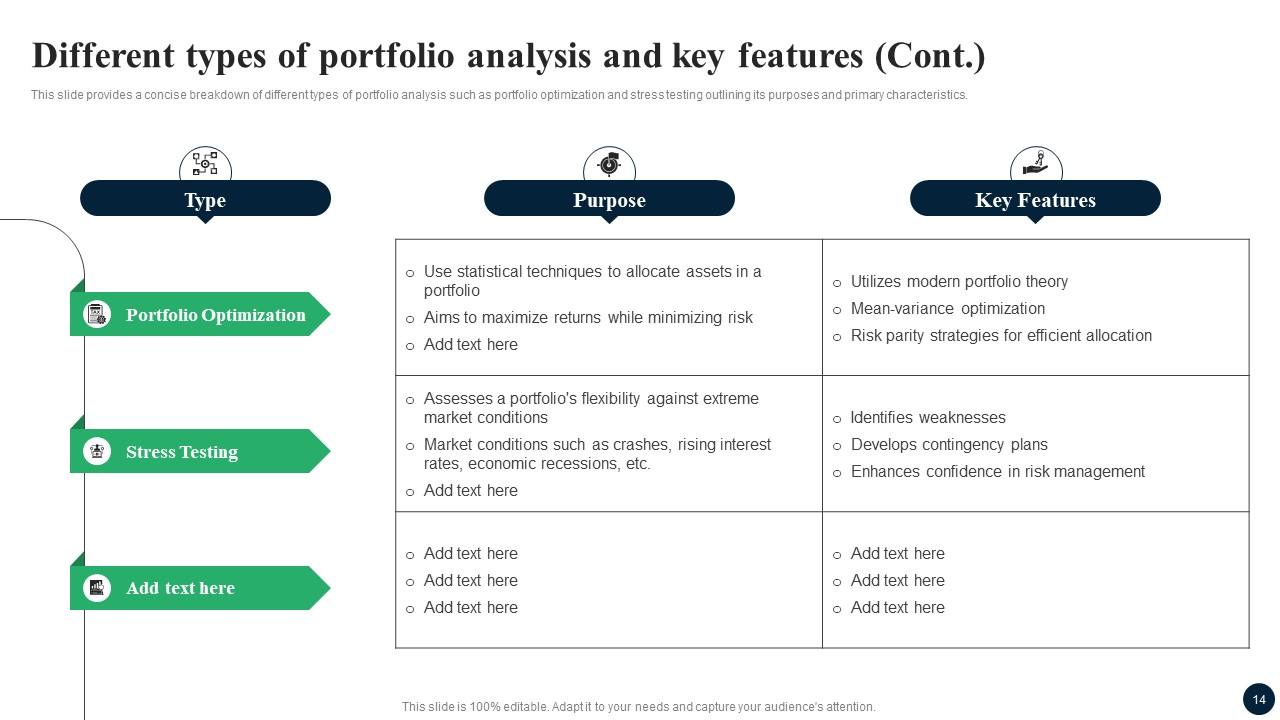
Slide 14: This slide provides a concise breakdown of different types of portfolio analysis.
Slide 15: This slide exhibit Table of Content: Portfolio analysis tools
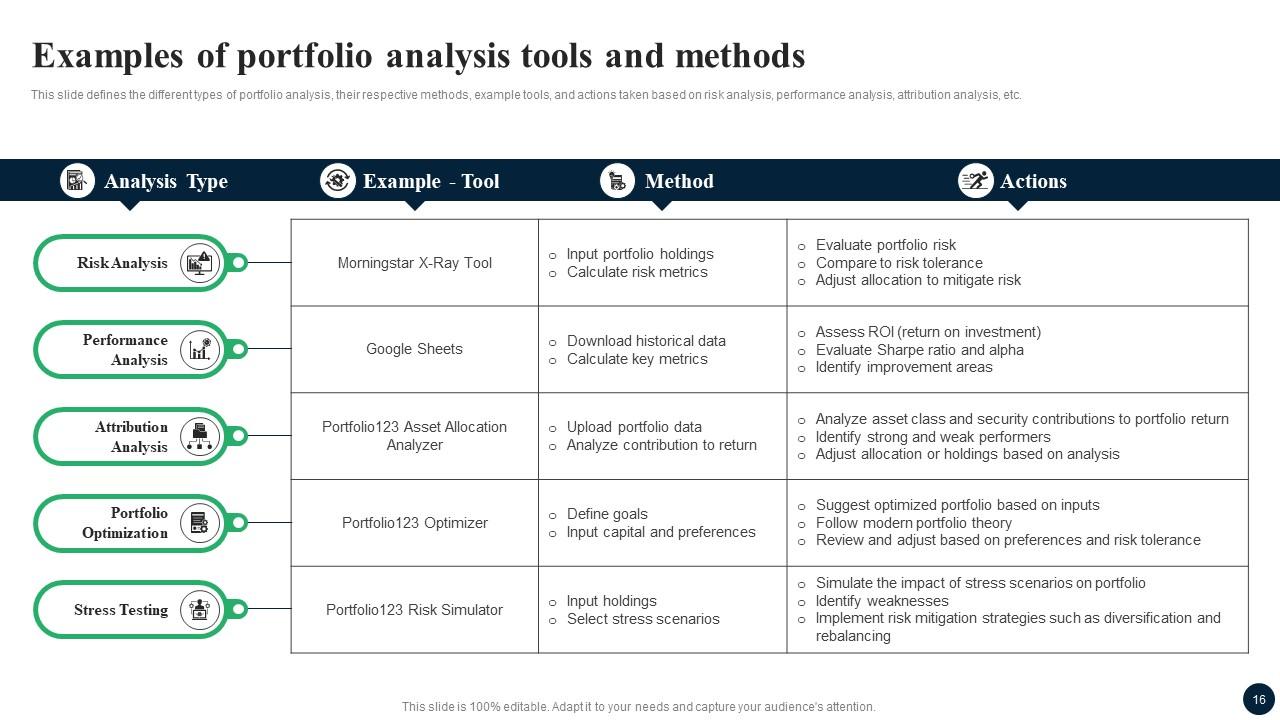
Slide 16: This slide defines the different types of portfolio analysis, their respective methods, example tools, and actions taken based on risk analysis.
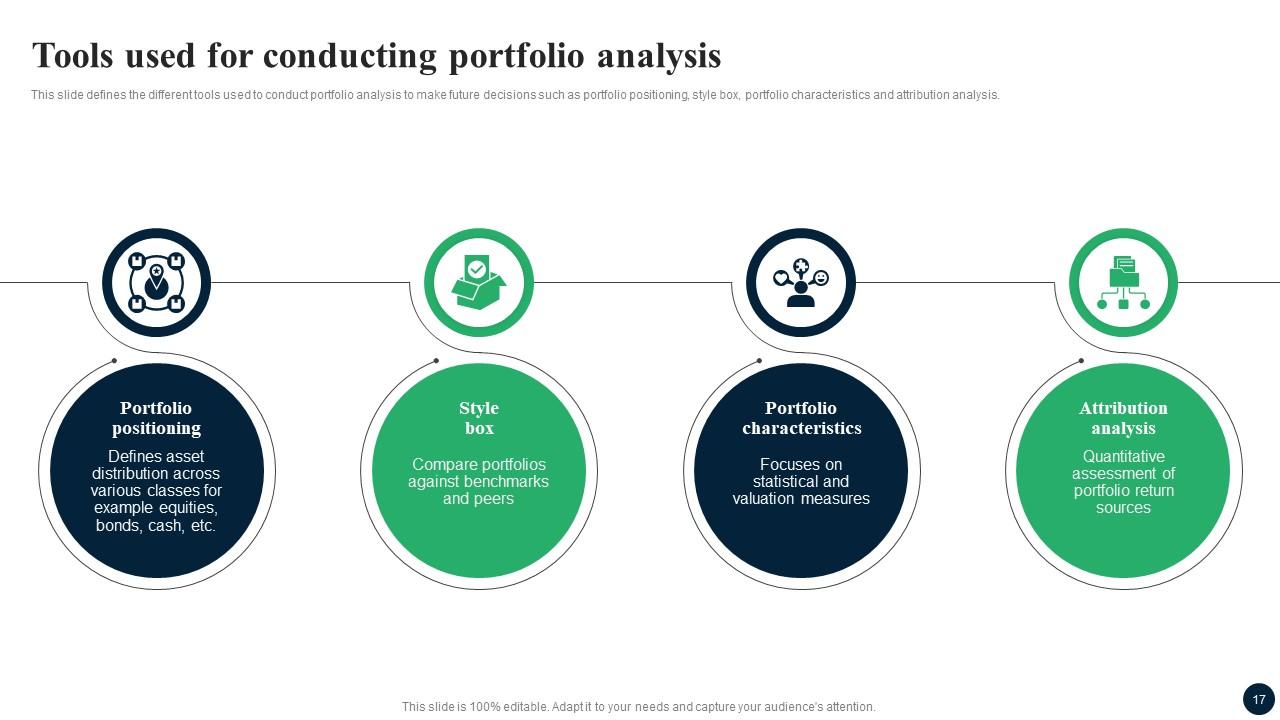
Slide 17: This slide defines the different tools used to conduct portfolio analysis to make future decisions.
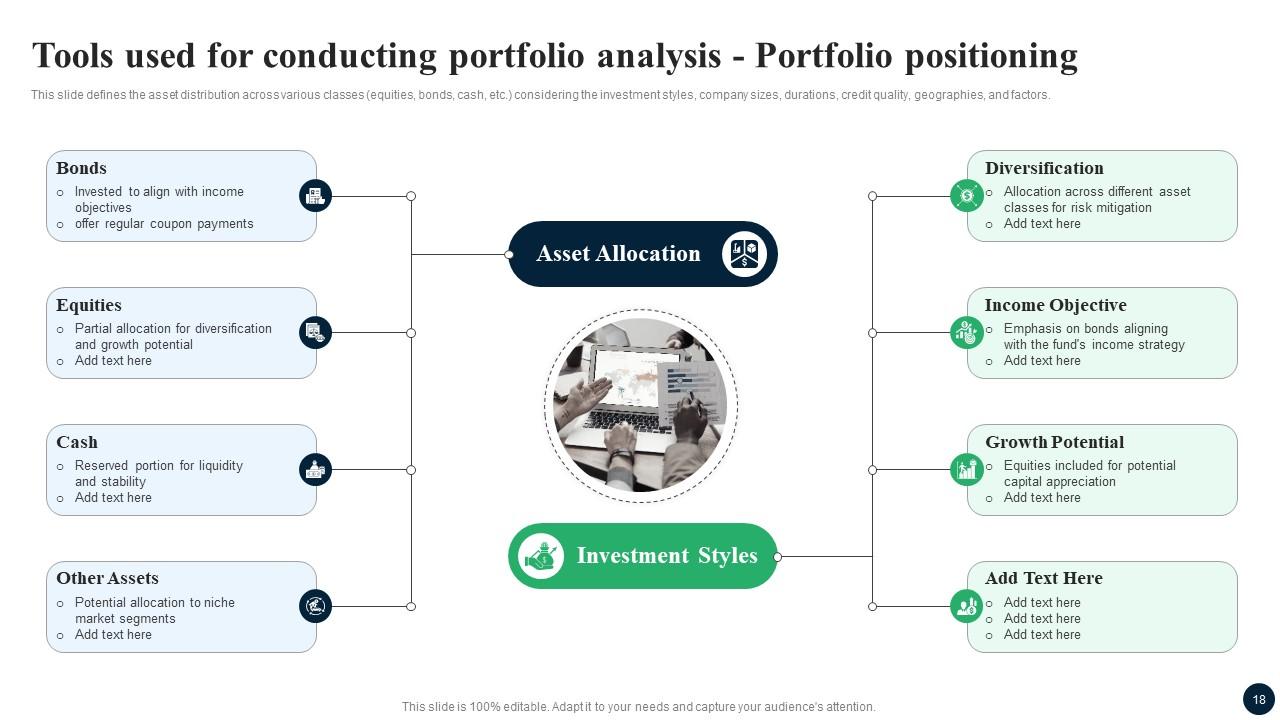
Slide 18: This slide defines the asset distribution across various classes (equities, bonds, cash, etc.) considering the investment styles, company sizes, durations.
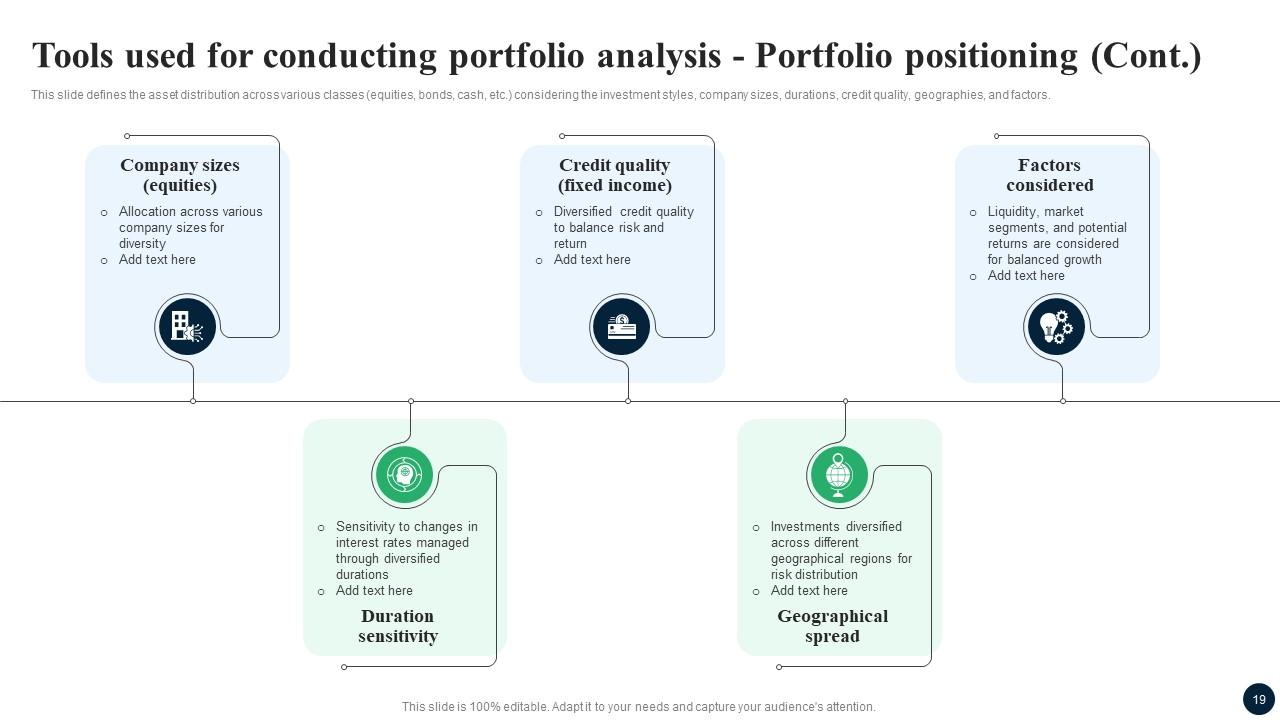
Slide 19: This slide also defines the asset distribution across various classes (equities, bonds, cash, etc.) considering the investment styles, company sizes.
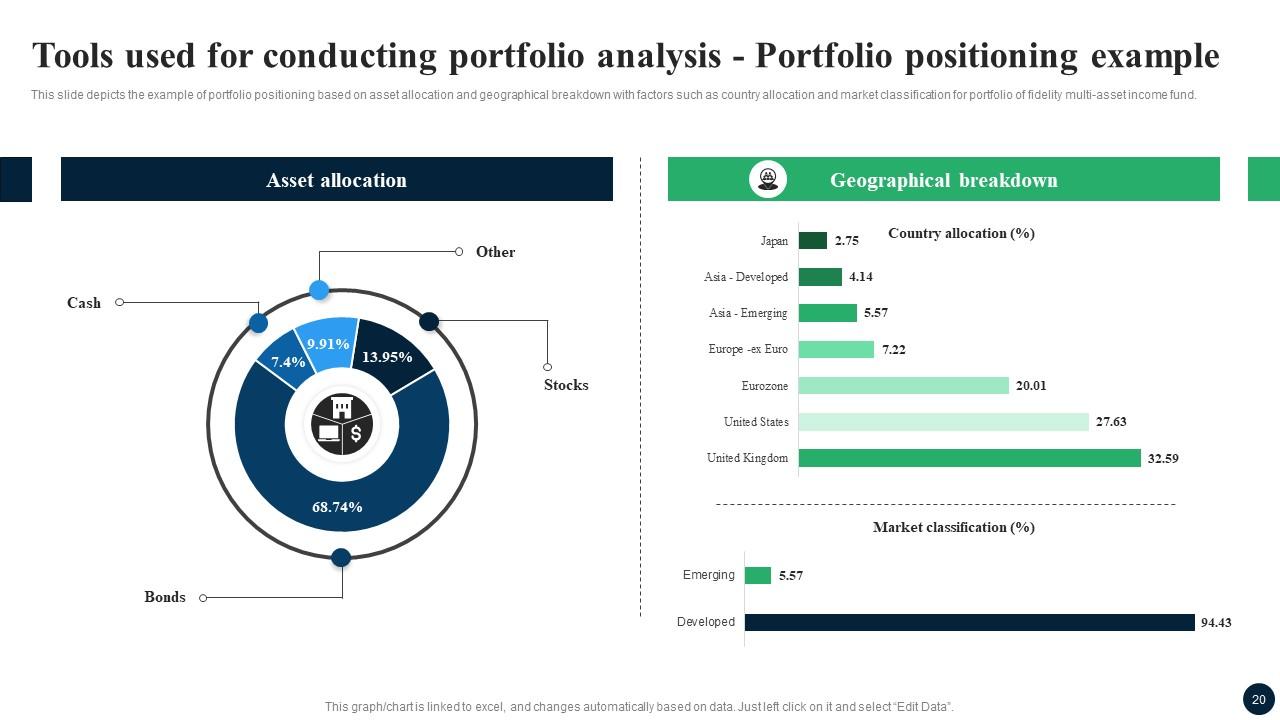
Slide 20: This slide depicts the example of portfolio positioning based on asset allocation and geographical breakdown with factors.
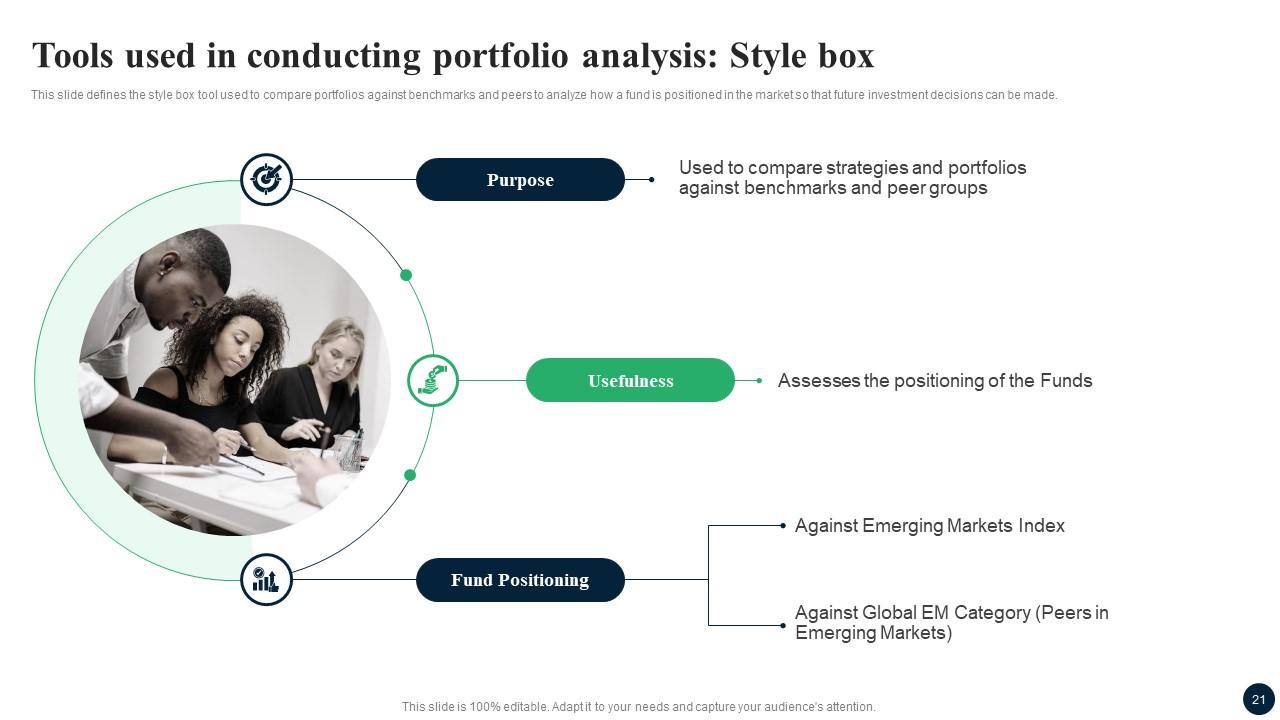
Slide 21: This slide defines the style box tool used to compare portfolios against benchmarks and peers to analyze how a fund is positioned in the market.
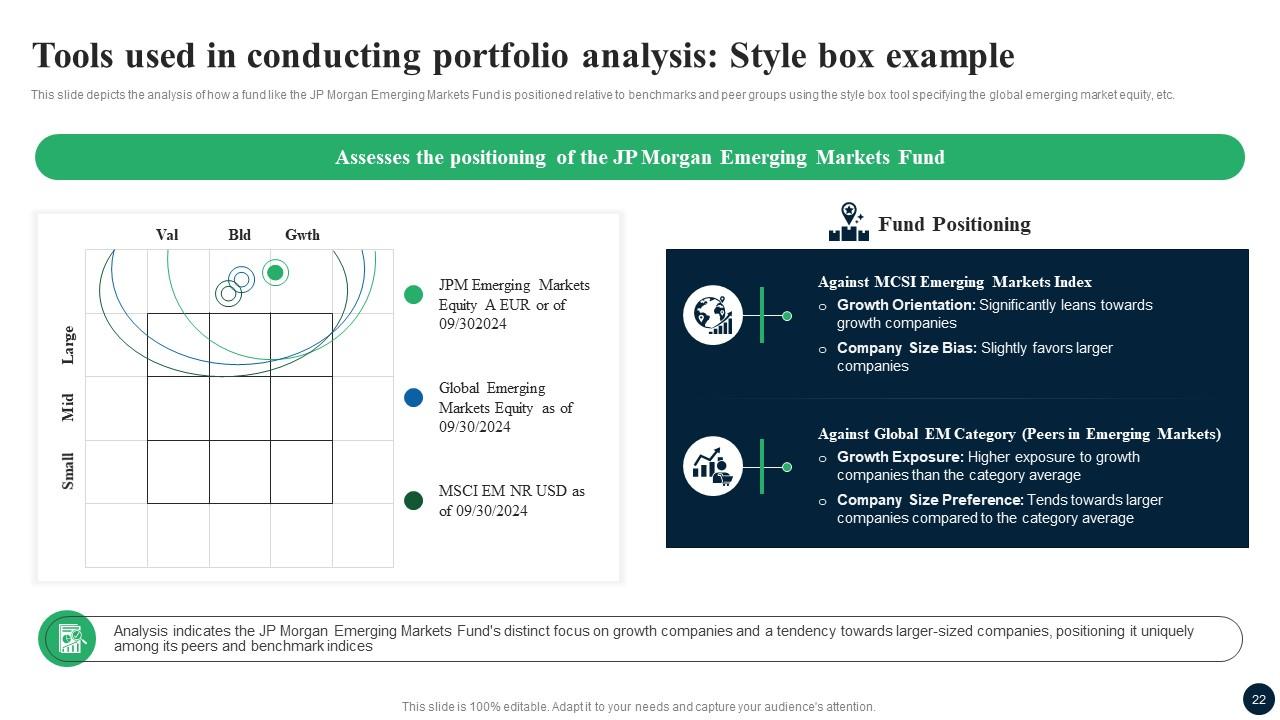
Slide 22: This slide depicts the analysis of how a fund like the JP Morgan Emerging Markets Fund is positioned relative to benchmarks and peer groups.
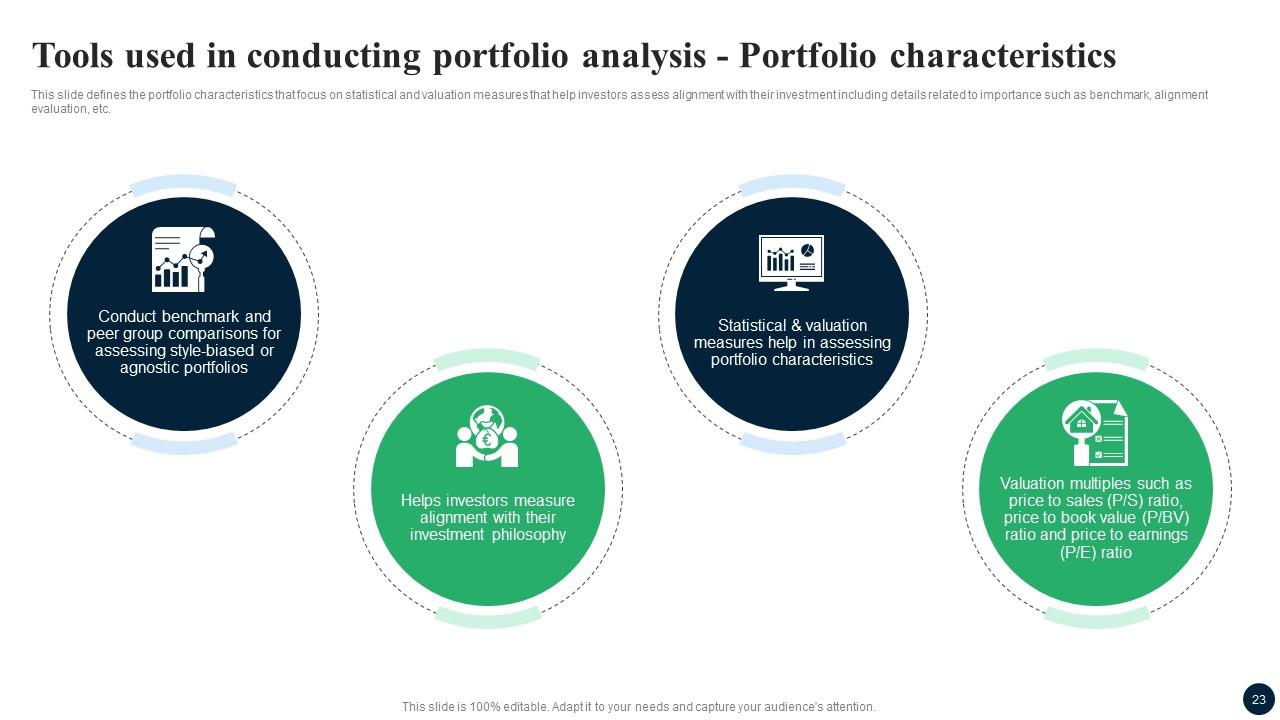
Slide 23: This slide defines the portfolio characteristics that focus on statistical and valuation measures that help investors assess alignment with their investment.
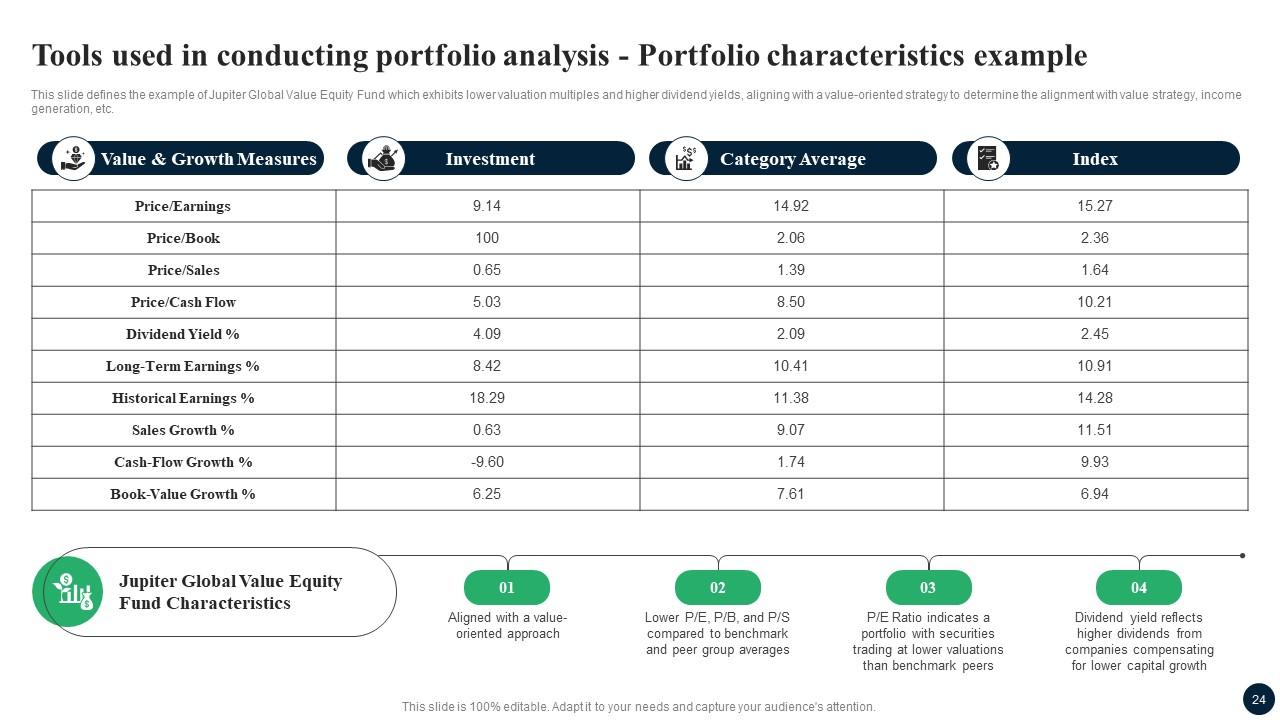
Slide 24: This slide defines the example of Jupiter Global Value Equity Fund which exhibits lower valuation multiples and higher dividend yields.
Slide 25: This slide exhibit Table of Content: Conducting portfolio analysis
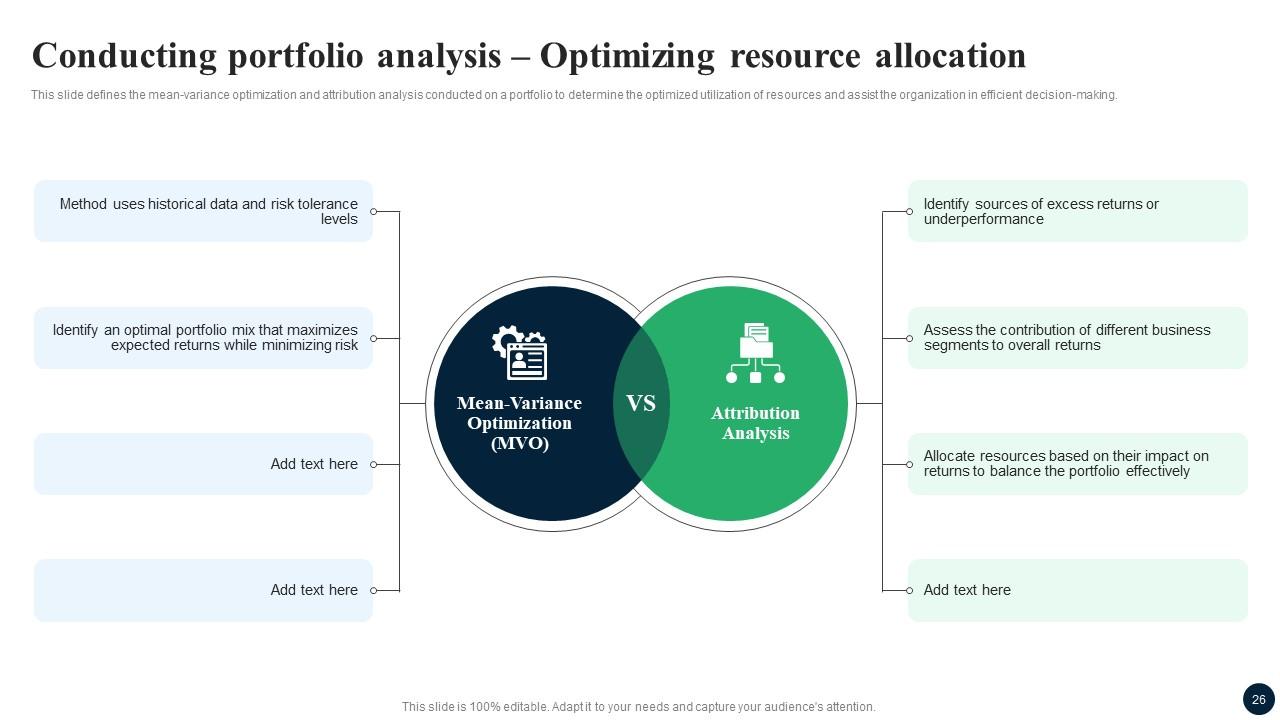
Slide 26: This slide defines the mean-variance optimization and attribution analysis conducted on a portfolio to determine the optimized utilization of resources.
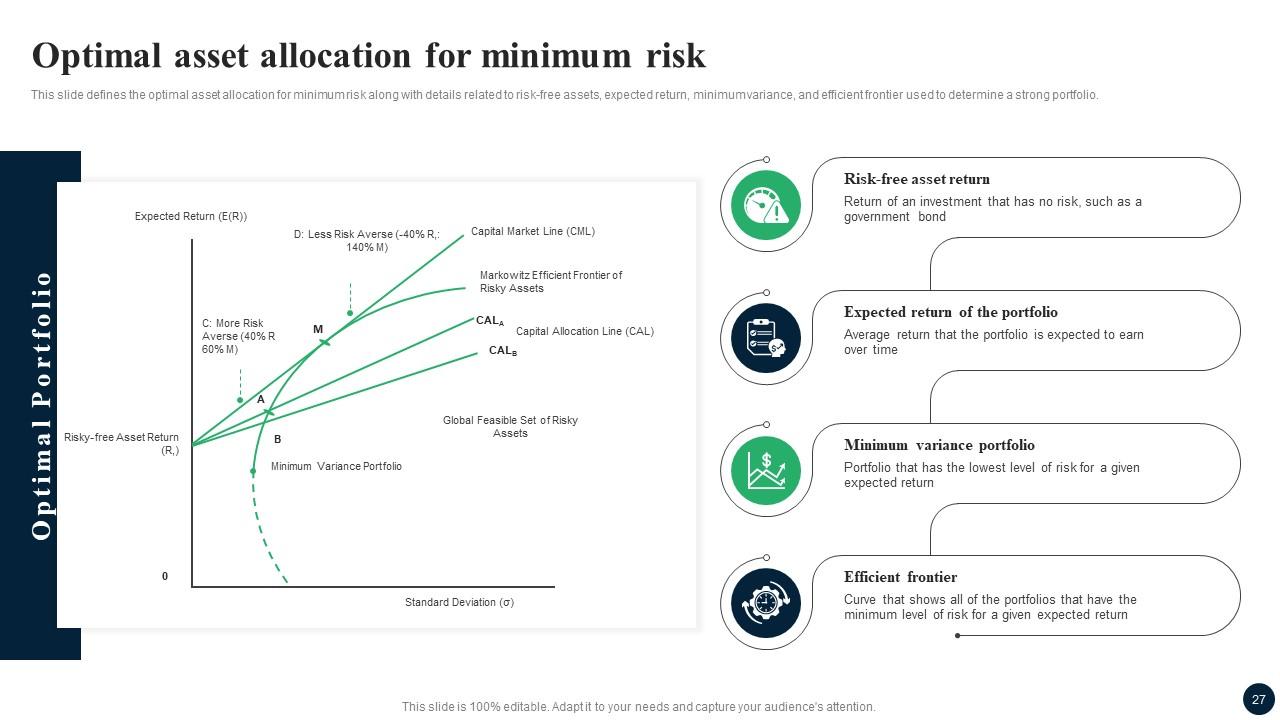
Slide 27: This slide defines the optimal asset allocation for minimum risk along with details related to risk-free assets, expected return, minimum variance etc.
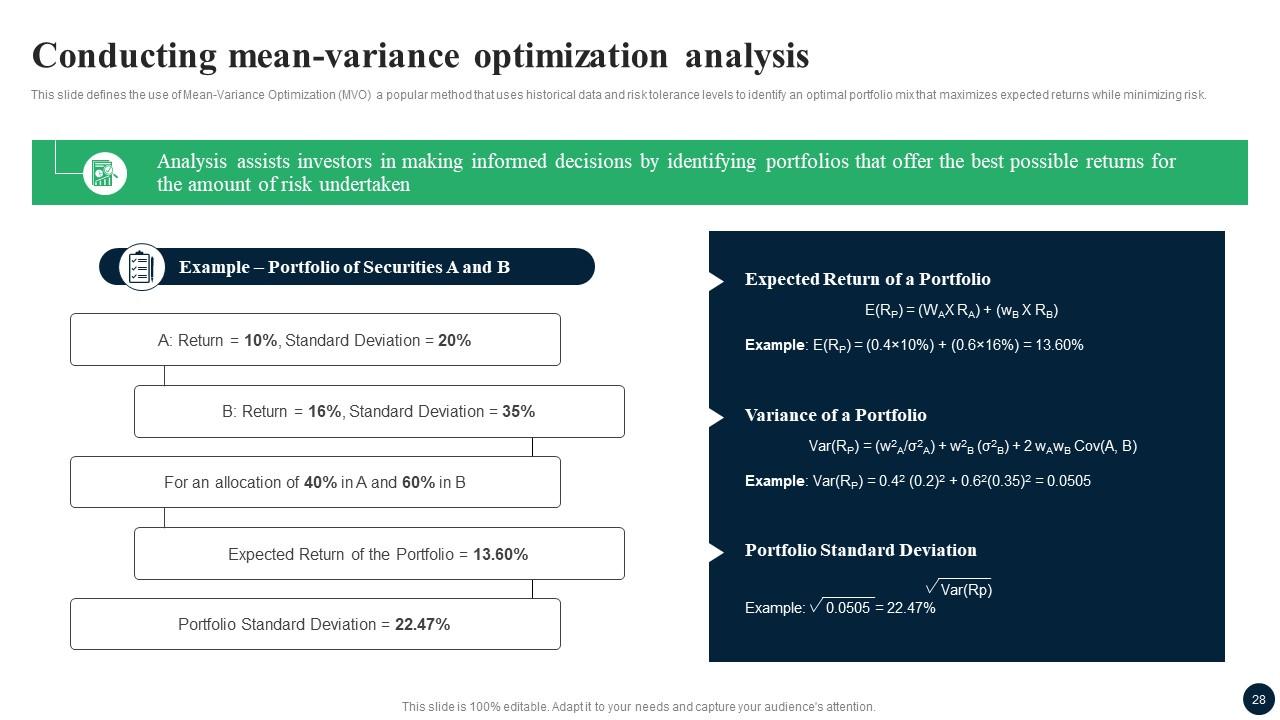
Slide 28: This slide defines the use of Mean-Variance Optimization (MVO) a popular method that uses historical data and risk tolerance levels to identify an optimal portfolio.
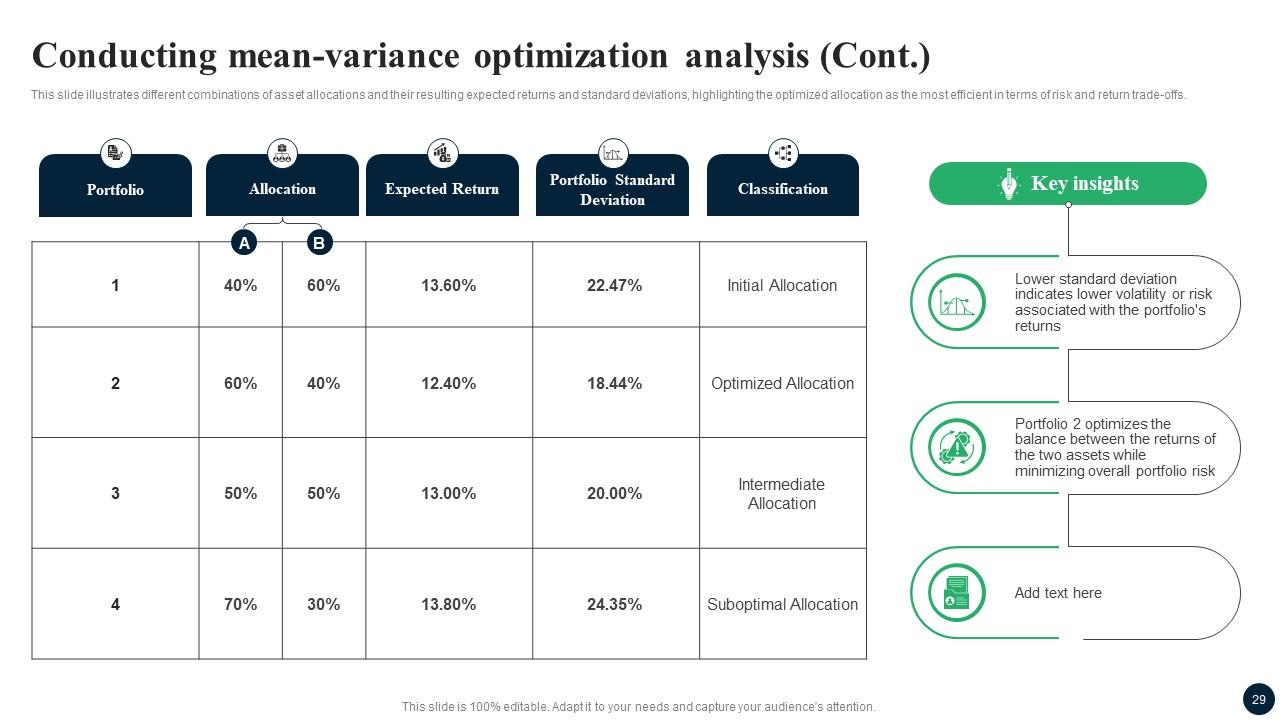
Slide 29: This slide illustrates different combinations of asset allocations and their resulting expected returns and standard deviations.
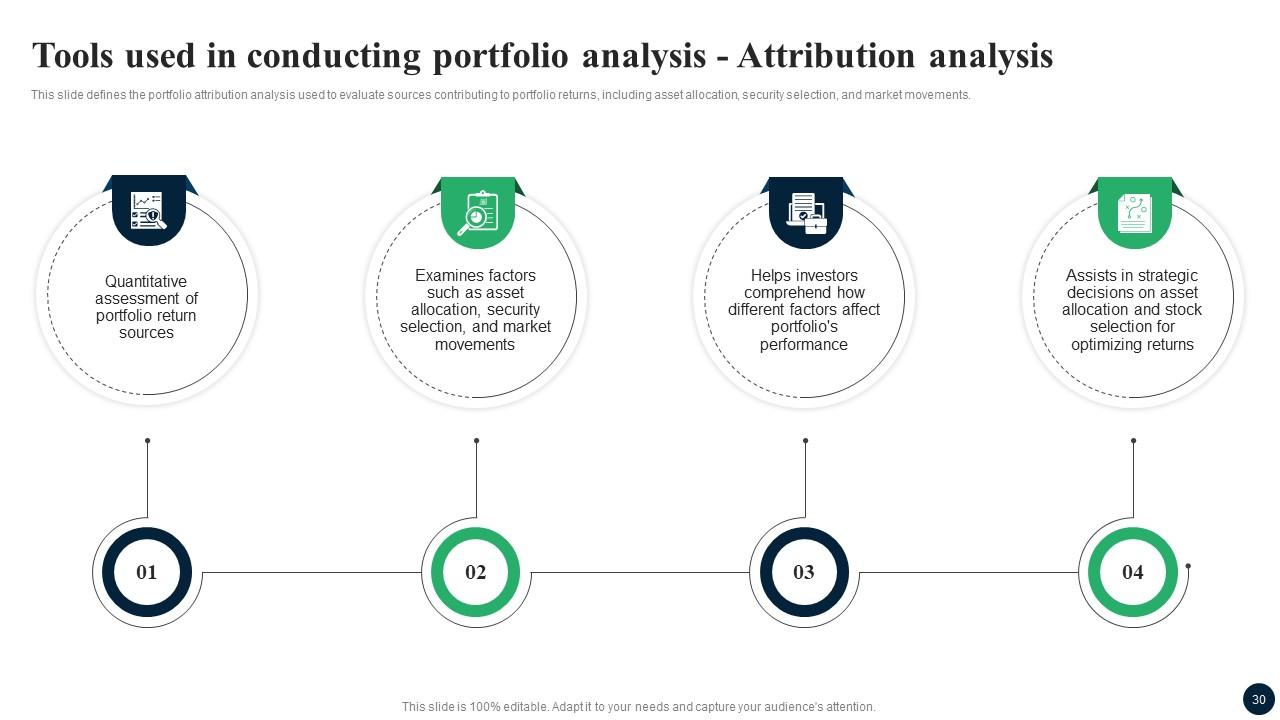
Slide 30: This slide defines the portfolio attribution analysis used to evaluate sources contributing to portfolio returns.
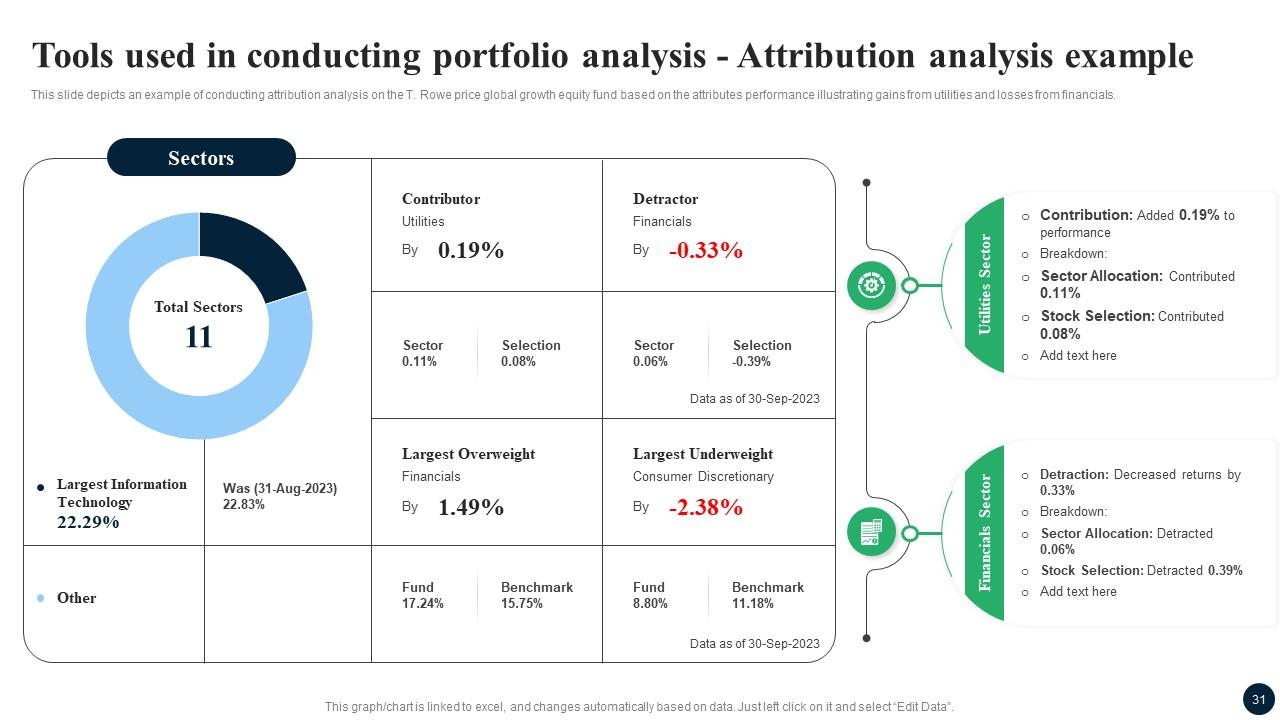
Slide 31: This slide depicts an example of conducting attribution analysis on the T. Rowe price global growth equity fund based on the attributes performance.
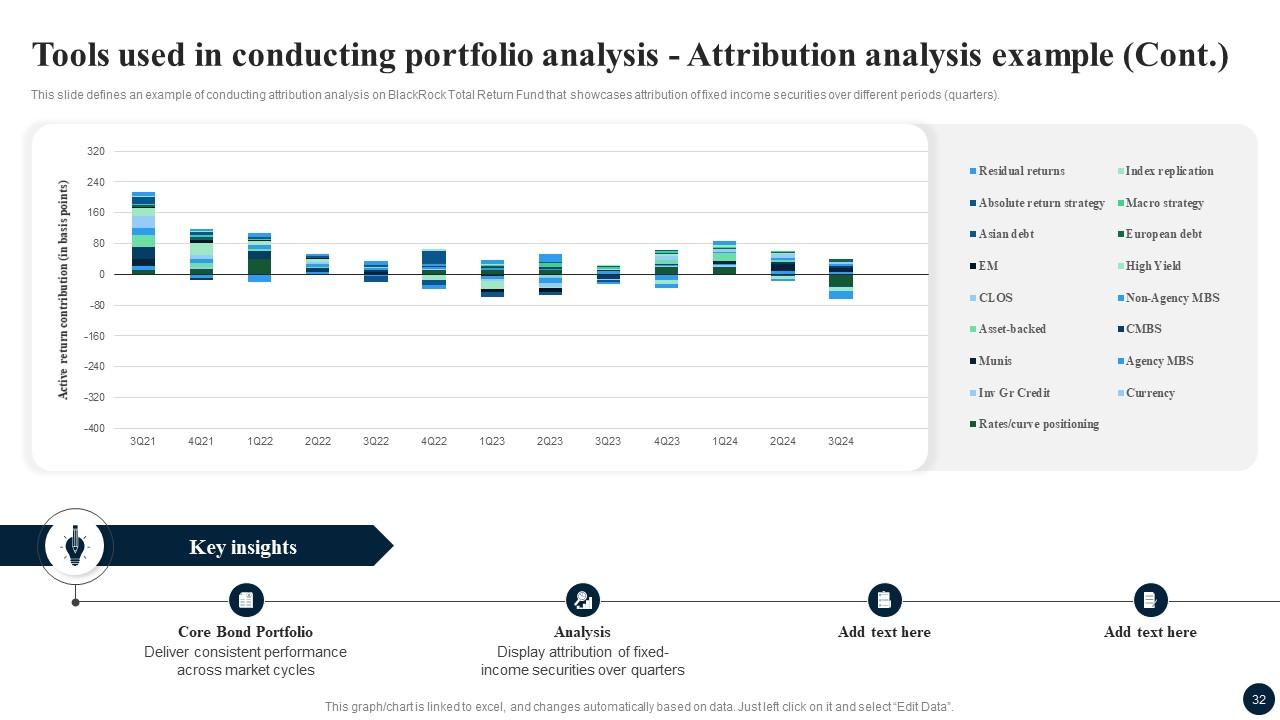
Slide 32: This slide defines an example of conducting attribution analysis on BlackRock Total Return Fund that showcases attribution of fixed income securities.
Slide 33: This slide exhibit Table of Content: Identifying opportunities.
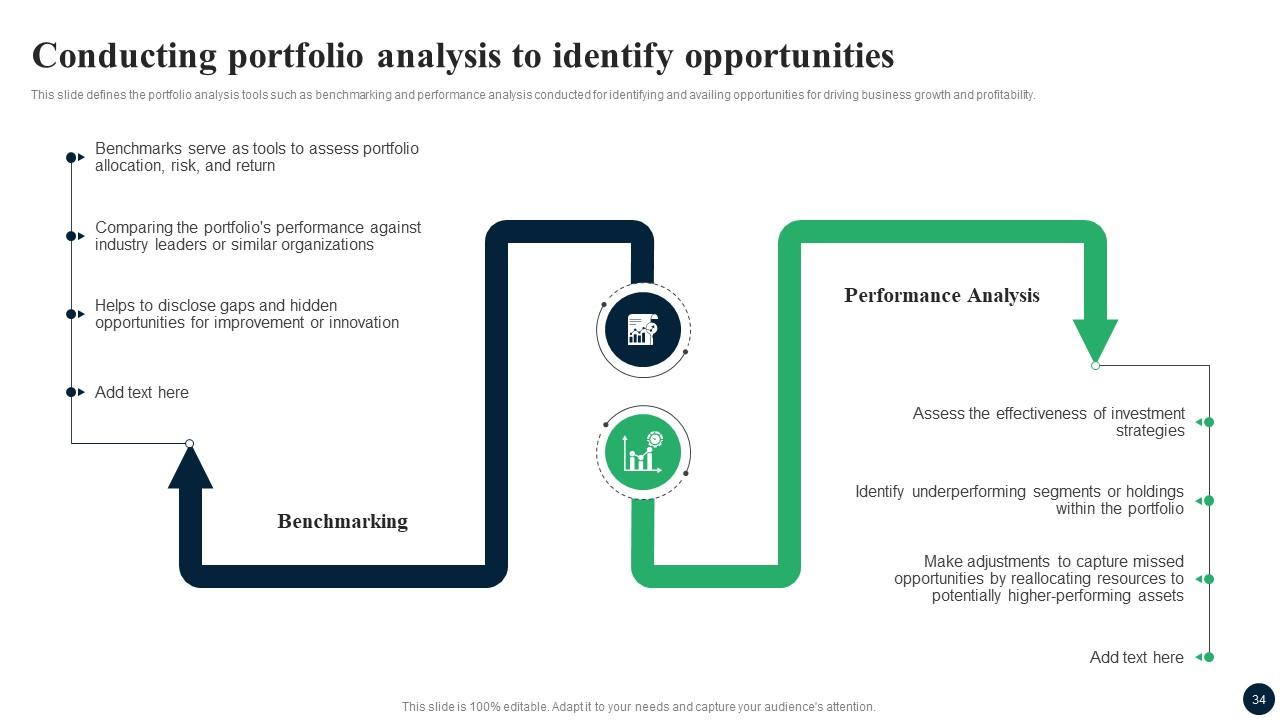
Slide 34: This slide defines the portfolio analysis tools such as benchmarking and performance analysis conducted for identifying and availing opportunities.
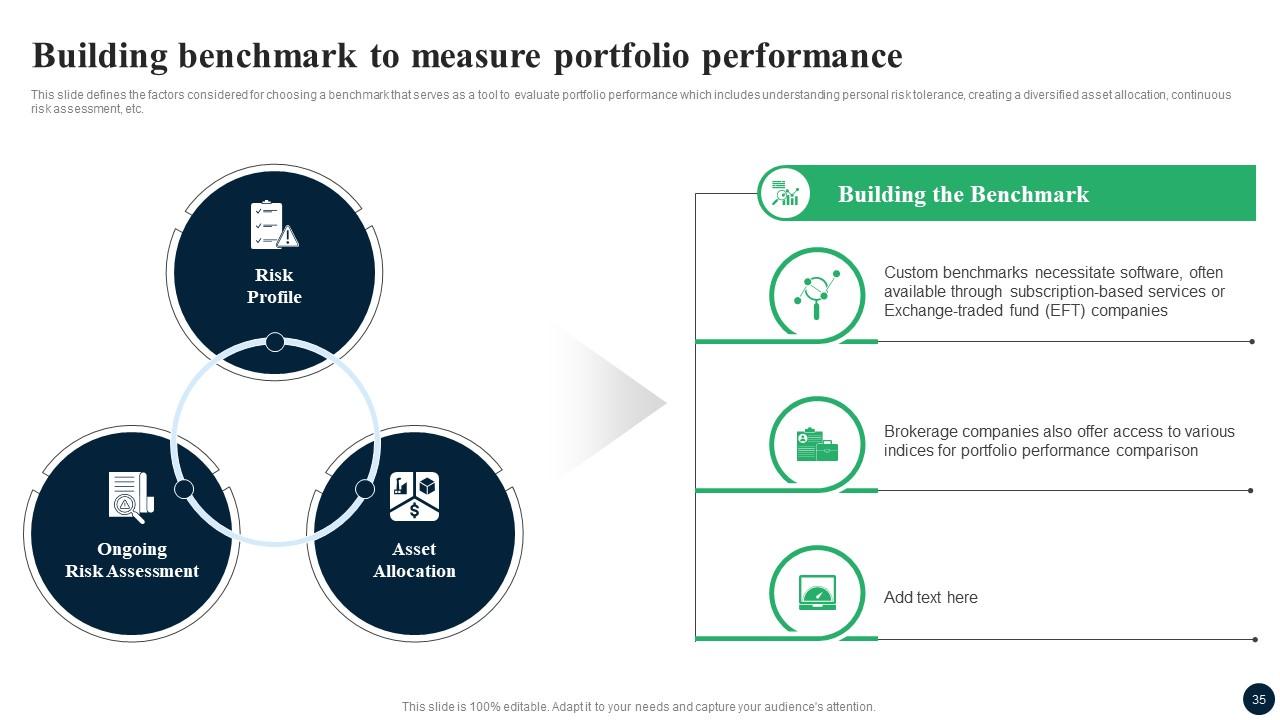
Slide 35: This slide defines the factors considered for choosing a benchmark that serves as a tool to evaluate portfolio performance.
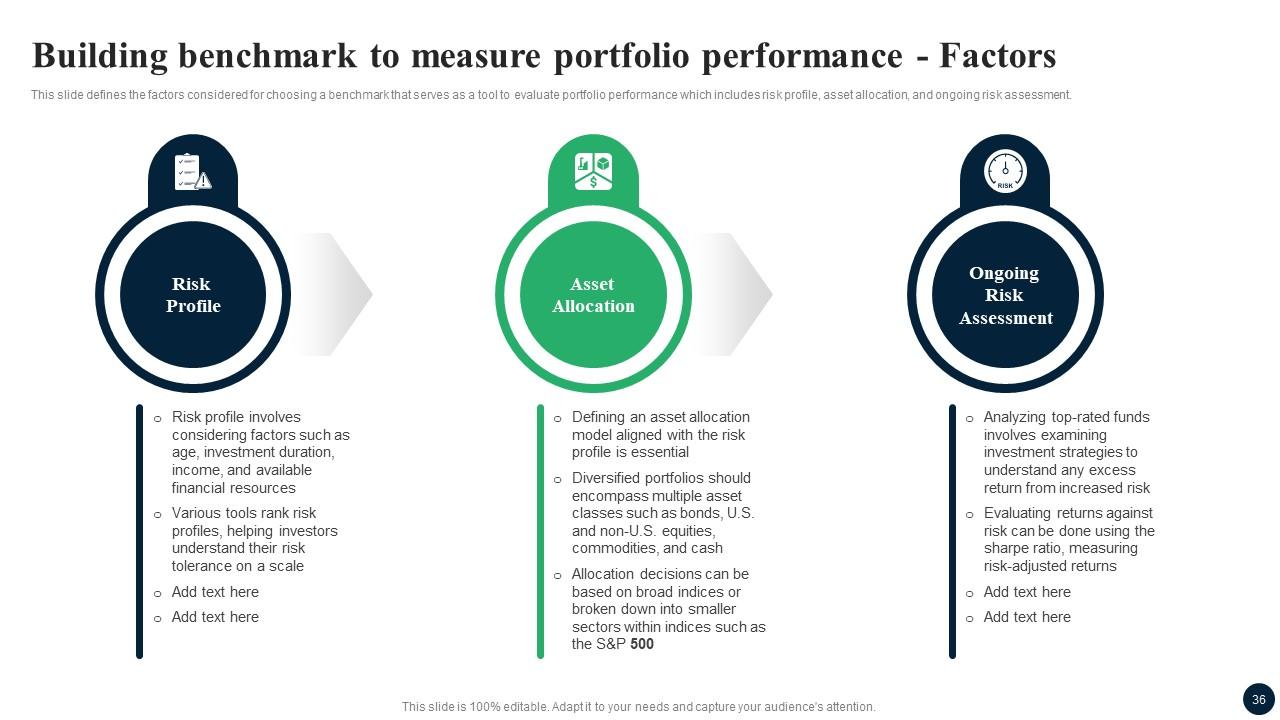
Slide 36: This slide defines the factors considered for choosing a benchmark that serves as a tool to evaluate portfolio performance.
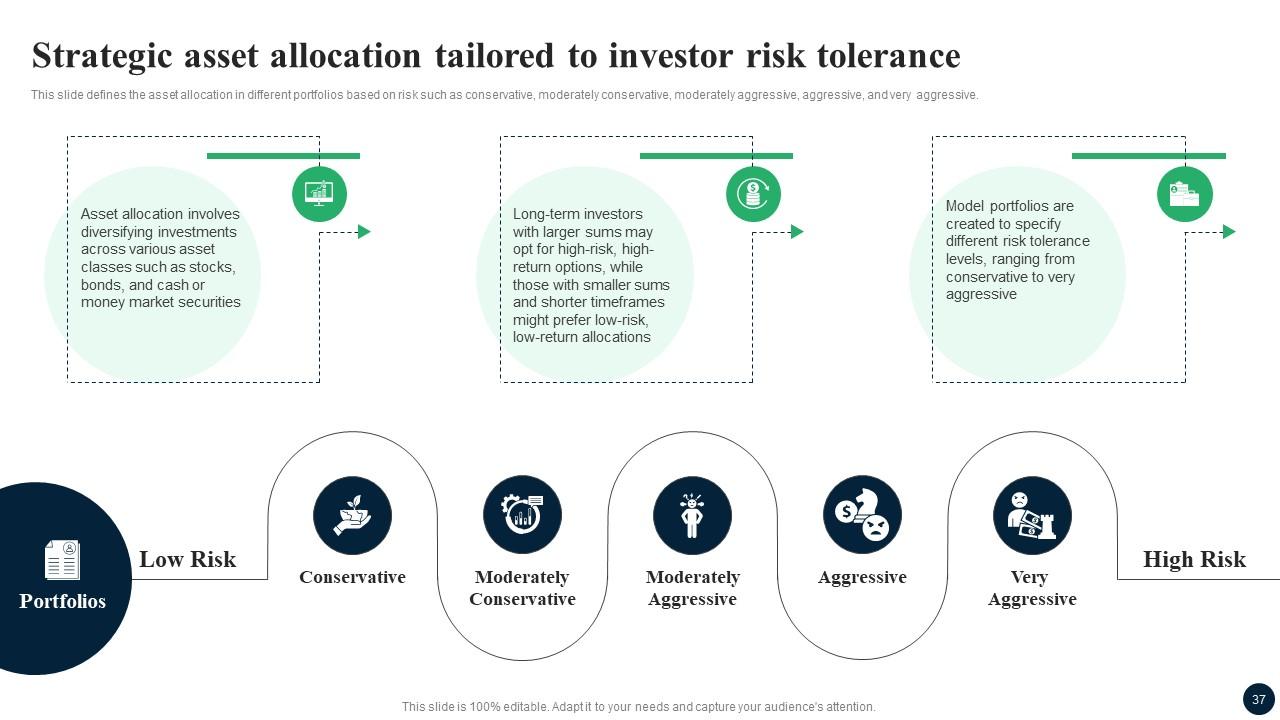
Slide 37: This slide defines the asset allocation in different portfolios based on risk.
Slide 38: This slide defines the different asset classes such as stocks (large-cap, mid-cap, and small-cap), bonds, and cash or money market securities in asset allocation.
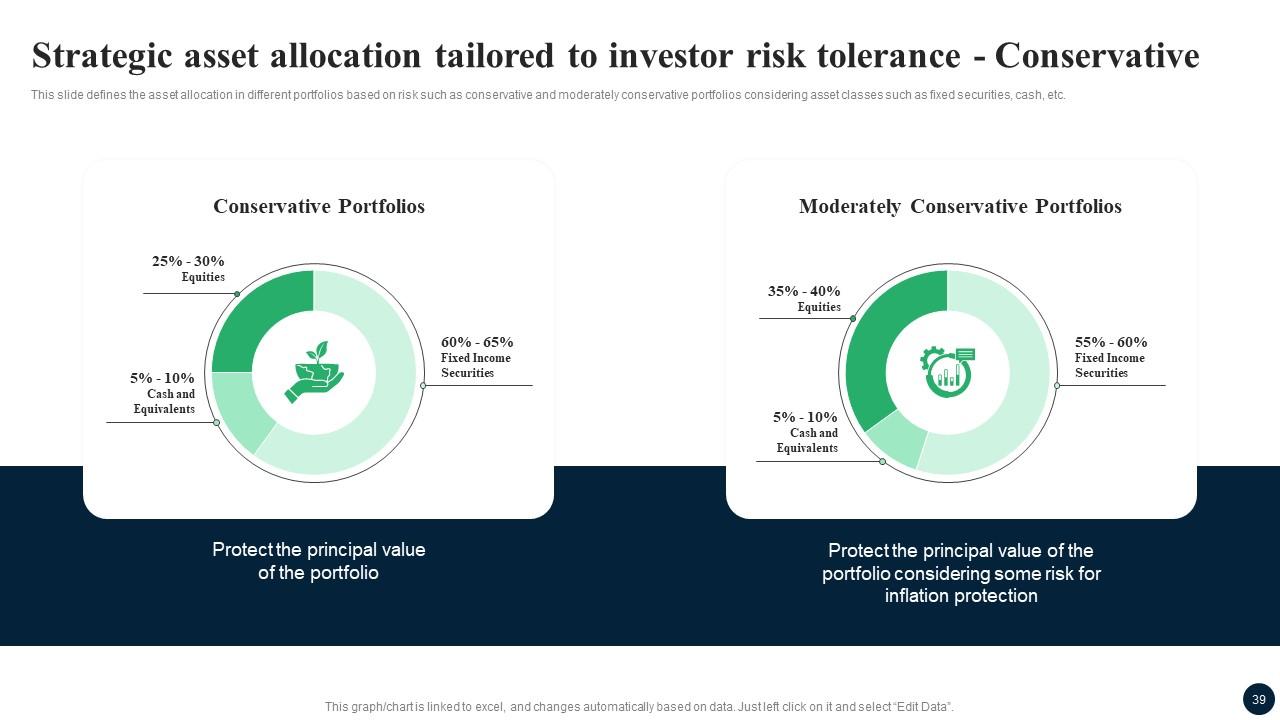
Slide 39: This slide defines the asset allocation in different portfolios based on risk.
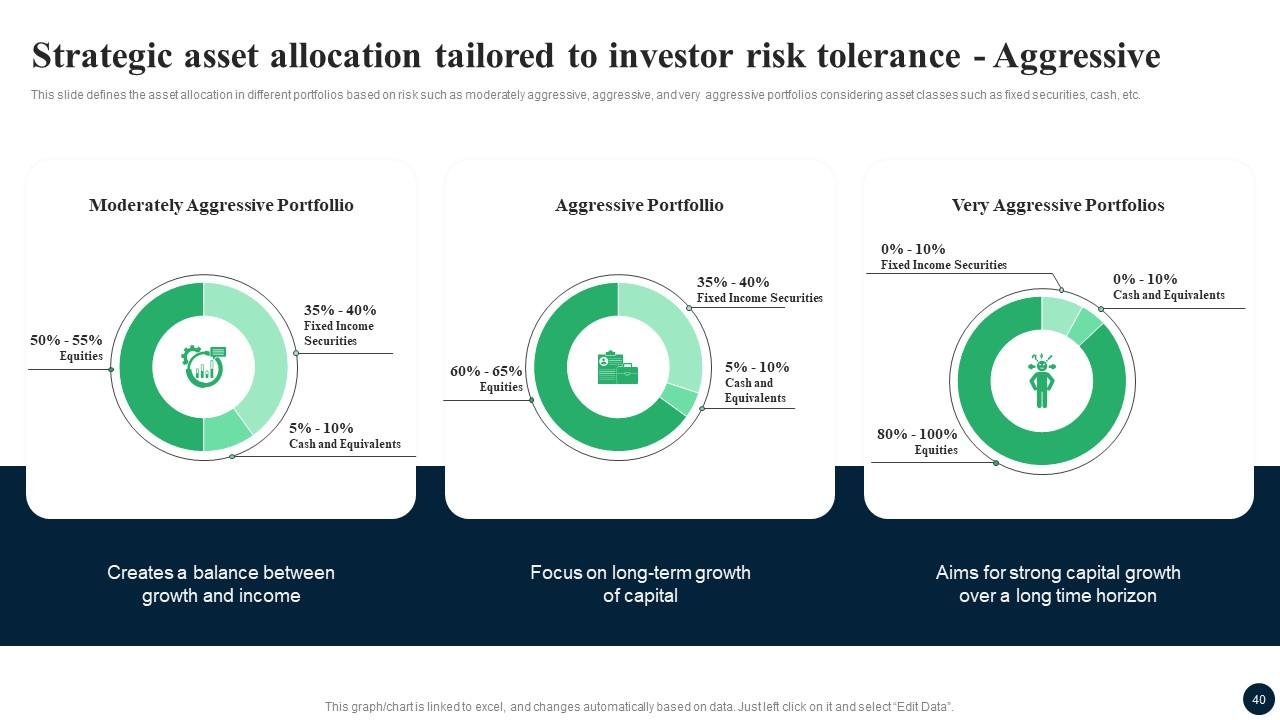
Slide 40: This slide defines the asset allocation in different portfolios based on risk such as moderately aggressive, aggressive, and very aggressive portfolios.
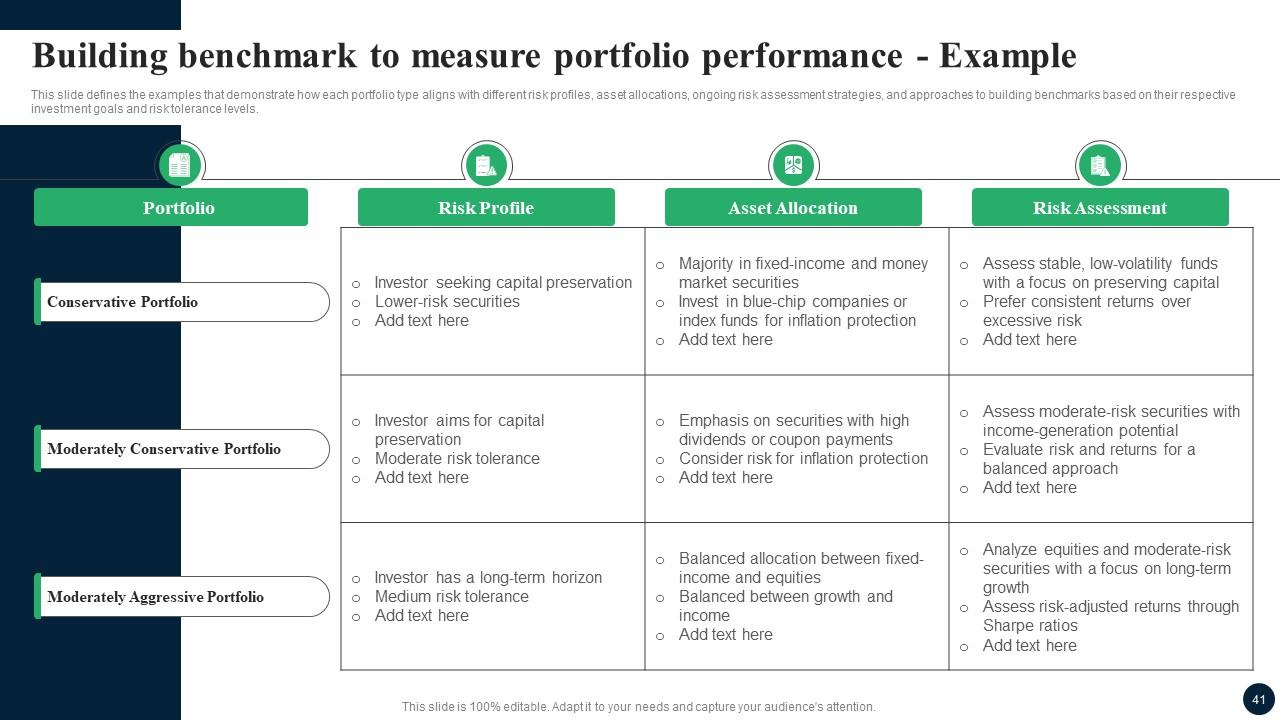
Slide 41: This slide defines the examples that demonstrate how each portfolio type aligns with different risk profiles, asset allocations, ongoing risk assessment strategies.
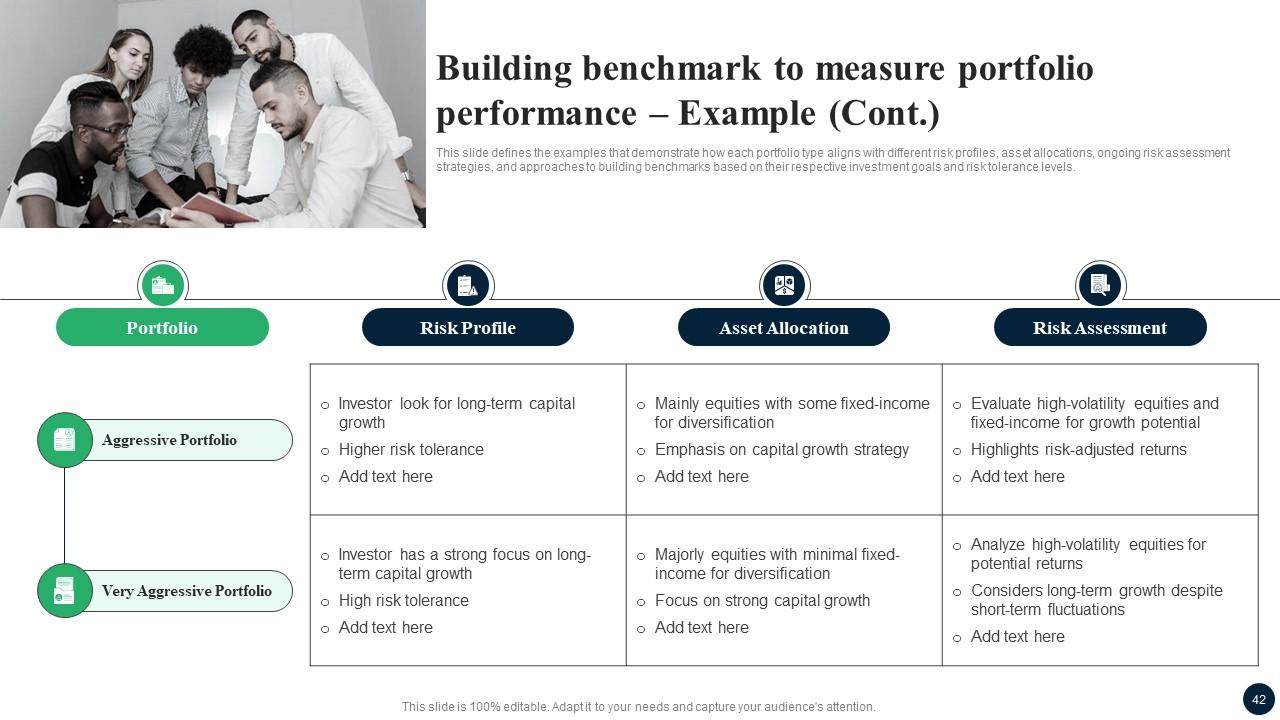
Slide 42: This slide defines the examples that demonstrate how each portfolio type aligns with different risk profiles, asset allocations, ongoing risk assessment strategies.
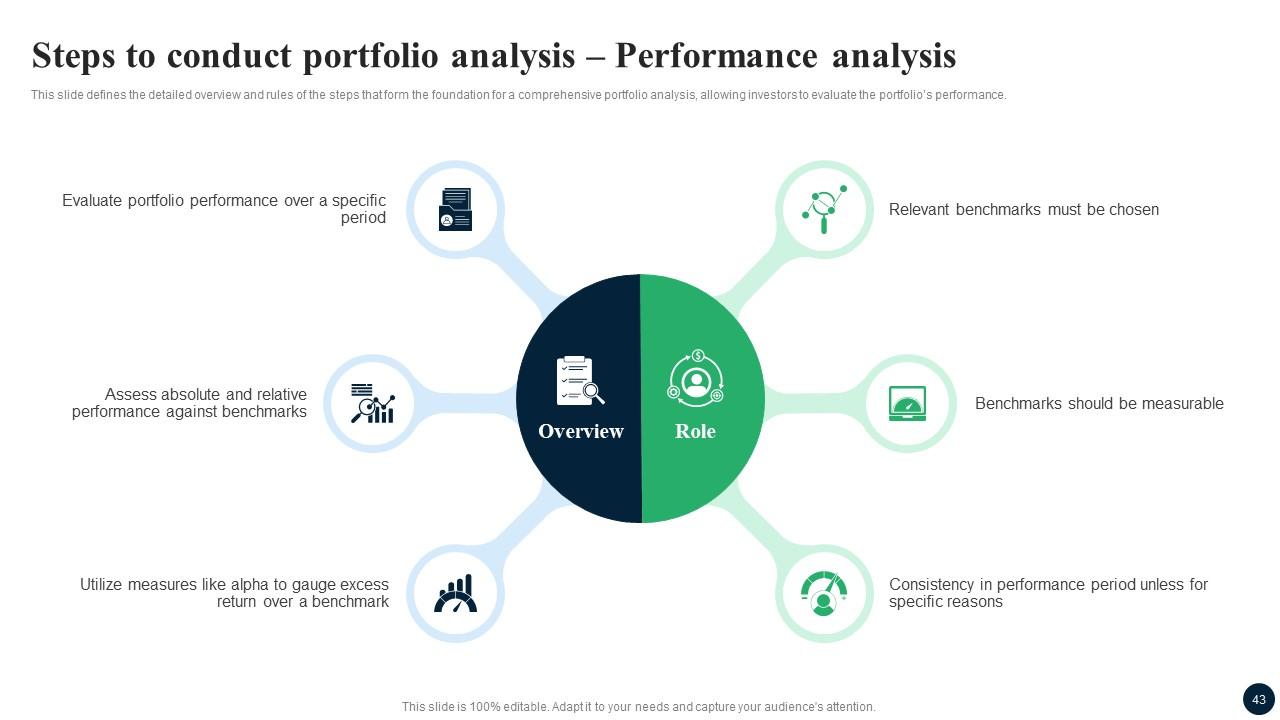
Slide 43: This slide defines the detailed overview and rules of the steps that form the foundation for a comprehensive portfolio analysis.
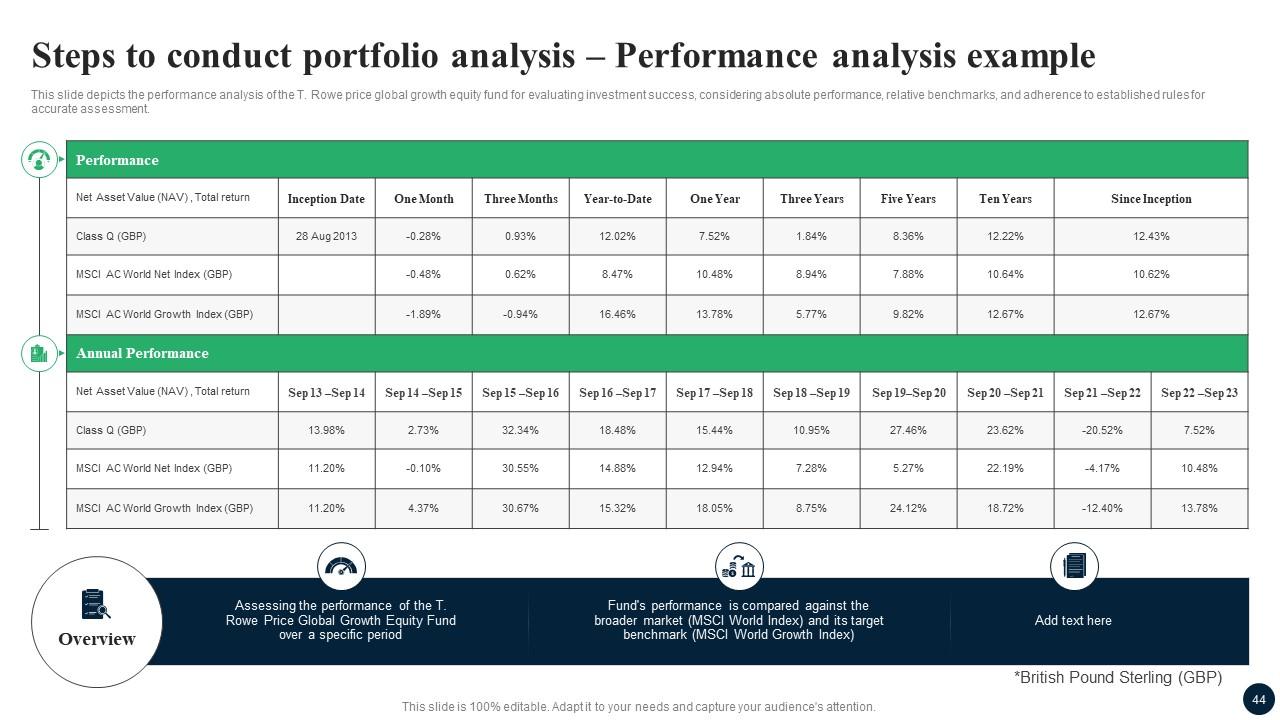
Slide 44: This slide depicts the performance analysis of the T. Rowe price global growth equity fund for evaluating investment success.
Slide 45: This slide exhibit Table of Content: Evaluate risk exposure and improve decision-making.
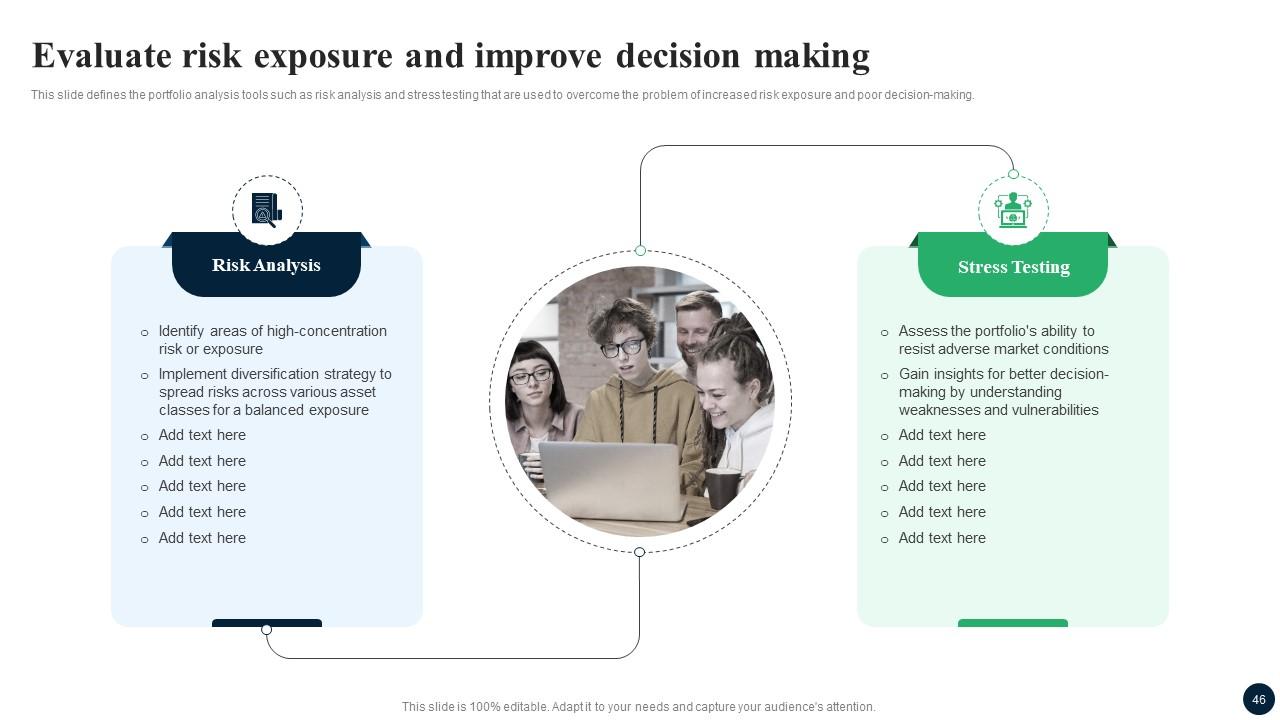
Slide 46: This slide defines the portfolio analysis tools such as risk analysis and stress testing that are used to overcome the problem of increased risk exposure.
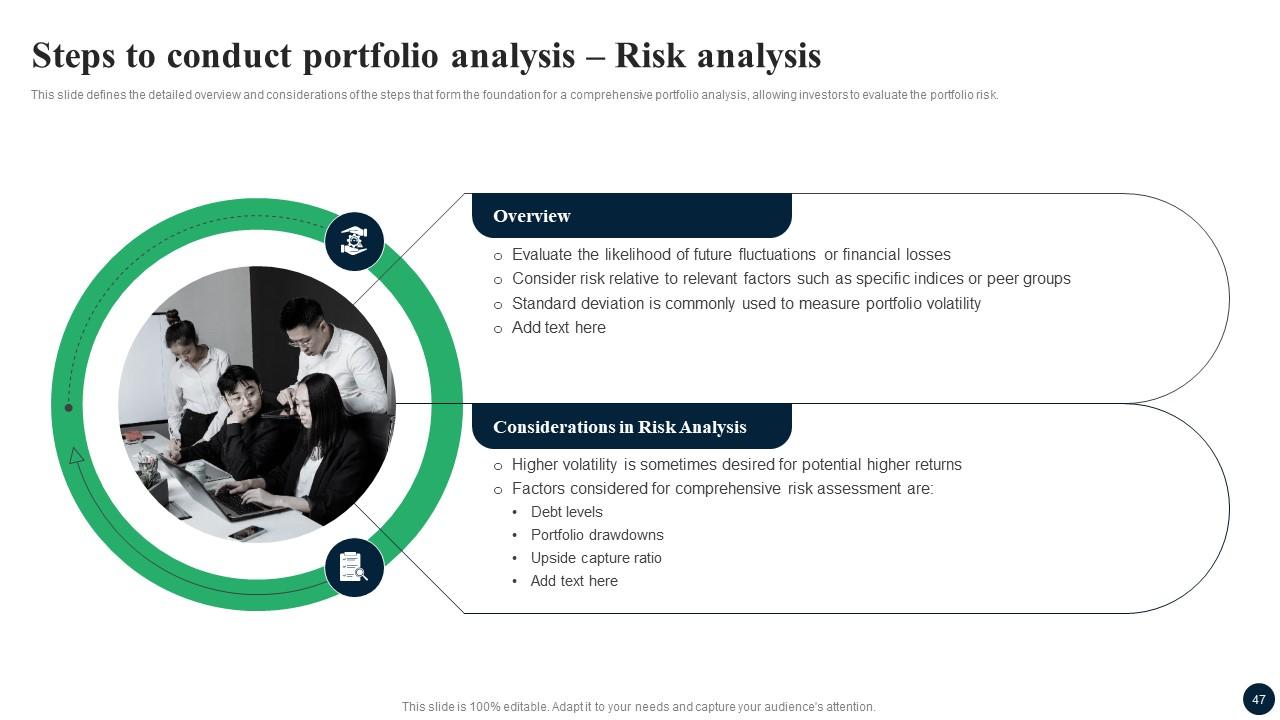
Slide 47: This slide defines the detailed overview and considerations of the steps that form the foundation for a comprehensive portfolio analysis.
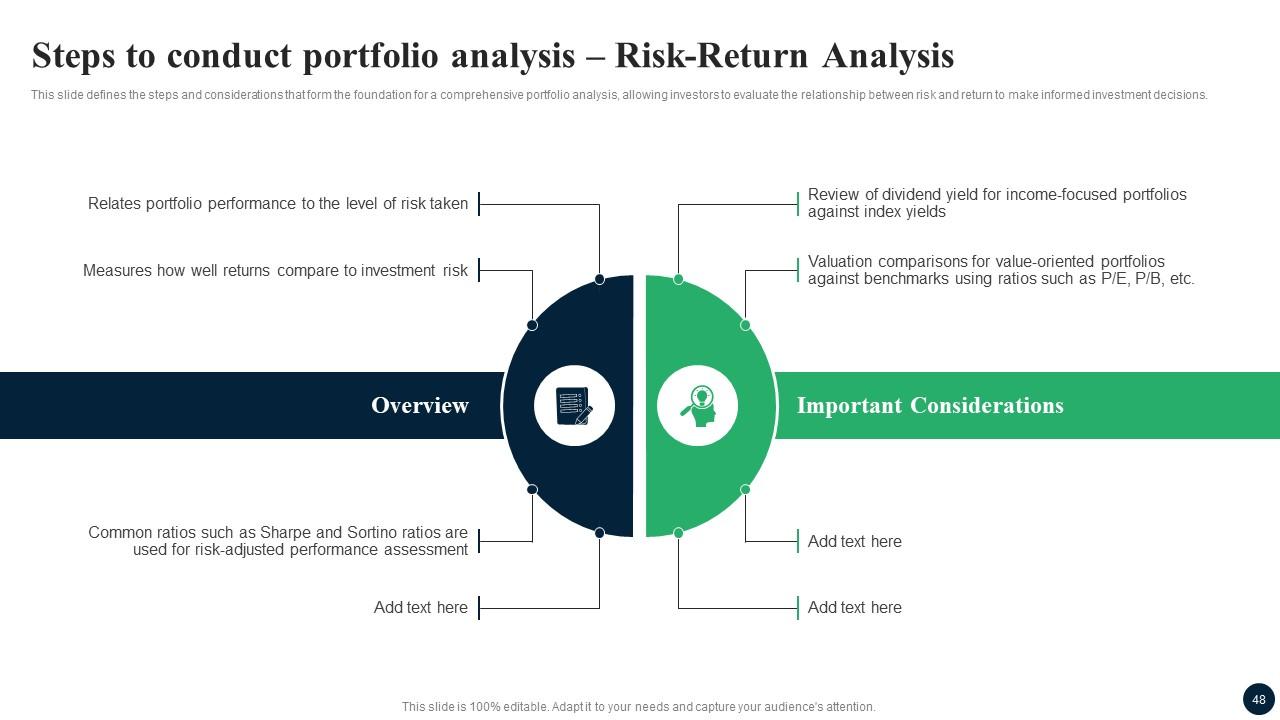
Slide 48: This slide defines the steps and considerations that form the foundation for a comprehensive portfolio analysis.
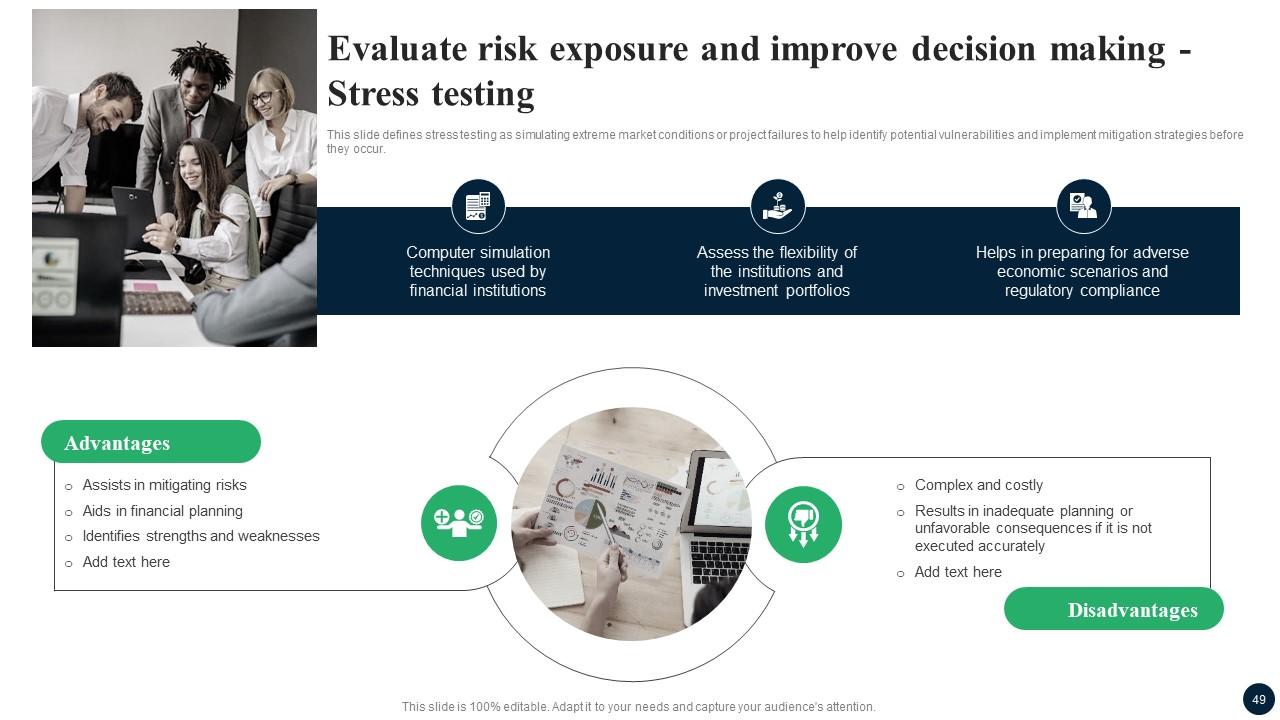
Slide 49: This slide defines stress testing as simulating extreme market conditions or project failures to help identify potential vulnerabilities.
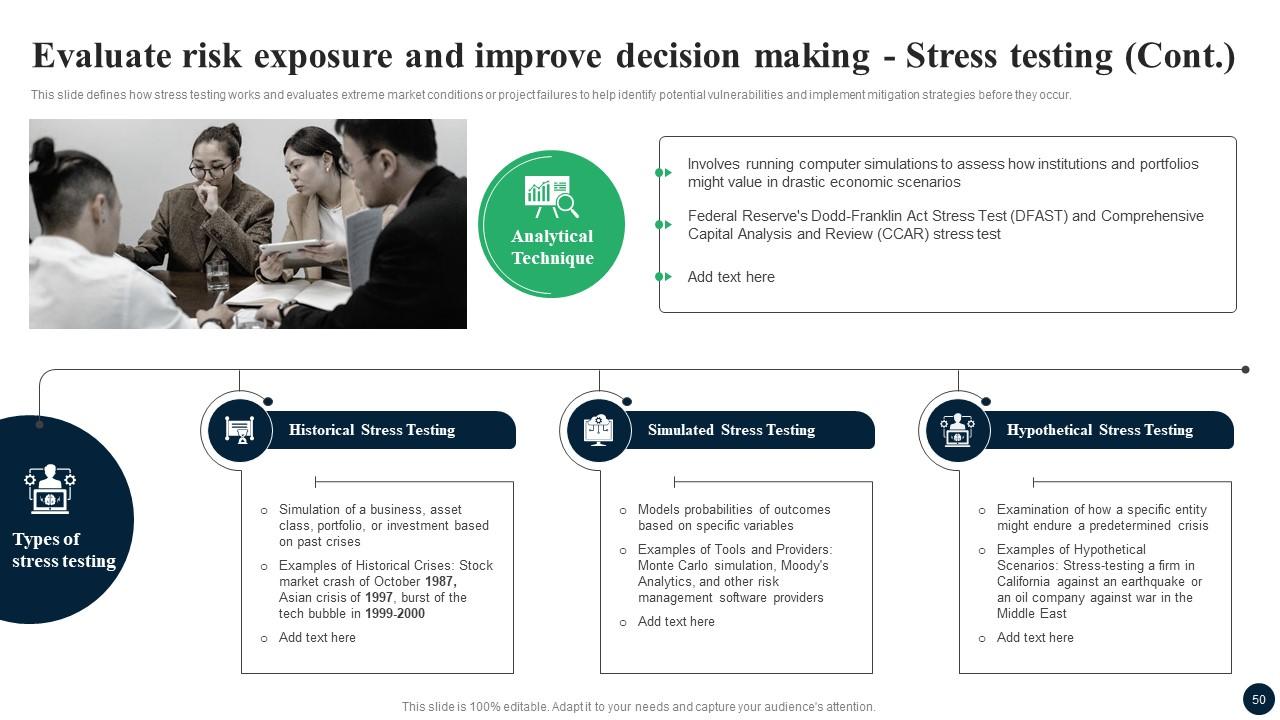
Slide 50: This slide defines how stress testing works and evaluates extreme market conditions or project failures to help identify potential vulnerabilities.
Slide 51: This slide exhibit Table of Content: Improve accountability.
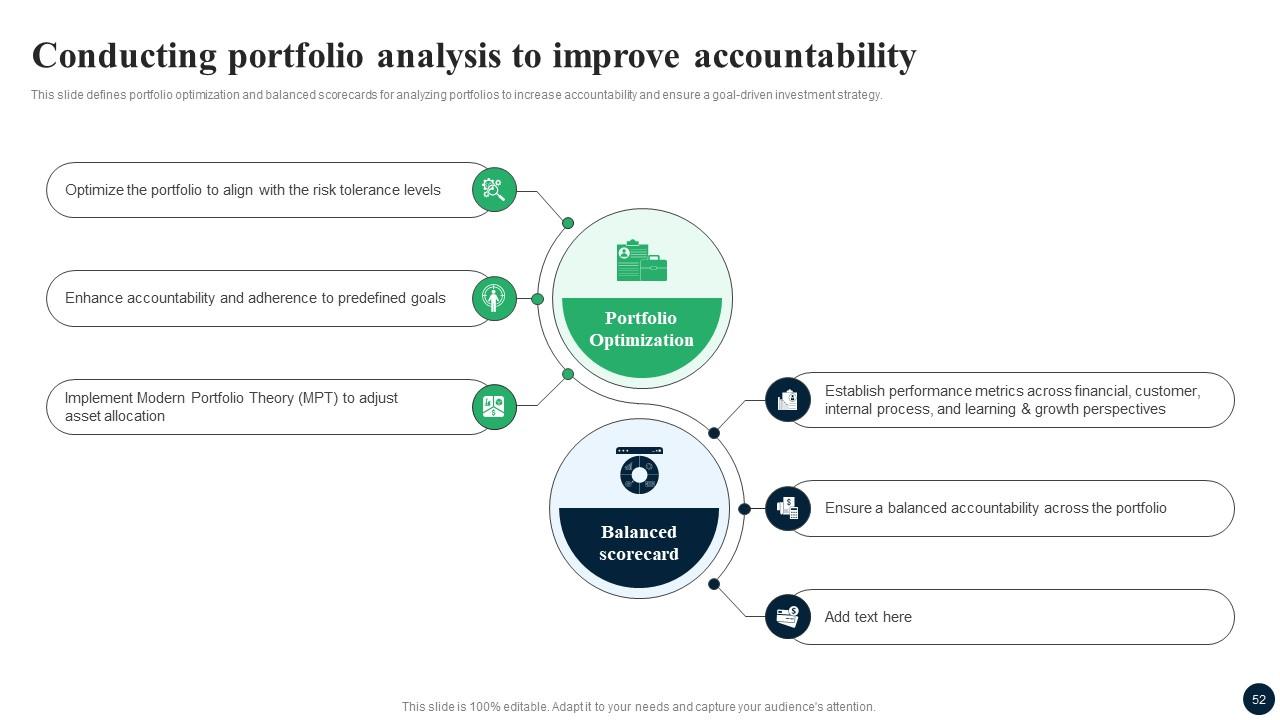
Slide 52: This slide defines portfolio optimization and balanced scorecards for analyzing portfolios to increase accountability and ensure a goal-driven investment strategy.
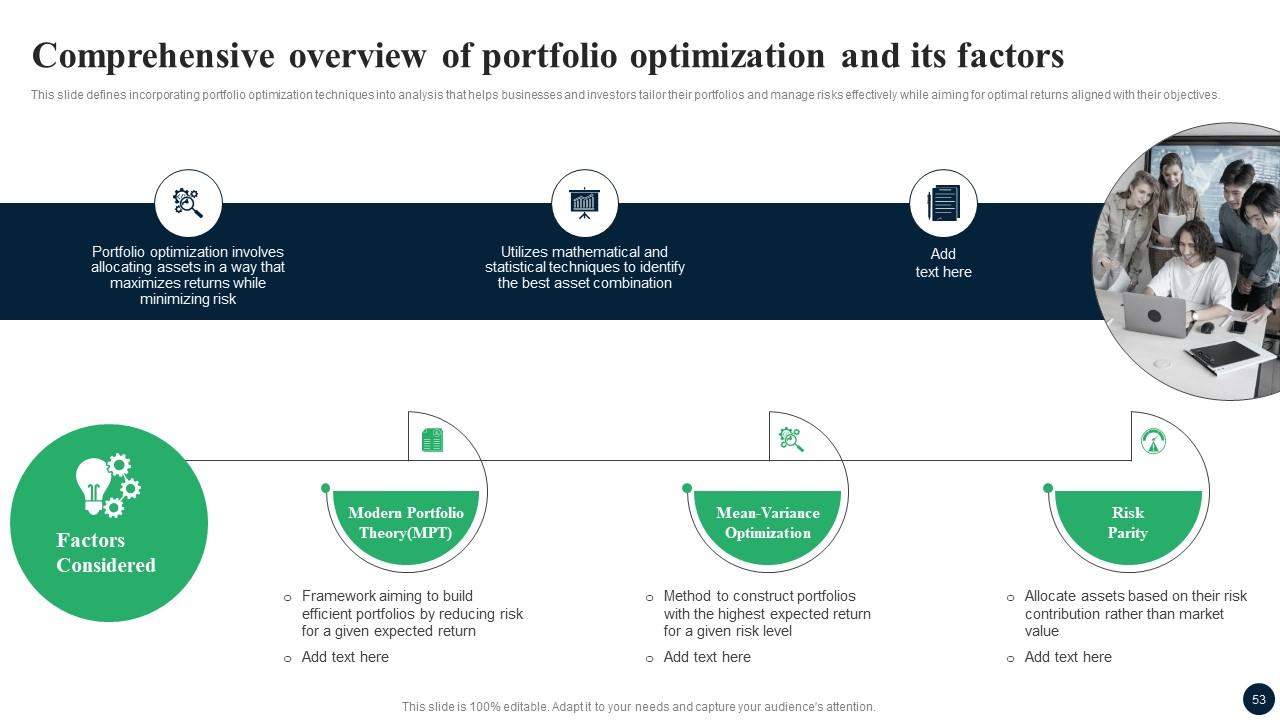
Slide 53: This slide defines incorporating portfolio optimization techniques into analysis that helps businesses and investors tailor their portfolios.
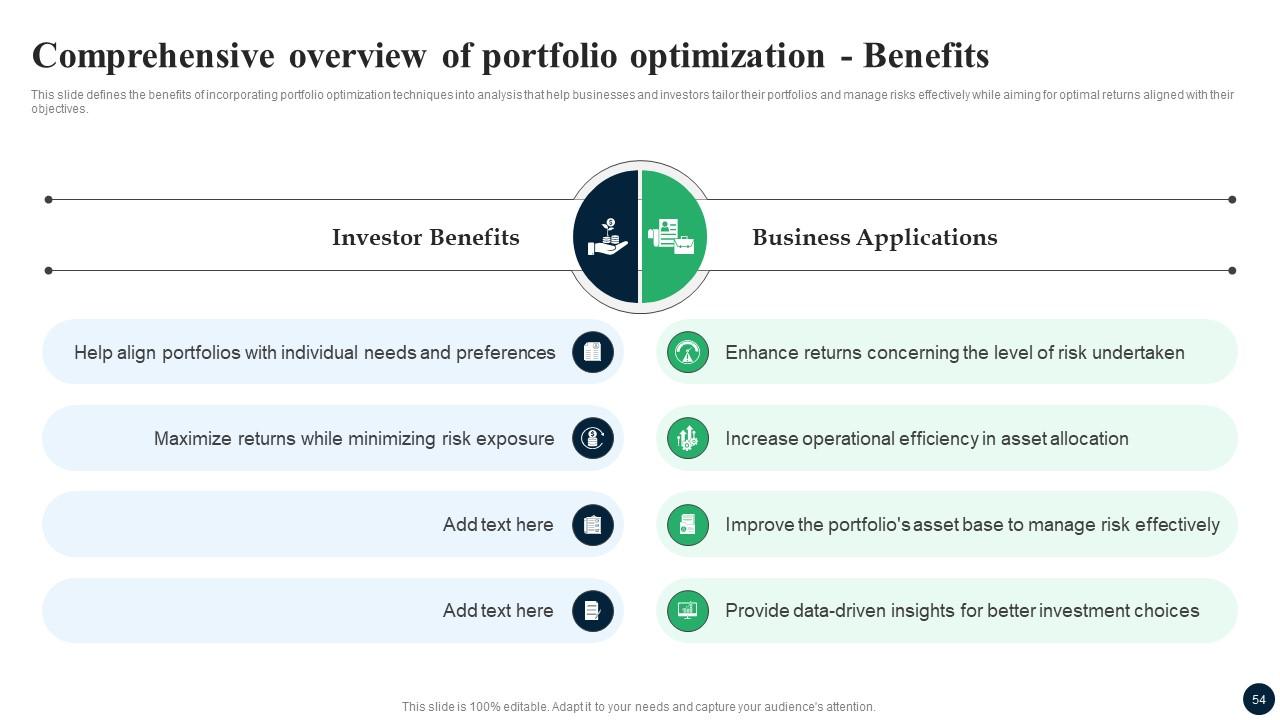
Slide 54: This slide defines the benefits of incorporating portfolio optimization techniques into analysis that help businesses and investors tailor their portfolios.
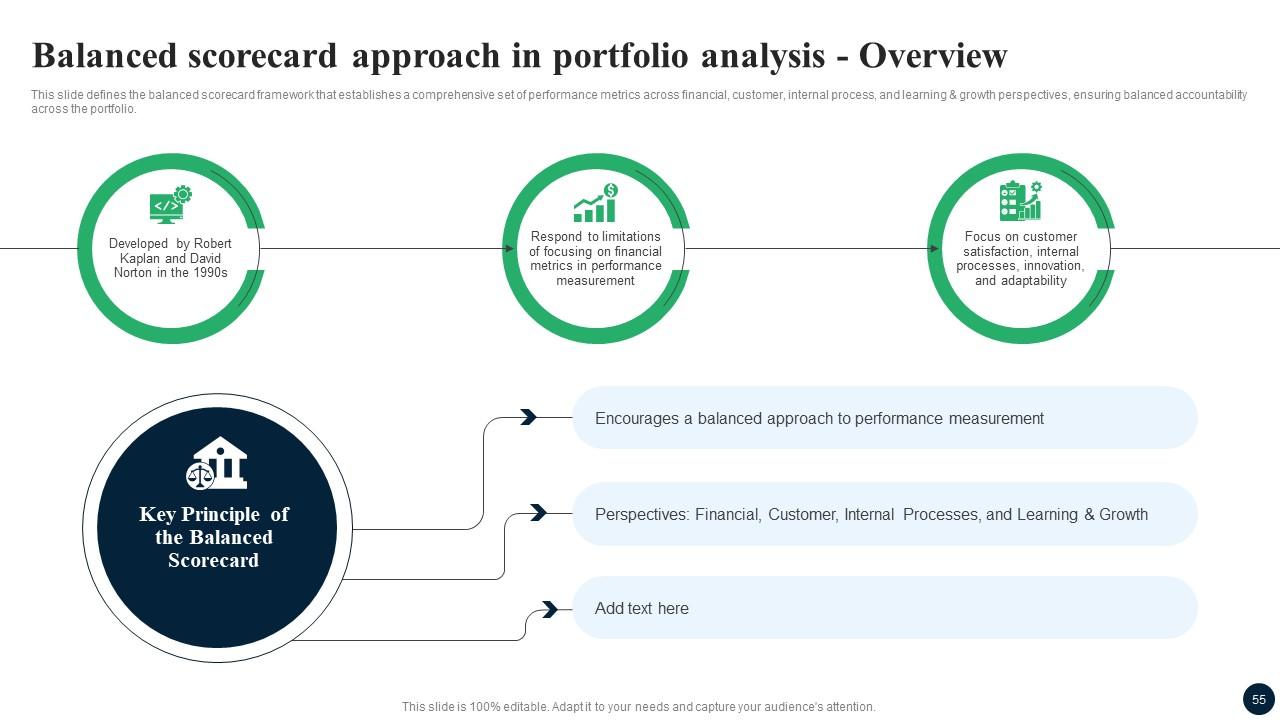
Slide 55: This slide defines the balanced scorecard framework that establishes a comprehensive set of performance metrics across financial, customer, internal process.
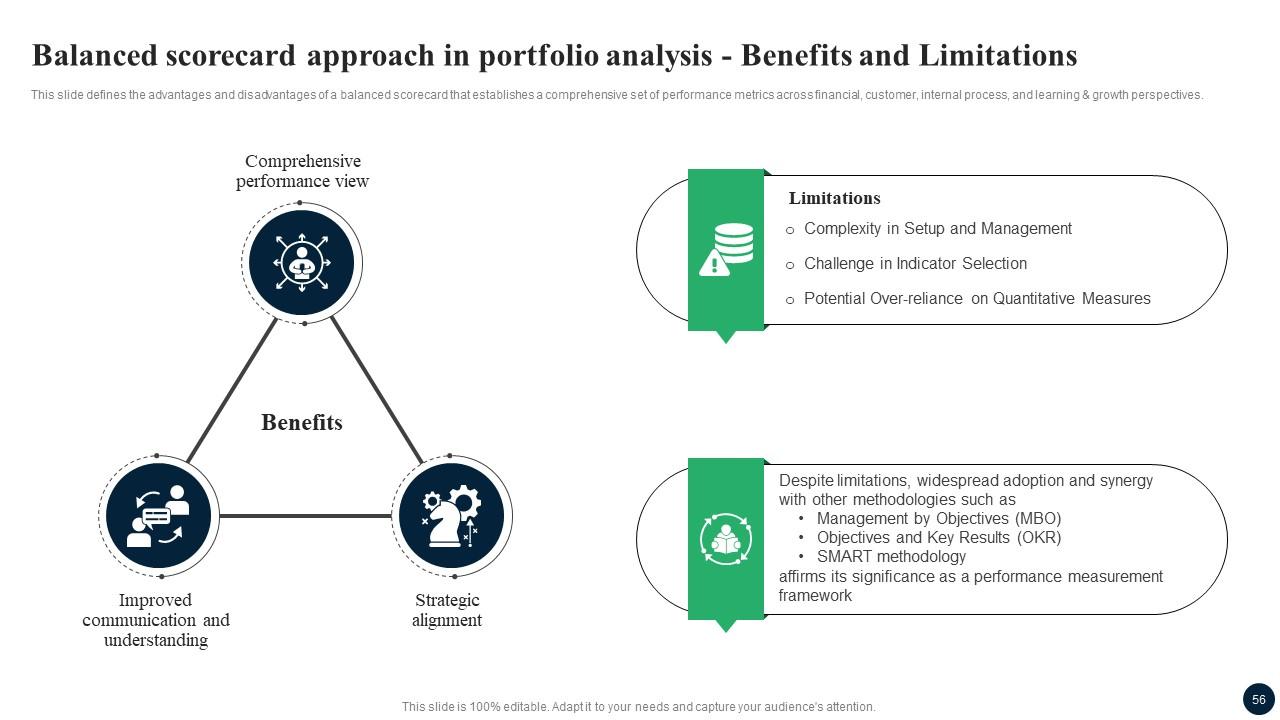
Slide 56: This slide defines the advantages and disadvantages of a balanced scorecard that establishes a comprehensive set of performance metrics.
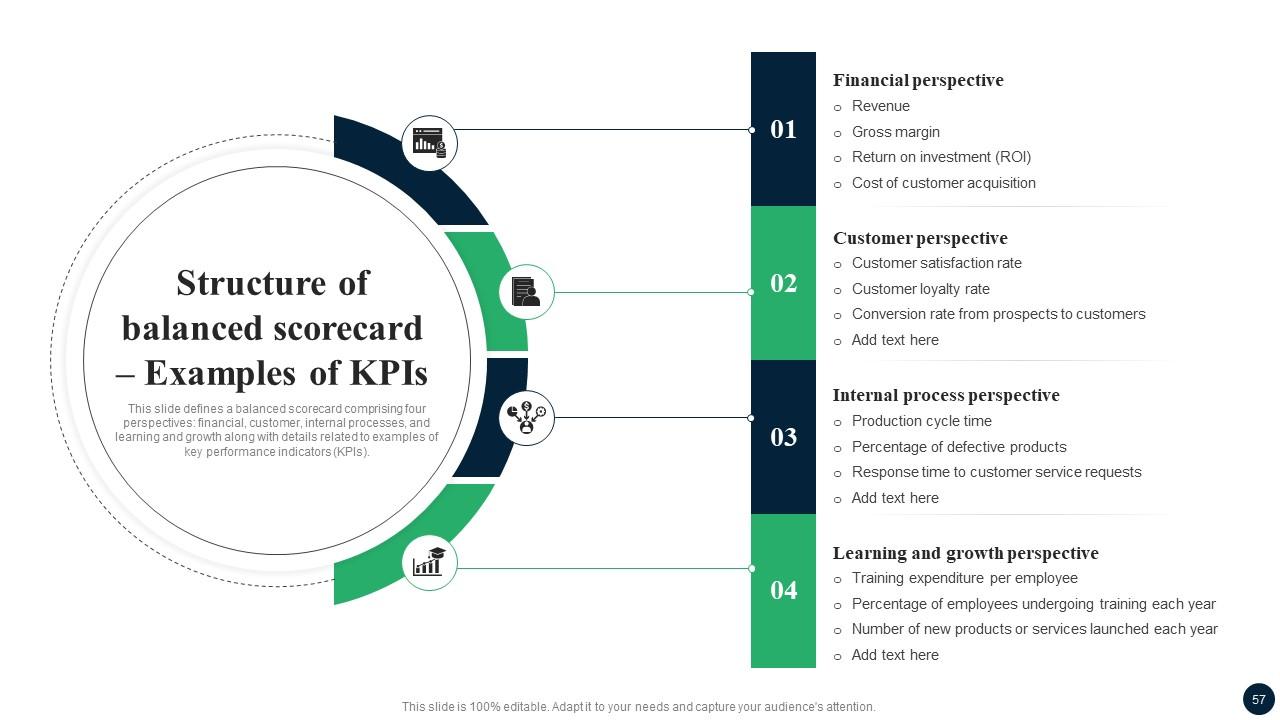
Slide 57: This slide defines a balanced scorecard comprising four perspectives: financial, customer, internal processes, and learning and growth along with details.
Slide 58: This slide exhibit Table of Content: Impact of implementing portfolio analysis solutions
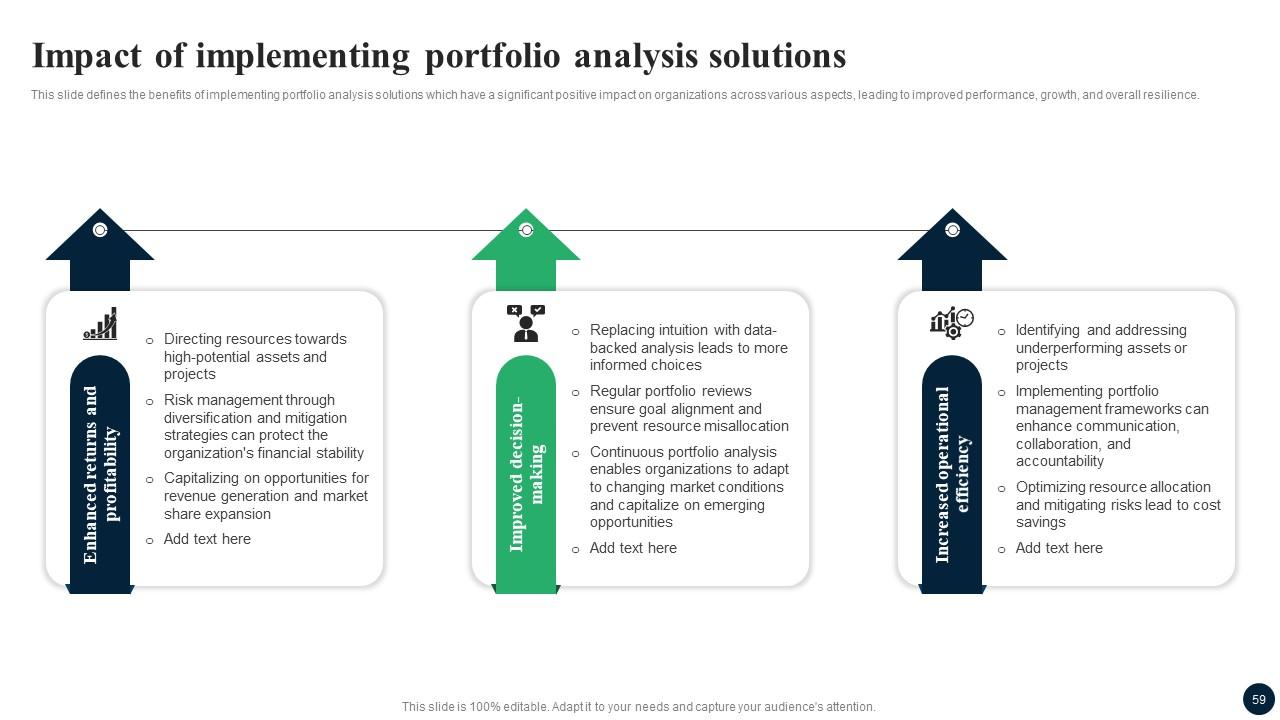
Slide 59: This slide defines the benefits of implementing portfolio analysis solutions which have a significant positive impact on organizations.
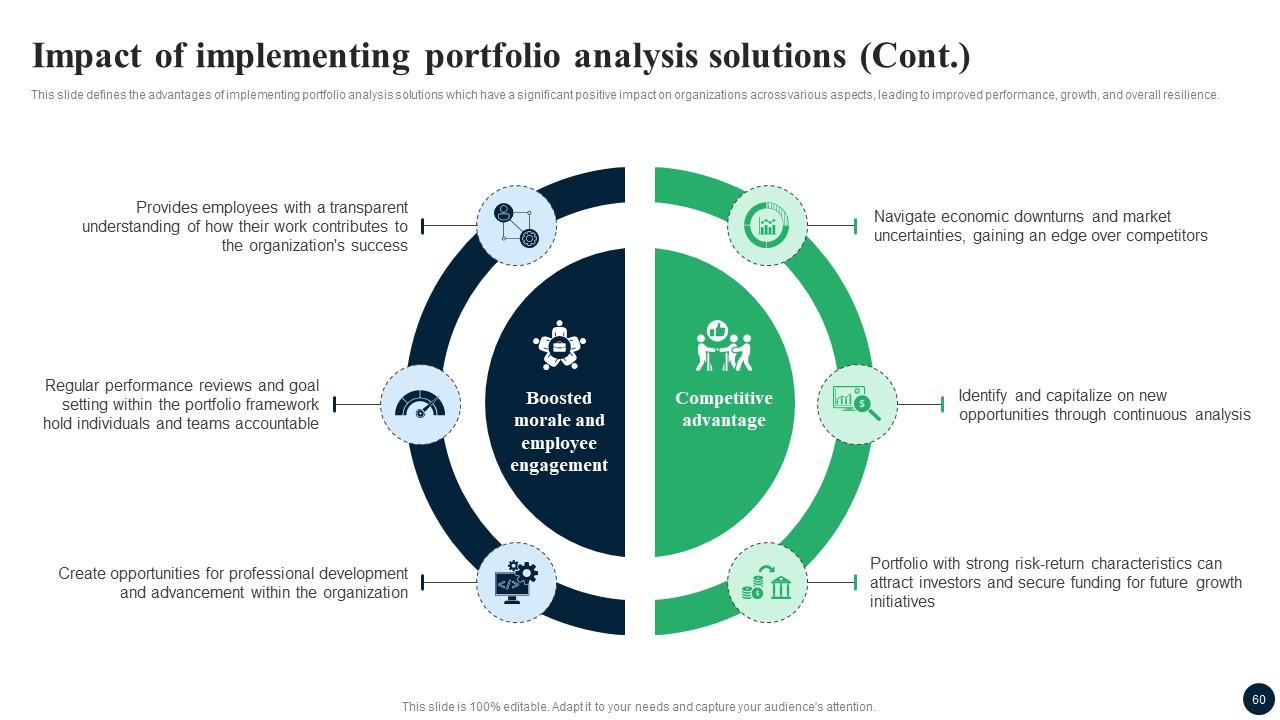
Slide 60: This slide defines the advantages of implementing portfolio analysis solutions which have a significant positive impact on organizations.
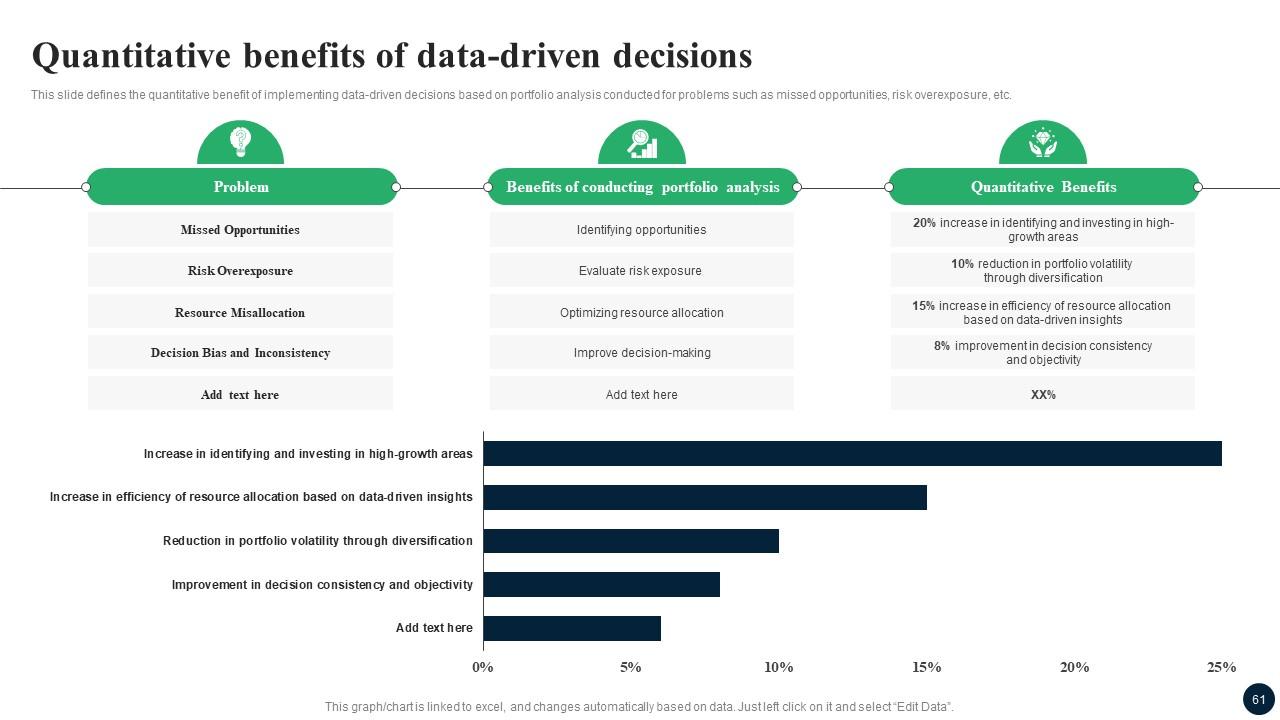
Slide 61: This slide defines the quantitative benefit of implementing data-driven decisions based on portfolio analysis conducted for problems.
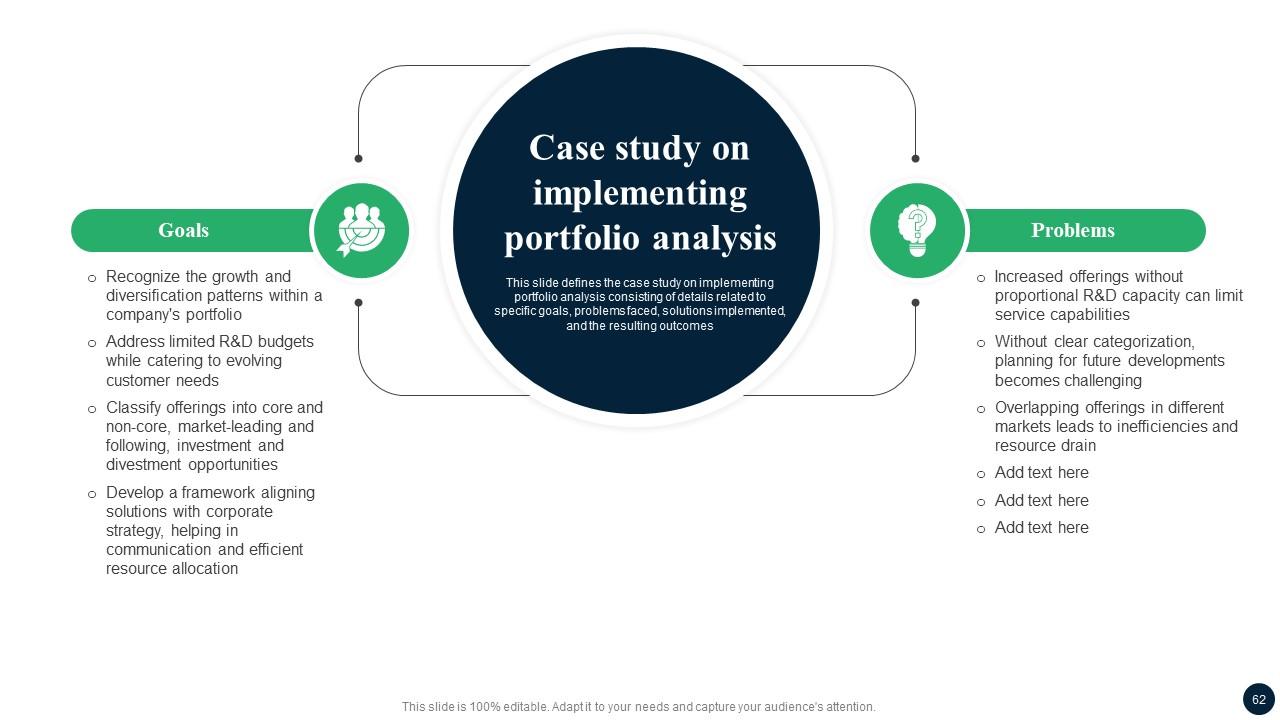
Slide 62: This slide defines the case study on implementing portfolio analysis consisting of details related to specific goals, problems faced, solutions implemented.
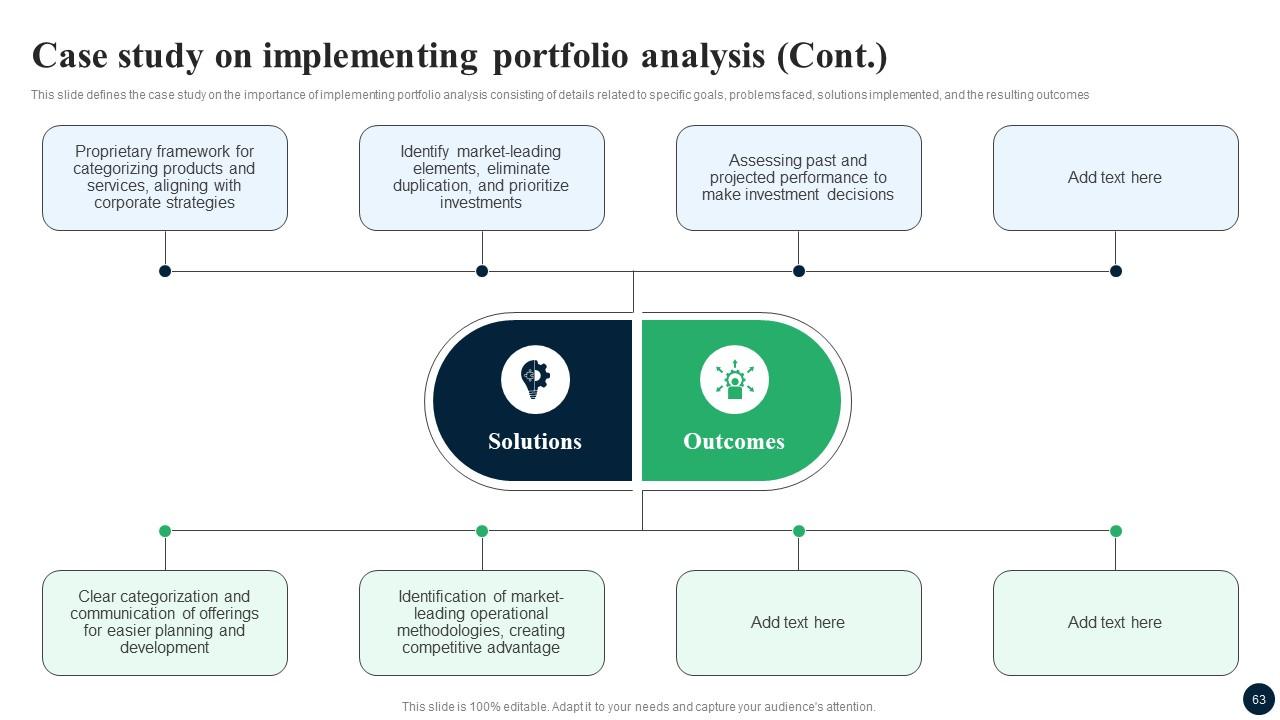
Slide 63: This slide defines the case study on the importance of implementing portfolio analysis consisting of details related to specific goals, problems faced.
Slide 64: This slide shows all the icons included in the presentation.
Slide 65: This slide is titled as Additional Slides for moving forward.
Slide 66: This is Our Vision, Mission & Goal slide. Post your Visions, Missions, and Goals here.
Slide 67: This slide shows SWOT analysis describing- Strength, Weakness, Opportunity, and Threat.
Slide 68: This slide shows Post It Notes for reminders and deadlines. Post your important notes here.
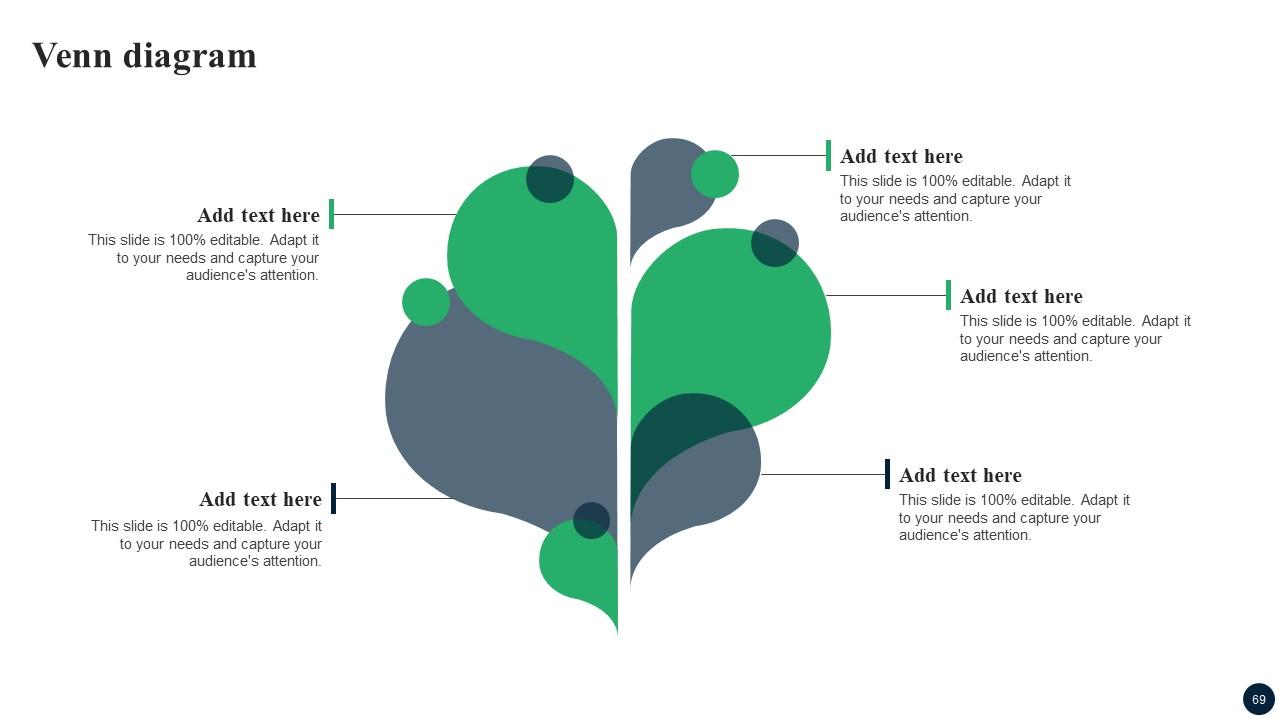
Slide 69: This slide depicts Venn diagram with text boxes.
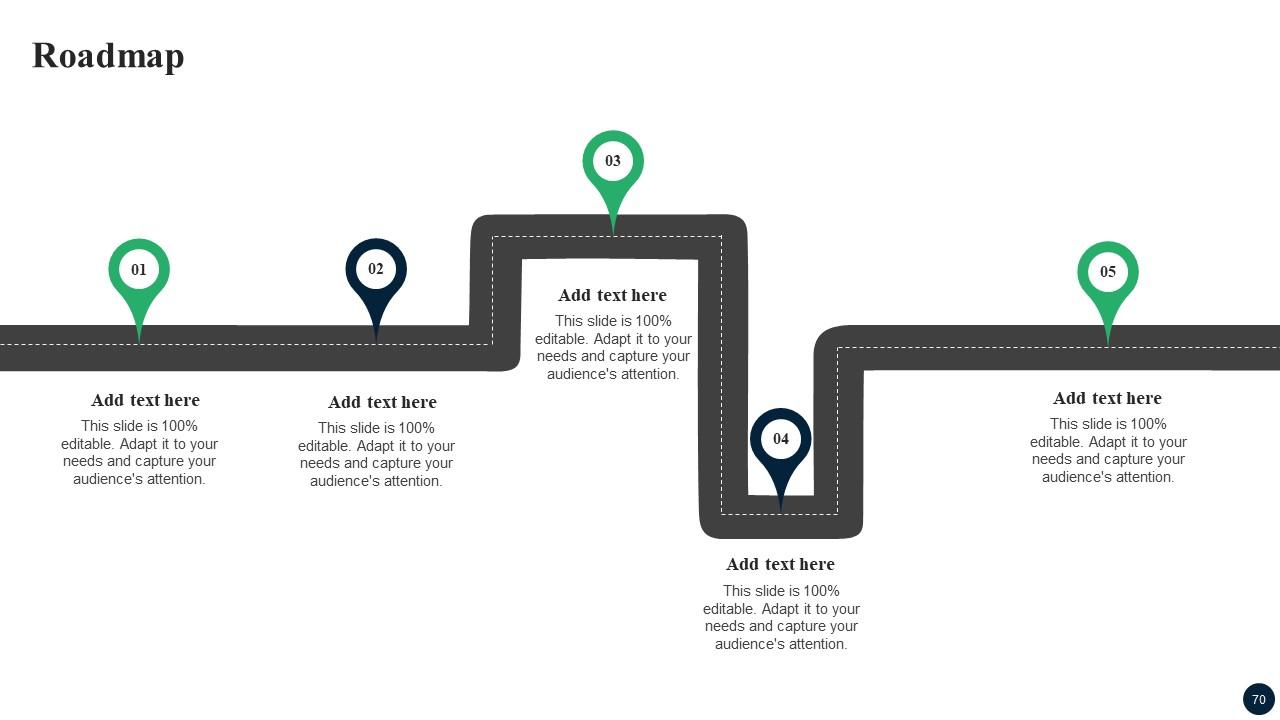
Slide 70: This slide presents Roadmap with additional textboxes. It can be used to present different series of events.
Slide 71: This is a Thank You slide with address, contact numbers and email address.
Enhancing Decision Making Through Portfolio Analysis Fin CD with all 80 slides:
Use our Enhancing Decision Making Through Portfolio Analysis Fin CD to effectively help you save your valuable time. They are readymade to fit into any presentation structure.
-
They helped us design the pamphlets for our church’s food drive! The people loved the design, and I’m happy to say it was successful. Thank you, SlideTeam!
-
The templates are handy and I can personalize them as per my needs. Glad to be your subscriber!


