

Forecast Model Powerpoint Presentation Slides




Try Before you Buy Download Free Sample Product
 Impress Your
 Audience
 100%
100% Editable
 Save Hours
 of Time


Predictive analytics holds applicability and value across a wide range of industries. Explore our efficiently designed Forecast Model PowerPoint Presentation that provides a concise understanding of predictive analytics. This approach utilizes statistical techniques, machine learning algorithms, and other tools to analyze historical data and make predictions about future events or outcomes. Within our Predictive Analytics deck, we cover the introduction to predictive analytics, its framework, and the various models employed. Additionally, our Estimation Model PPT showcases different predictive analytics tools and their workflow. Our Forecast Model PPT delves into multiple predictive analytics models. It also sheds light on prominent business sectors that have already embraced predictive analytics in their day-to-day operations, including healthcare, banking, finance, and more. Moreover, our Prospective Analysis module includes a training program and a budgetary framework for developing a predictive analytics model. Finally, we provide a checklist, timeline, and roadmap for deploying a predictive analytics model, accompanied by a performance tracking dashboard. Take advantage of this opportunity now to access our comprehensive and customizable template on Predictive Analytics.
People who downloaded this PowerPoint presentation also viewed the following :
Content of this Powerpoint Presentation
Slide 1: This slide introduces Forecast Model. State your company name and begin.
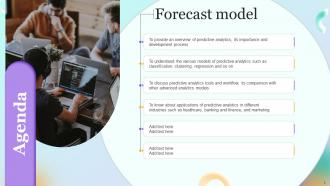
Slide 2: This is an Agenda slide. State your agendas here.
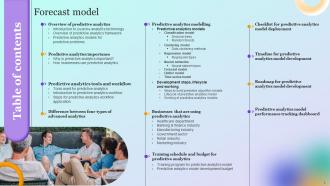
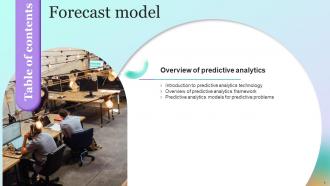
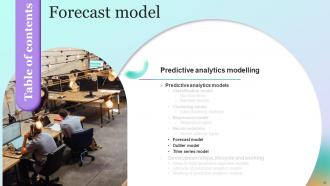
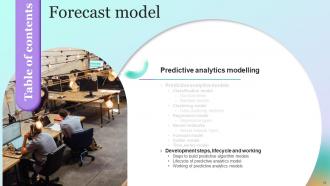
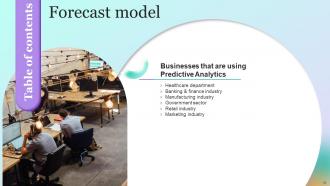
Slide 3: This slide shows Table of Content for the presentation.
Slide 4: This slide shows title for topics that are to be covered next in the template.
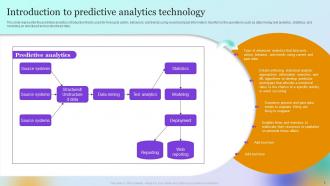
Slide 5: This slide represents the predictive analytics introduction.
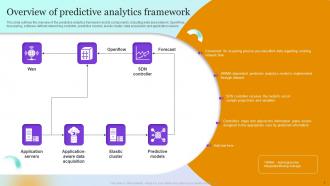
Slide 6: This slide outlines the overview of the predictive analytics framework and its components.
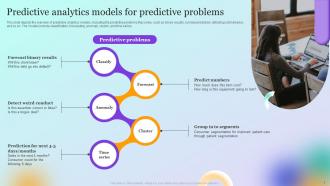
Slide 7: This slide depicts the overview of predictive analytics models.
Slide 8: This slide shows title for topics that are to be covered next in the template.
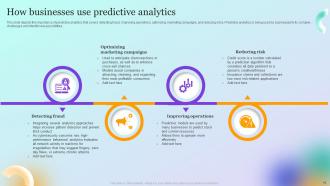
Slide 9: This slide depicts the importance of predictive analytics in different industries.
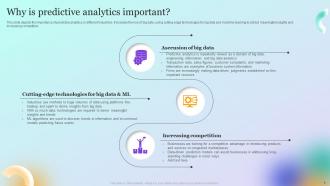
Slide 10: This slide describes the importance of predictive analytics.
Slide 11: This slide shows title for topics that are to be covered next in the template.
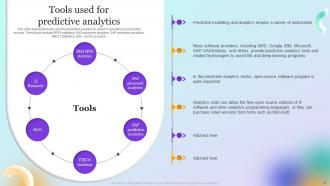
Slide 12: This slide depicts the tools used for predictive analytics to perform operations in predictive models.
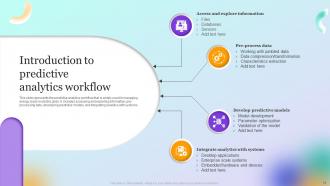
Slide 13: This slide represents the predictive analytics workflow that is widely used in managing energy loads in electric grids.
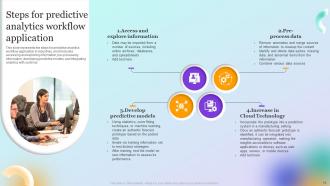
Slide 14: This slide presents the steps for predictive analytics workflow application in industries.
Slide 15: This slide shows title for topics that are to be covered next in the template.
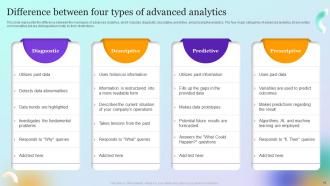
Slide 16: This slide presents the difference between the main types of advanced analytics.
Slide 17: This slide shows title for topics that are to be covered next in the template.
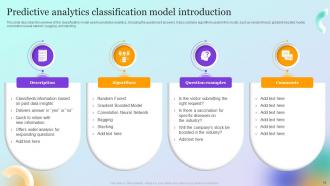
Slide 18: This slide describes the overview of the classification model used in predictive analytics.
Slide 19: This slide depicts the decision tree model of predictive analytics that are beneficial for quick decision-making.
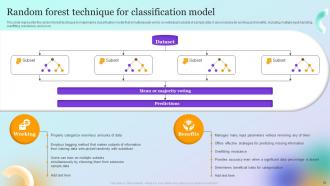
Slide 20: This slide presents the random forest technique to implement a classification model.
Slide 21: This slide shows title for topics that are to be covered next in the template.
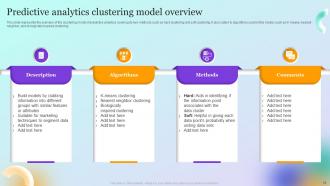
Slide 22: This slide presents the overview of the clustering model of predictive analytics covering.
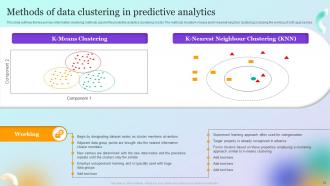
Slide 23: This slide outlines the two primary information clustering methods used in the predictive analytics clustering model.
Slide 24: This slide shows title for topics that are to be covered next in the template.
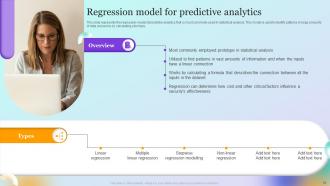
Slide 25: This slide presents the regression model of predictive analytics that is most commonly used in statistical analysis.
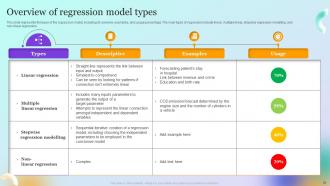
Slide 26: This slide describes the types of the regression model, including its overview, examples, and usage percentage.
Slide 27: This slide shows title for topics that are to be covered next in the template.
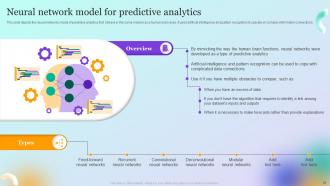
Slide 28: This slide depicts the neural networks model of predictive analytics.
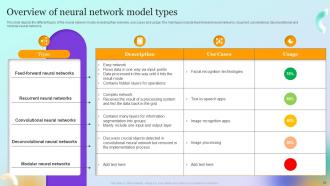
Slide 29: This slide presents different types of the neural network model.
Slide 30: This slide shows title for topics that are to be covered next in the template.
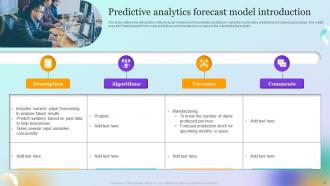
Slide 31: This slide outlines the introduction of the forecast model used for predictive analytics.
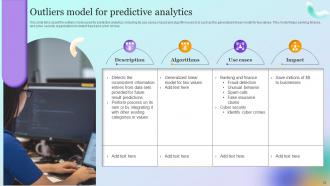
Slide 32: This slide describes the outliers model used for predictive analytics.
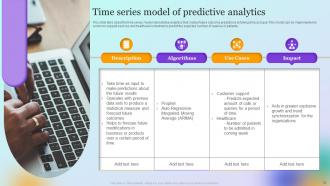
Slide 33: This slide presents the time series model of predictive analytics that makes future outcome predictions by taking time as input.
Slide 34: This slide shows title for topics that are to be covered next in the template.
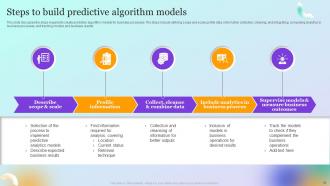
Slide 35: This slide discusses the steps required to create predictive algorithm models for business processes.
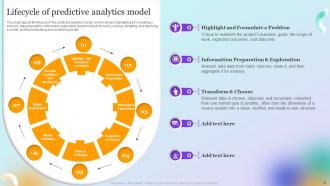
Slide 36: This slide depicts the lifecycle of the predictive analytics model.
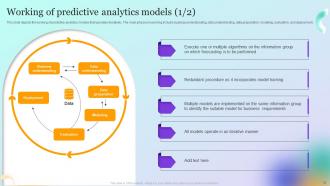
Slide 37: This slide presents the working of predictive analytics models that operates iteratively.
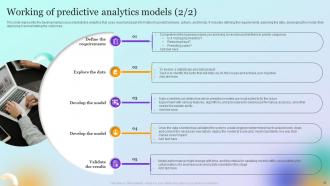
Slide 38: This is another slide presenting the working of predictive analytics models that operates iteratively.
Slide 39: This slide shows title for topics that are to be covered next in the template.
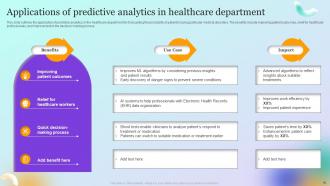
Slide 40: This slide outlines the application of predictive analytics in the healthcare department.
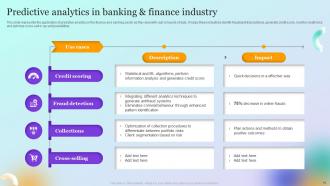
Slide 41: This slide presents the application of predictive analytics in the finance and banking sector.
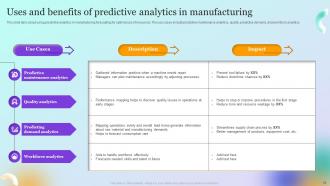
Slide 42: This slide presents predictive analytics in manufacturing forecasting for optimal use of resources.
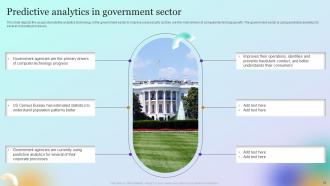
Slide 43: This slide depicts the usage of predictive analytics technology in the government sector.
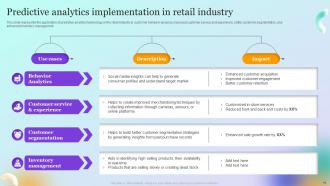
Slide 44: This slide presents the application of predictive analytics technology in the retail industry.
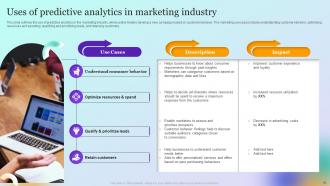
Slide 45: This slide outlines the use of predictive analytics in the marketing industry.
Slide 46: This slide shows title for topics that are to be covered next in the template.
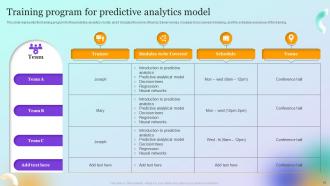
Slide 47: This slide represents the training program for the predictive analytics model.
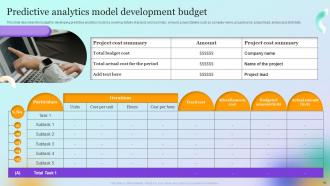
Slide 48: This slide describes the budget for developing predictive analytics model.
Slide 49: This slide shows title for topics that are to be covered next in the template.
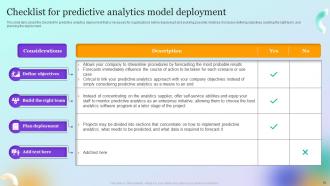
Slide 50: This slide describes the checklist for predictive analytics deployment.
Slide 51: This slide shows title for topics that are to be covered next in the template.
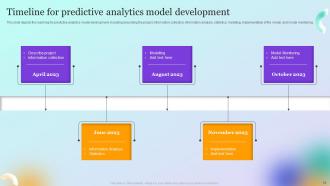
Slide 52: This slide depicts the roadmap for predictive analytics model development.
Slide 53: This slide shows title for topics that are to be covered next in the template.
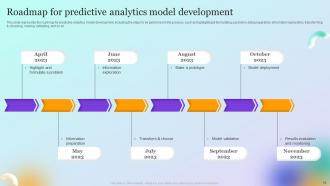
Slide 54: This slide presents the roadmap for predictive analytics model development.
Slide 55: This slide shows title for topics that are to be covered next in the template.
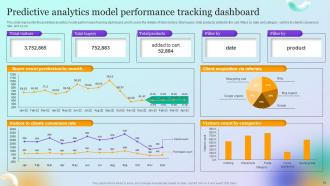
Slide 56: This slide presents the predictive analytics model performance tracking dashboard.
Slide 57: This slide shows all the icons included in the presentation.
Slide 58: This slide is titled as Additional Slides for moving forward.
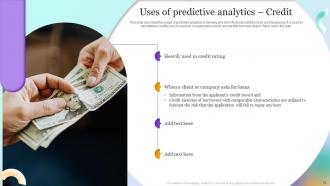
Slide 59: This slide describes the usage of predictive analytics in banking and other financial institutions for credit purposes.
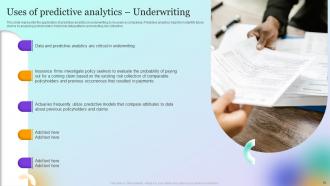
Slide 60: This slide presents the application of predictive analytics in underwriting by insurance companies.
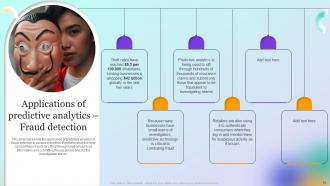
Slide 61: This slide displays the application of predictive analytics in fraud detection in various industries.
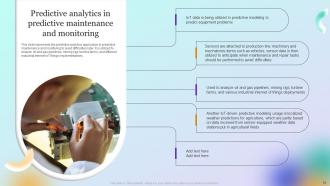
Slide 62: This slide presents the predictive analytics application in predictive maintenance and monitoring to avoid difficulties later.
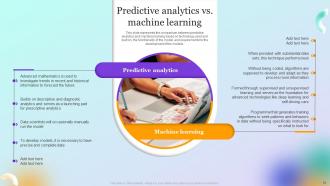
Slide 63: This slide shows the comparison between predictive analytics and machine learning.
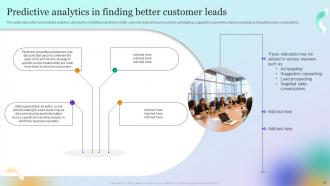
Slide 64: This slide presents how predictive analytics can help the marketing industry find better customer leads.
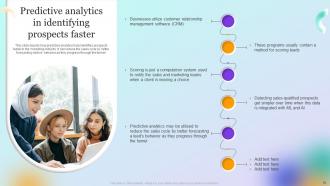
Slide 65: This slide depicts how predictive analytics help identifies prospects faster in the marketing industry.
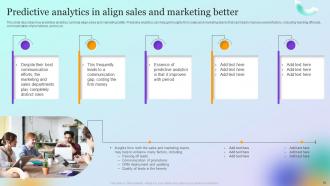
Slide 66: This slide describes how predictive analytics can help align sales and marketing better.
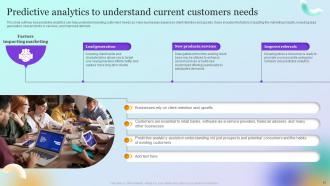
Slide 67: This slide outlines how predictive analytics can help understand existing customers.
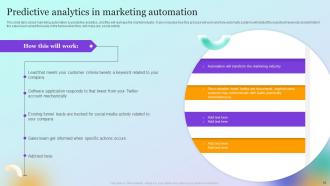
Slide 68: This slide presents marketing automation by predictive analytics.
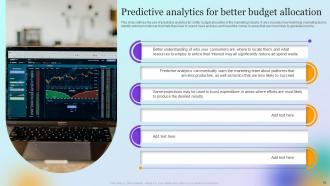
Slide 69: This slide outlines the use of predictive analytics for better budget allocation in the marketing industry.
Slide 70: This slide presents Roadmap with additional textboxes.
Slide 71: This slide depicts Venn diagram with text boxes.
Slide 72: This slide shows Post It Notes for reminders and deadlines. Post your important notes here.
Slide 73: This is an Idea Generation slide to state a new idea or highlight information, specifications etc.
Slide 74: This is About Us slide to show company specifications etc.
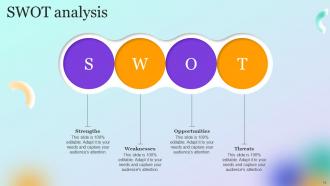
Slide 75: This slide shows SWOT analysis describing- Strength, Weakness, Opportunity, and Threat.
Slide 77: This is a Thank You slide with address, contact numbers and email address.
Forecast Model Powerpoint Presentation Slides with all 82 slides:
Use our Forecast Model Powerpoint Presentation Slides to effectively help you save your valuable time. They are readymade to fit into any presentation structure.








FAQs for Forecast Model
So there are basically three main ways people try to predict markets. Technical analysis uses charts and patterns - moving averages, that stuff. Then you've got fundamental analysis which looks at actual company numbers and economic data. Quantitative models are the fancy math approach - time series, machine learning, whatever. Oh and sentiment analysis is big now too, tracking what people are saying on social media. Here's the thing though - most traders I know claim they only use one method but they're totally lying lol. Technical's great for quick trades, fundamental works better long-term. I'd start simple with basic indicators and ratios, then get fancy later.
So ML is basically traditional forecasting on steroids - it finds patterns you'd never catch yourself. ARIMA and those classic models are solid for straightforward trends, but ML crushes the weird non-linear stuff and seasonal weirdness that makes forecasting such a headache. The cool part? It can juggle tons of variables at once - weather, holidays, economic data, all that chaos interacting with your sales numbers. Your forecasts actually get better over time as more data flows in. Honestly, I'd start with random forests before diving into deep learning - that stuff gets complicated fast.
Look, historical data is literally everything for forecasting - otherwise you're just throwing darts blindfolded. Quality data helps your model spot patterns and seasonal stuff that'll probably happen again. But here's the thing - I've watched people hoard like 20 years of data when it's totally unnecessary. What matters is having enough clean, relevant info that actually matches what you're predicting. If your company pivoted hard two years back, that ancient data might screw you over. Focus on getting your recent data rock solid first. The rest? Don't stress about it yet.
Your old forecasting models are basically useless now - weather's gone completely nuts. Heat waves destroy crops but spike demand for cooling stuff like leafy greens. Droughts and floods hit when you least expect them. Honestly, relying on historical data feels like predicting the future with a magic 8-ball at this point. You've gotta start watching real-time weather and climate projections instead. Track temps and rainfall in your main growing areas. That way you'll actually see supply chain disasters coming before they wreck your numbers.
So quantitative forecasting is basically using hard numbers and math models - like looking at past sales data to predict future trends. Qualitative is more about expert opinions and surveys, especially when you don't have solid historical data yet. Honestly? Most people I know pick one side and stick with it, which is kinda dumb. You'll get way better results mixing both approaches. Use the numbers as your starting point, then add in expert insights to catch stuff your data misses. Quick test: do you actually have reliable past data for what you're forecasting?
Oh man, seasonal trends will totally save your butt with inventory planning. Look at 2-3 years of past data to spot the patterns - holiday rushes, back-to-school madness, weather shifts. We got crushed last Christmas because I thought "how crazy could it get?" Wrong move. Different product categories have their own weird rhythms too, so don't just look at overall numbers. Map out your obvious busy periods first, then work backwards. Trust me, this stuff makes a huge difference once you get the hang of it.
Look, forecasting is huge for predicting what customers actually want so you're not stuck with dead inventory or empty shelves. Historical sales data is your starting point - way better than guessing. You'll cut storage costs, keep suppliers happy with solid planning, and avoid those brutal rush orders that kill your budget. Timing becomes so much easier for production and orders. Seasonal patterns become obvious too, which honestly saves you from scrambling every holiday season. Even basic forecasting beats winging it completely. Your customers stay happy, costs drop, and you actually sleep at night.
Don't get trapped by old data - markets shift constantly. Personal bias will mess you up too. Simple models beat fancy ones most of the time, trust me on this. I've watched teams burn months on complex algorithms that sucked compared to basic trend analysis. Update your forecasts regularly! Seasonality and economic changes matter way more than people think. Oh, and never give single numbers - always use ranges so everyone knows how confident you actually are in the prediction. Stakeholders hate surprises but they'll respect honest uncertainty.
Honestly, forecasting is getting crazy good right now. Machine learning can crunch through data that would take us weeks in like minutes. The patterns it finds? We'd probably miss half of them. You don't need fancy equipment anymore either - everything runs in the cloud now. Real-time predictions are becoming standard, which still blows my mind a bit. What's cool is these platforms are way more user-friendly than before. No statistics degree required. I'd mess around with some of the newer tools if I were you - might as well get familiar before everyone else catches on.
For continuous stuff, go with MAE and RMSE - MAE's super easy to understand, RMSE hits big errors harder. MAPE's solid too if you need percentages. Classification? Stick with accuracy, precision, recall. Honestly though, I've watched people get way too hung up on like 8 different metrics and completely lose sight of what actually matters for their business. My take: just pick 2-3 that make sense for your situation and track those religiously. Way better than drowning yourself in numbers that don't really tell you anything useful.
So scenario planning is basically your backup for when regular forecasting falls flat. Most forecasts just assume trends keep going the same way, right? But scenarios make you think through "what if this whole thing goes sideways?" You're building out multiple possible futures instead of crossing your fingers on one. Honestly, it feels like overkill until you actually need it - then you're grateful you did the work. The cool part is testing your strategies against totally different conditions. Next time you're doing quarterly planning, try running it through 2-3 different scenarios first. Game changer.
Cultural stuff totally throws off forecasting in global markets. People in different places buy things differently - like, collectivist cultures won't adopt new products the same way individualist ones do. Holiday timing is huge too. Chinese New Year spending hits completely different months than Christmas, which seems obvious but companies mess this up constantly. Then you've got saving vs spending habits that vary wildly between cultures. Risk tolerance changes too. Honestly, you can't just take your US sales data, convert the currency, and call it a forecast. You need actual local people who get the cultural context built into your models.
Retail and manufacturing are huge winners here - retail because if you mess up inventory, you're either losing sales or drowning in markdowns. Energy companies need it for load balancing, finance uses it for risk stuff. Manufacturing depends on it for production scheduling, which honestly makes sense when you think about supply chains. But really, any industry dealing with high volume or perishable goods will see quick returns. Volatile demand patterns? Even better reason to invest. The forecasting models basically pay for themselves if you're doing resource allocation at scale.
Look, forecasting is basically your data-driven crystal ball for making better strategic decisions. You get insights into demand patterns, market shifts, resource needs - all that good stuff. Instead of guessing, your leadership team can actually see whether expanding makes sense, if that new product idea is worth it, or how to adjust budgets. Honestly, I've seen too many companies just wing it and regret it later. Just don't treat forecasts like gospel though - build in some wiggle room because real life loves to mess with your best-laid plans.
Forecasting's getting way more automated - AI models that learn and tweak predictions in real-time instead of that clunky batch processing we deal with now. Non-technical teams can finally build solid forecasts without needing a stats degree, which is honestly game-changing. Ensemble methods are everywhere now, mixing different algorithms together. Plus you get actual confidence scores so you know when your predictions might be trash. Oh, and uncertainty quantification is huge - can't believe we went so long without it. Start playing with automated tools now because manual tuning feels pretty outdated at this point. Trust me on this one.
-
Editable templates with innovative design and color combination.
-
One-stop solution for all presentation needs. Great products with easy customization.