Gartner data analytics ppt powerpoint presentation inspiration example cpb
Our Gartner Data Analytics Ppt Powerpoint Presentation Inspiration Example Cpb are explicit and effective. They combine clarity and concise expression.
You must be logged in to download this presentation.
PowerPoint presentation slides
Presenting this set of slides with name Gartner Data Analytics Ppt Powerpoint Presentation Inspiration Example Cpb. This is an editable Powerpoint seven stages graphic that deals with topics like Gartner Data Analytics to help convey your message better graphically. This product is a premium product available for immediate download and is 100 percent editable in Powerpoint. Download this now and use it in your presentations to impress your audience.
People who downloaded this PowerPoint presentation also viewed the following :
Content of this Powerpoint Presentation
Description:
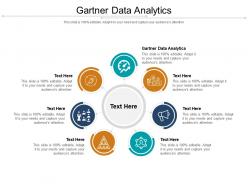
The provided image is a PowerPoint slide titled "Gartner Data Analytics," which serves as a versatile and customizable visual tool for presentations related to data analytics, business intelligence, and data-driven decision-making. The slide's central element is a circular diagram surrounded by six hexagonal icons, each representing a distinct aspect of data analytics or business intelligence. Below each icon, there is a placeholder for additional text, currently populated with indicative instructions: "Text Here / This slide is 100% editable. Adapt it to your needs and capture your audience's attention."
The slide's design underscores its adaptability to suit specific presentation requirements. The hexagonal icons, with their associated text placeholders, can be interpreted as focal points for discussion or as elements of a comprehensive data analytics framework, strategy, or outcome. The icons themselves represent various themes, including settings, targets, team dynamics, presentation, coding, and gears. These themes suggest a focus on customization, goal-setting, collaboration, reporting, technical processes, and workflows, respectively.
The overall design of the slide conveys a professional and corporate aesthetic, facilitating the clear and visually appealing communication of structured information.
Use Cases:
Here are use cases for seven industries where this slide can be effectively applied:
1. Consulting:
Use: Explaining data analytics services offered.
Presenter: Analyst or Consultant.
Audience: Business Clients.
2. Healthcare:
Use: Discussing data-driven patient care improvement strategies.
Presenter: Healthcare Administrator or Data Scientist.
Audience: Medical Staff or Healthcare Stakeholders.
3. Finance:
Use: Presenting market analytics and financial data insights.
Presenter: Financial Analyst or Data Officer.
Audience: Investors or Finance Professionals.
4. Retail:
Use: Outlining consumer behavior analytics and sales trends.
Presenter: Marketing Manager or Retail Data Analyst.
Audience: Sales Team or Retail Managers.
5. Education:
Use: Showcasing data on student performance and institutional metrics.
Presenter: Academic Researcher or Institutional Analyst.
Audience: Educators or Academic Administrators.
6. Technology:
Use: Introducing new data analysis tools or software updates.
Presenter: Product Manager or Software Developer.
Audience: Clients or End Users.
7. Manufacturing:
Use: Discussing production analytics and operational efficiency.
Presenter: Operations Manager or Process Engineer.
Audience: Plant Employees or Manufacturing Partners.
Gartner data analytics ppt powerpoint presentation inspiration example cpb with all 2 slides:
Give your audience a fulfilling experience. They will find our Gartner Data Analytics Ppt Powerpoint Presentation Inspiration Example Cpb elevating.
No Reviews


