Honda motor co ltd percentage of sales revenue by business 2018
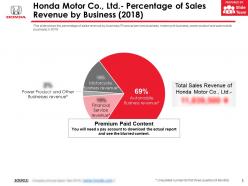
This slide shows the percentage of sales revenue by business Financial services business, motorcycle business, power product and automobile business in 2018.
You must be logged in to download this presentation.
PowerPoint presentation slides
This is a professionally designed visual chart for Honda Motor Co Ltd Percentage Of Sales Revenue By Business 2018. This is part of our Data and Statistics products selection, and you will need a Paid account to download the actual report with accurate data and sources. Downloaded report will contain the editable graph with accurate data, an excel table with the actual data, the exact source of the data and the release date. This slide shows the percentage of sales revenue by business Financial services business, motorcycle business, power product and automobile business in 2018. Download it immediately and use it for your business.
People who downloaded this PowerPoint presentation also viewed the following :
Content of this Powerpoint Presentation
Description:
The image is a PowerPoint slide illustrating the sales revenue breakdown of Honda Motor Co., Ltd. for the year 2018. The slide features a pie chart with three segments, each representing a different business revenue source for the company:
1. Automobile Business Revenue:
This is the largest segment, taking up 69% of the chart, indicating that the majority of Honda's revenue comes from automobile sales.
2. Motorcycle Business Revenue:
Represented as a smaller portion of the chart, but no specific percentage is provided.
3. Power Product and Other Businesses Revenue:
This is the smallest visible segment, and it is labeled with an asterisk indicating that the figure represents an unaudited number for the
first three quarters (9 months).
The total sales revenue figure for Honda Motor Co., Ltd. is blurred, with a note indicating "Premium Paid Content" and that a paid account is needed to download the actual report. The bottom of the slide mentions that the source of the data is the company's annual report and provides a URL (which is partially visible and ends with "honda.com/").
Use Cases:
This type of financial breakdown slide is used across various industries for financial reporting, investor relations, and strategic planning. Here are seven industries where similar slides could be employed:
1. Automotive:
Use: Presenting sales distribution across different product lines.
Presenter: Financial Analyst
Audience: Investors, company executives
2. Consumer Electronics:
Use: Showing revenue from various device categories.
Presenter: Chief Financial Officer
Audience: Shareholders, market analysts
3. Pharmaceuticals:
Use: Breaking down revenue by drug categories.
Presenter: Business Development Manager
Audience: Investors, pharmaceutical representatives
4. Energy:
Use: Illustrating income from different energy sources.
Presenter: Business Strategist
Audience: Stakeholders, policy makers
5. Technology:
Use: Demonstrating earnings from hardware, software, and services.
Presenter: Sales Director
Audience: Partners, technology analysts
6. Banking:
Use: Detailing income from various financial products.
Presenter: Chief Executive Officer
Audience: Investors, financial analysts
7. Retail:
Use: Displaying sales figures from different retail departments.
Presenter: Retail Manager
Audience: Department heads, marketing teams
Honda motor co ltd percentage of sales revenue by business 2018 with all 3 slides:
Our Honda Motor Co Ltd Percentage Of Sales Revenue By Business 2018 are given to achievement. They ensure that it is in the bag.
No Reviews


