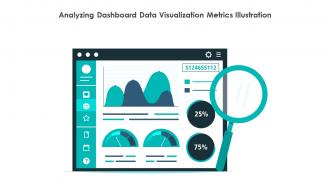
Analyzing Dashboard Data Visualization Metrics Illustration
This Analyzing dashboard data visualization metrics illustration is a 100 percent editable Illustration. The downloaded file will have this Illustration in EPS, PNG and Powerpoint pptx format and is perfect for your next project. It has a simple yet stylish design.
You must be logged in to download this presentation.
PowerPoint presentation slides
This colored PowerPoint icon is perfect for visualizing data and analyzing dashboard. It features a graph, charts, and other elements to help you track and analyze data quickly and easily. Perfect for presentations and reports.
People who downloaded this PowerPoint presentation also viewed the following :
Analyzing Dashboard Data Visualization Metrics Illustration with all 10 slides:
Use our Analyzing Dashboard Data Visualization Metrics Illustration to effectively help you save your valuable time. They are readymade to fit into any presentation structure.
-
This design is not only aesthetically pleasing but it has many uses making the cost worthwhile. The graphics look stunning, and you can edit them as per your needs.
-
The information is visually stunning and easy to understand, making it perfect for any business person. So I would highly recommend you purchase this PPT design now!


