Incident Management Service Level Agreement Metrics

Rating:
80%
Incident Management Service Level Agreement Metrics
Slide 1 of 9
Favourites Favourites

Try Before you Buy Download Free Sample Product

Audience Impress Your
Audience
Editable 100%
Editable
Time Save Hours
of Time
The Biggest Sale is ending soon in
0
0
:
0
0
:
0
0
Rating:
80%
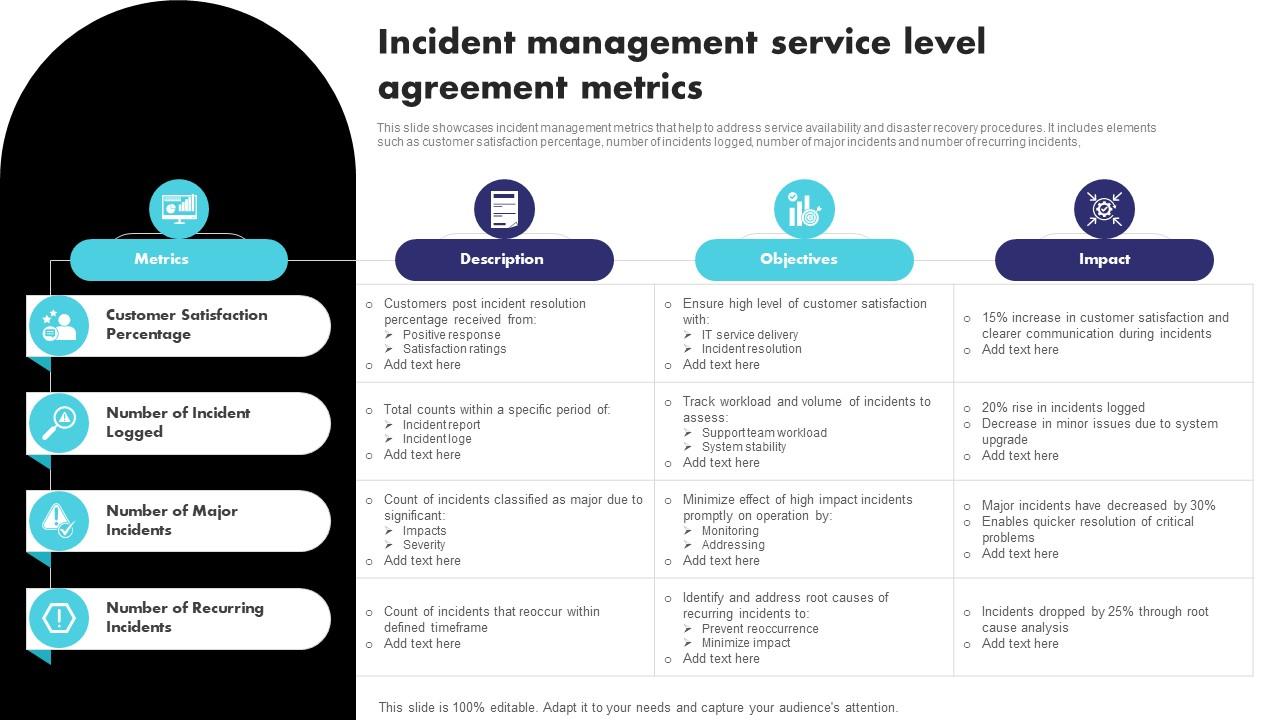
This slide showcases incident management metrics that help to address service availability and disaster recovery procedures. It includes elements such as customer satisfaction percentage, number of incidents logged, number of major incidents and number of recurring incidents, Introducing our Incident Management Service Level Agreement Metrics set of slides. The topics discussed in these slides are Incident, Percentage, Recurring. This is an immediately available PowerPoint presentation that can be conveniently customized. Download it and convince your audience.

FAQs for Incident Management Service

Key components of an Incident Management SLA include response time targets, resolution timeframes, escalation procedures, severity classifications, availability commitments, and communication protocols. These elements work together by establishing clear expectations, defining accountability structures, and ensuring consistent service delivery, with many organizations finding that well-structured SLAs significantly enhance customer satisfaction while streamlining operational efficiency.

Response time in incident management SLAs is measured by tracking the duration from initial incident detection or reporting to when support teams acknowledge and begin active resolution efforts. Organizations typically use automated monitoring tools and ticketing systems to capture timestamps, calculate response intervals across different severity levels, and generate performance dashboards, with many finding that consistent measurement enables faster service delivery and improved customer satisfaction.

User feedback and satisfaction serve as critical benchmarks for defining realistic SLA metrics, ensuring service levels align with actual user expectations and business needs. Through surveys, complaint analysis, and satisfaction scoring, organizations can calibrate response times, resolution targets, and quality standards that truly matter to end-users, ultimately delivering more meaningful service experiences and stronger stakeholder relationships.

SLA metrics significantly impact service quality by establishing clear performance standards, enabling proactive issue identification, and driving continuous improvement across operations. These measurements help organizations in sectors like banking, healthcare, and retail streamline response times, enhance customer satisfaction, and optimize resource allocation, ultimately delivering more reliable services and competitive advantage in increasingly demanding markets.

Organizations face challenges in adhering to incident management SLAs through resource constraints, inadequate escalation procedures, unclear priority classifications, and insufficient automation capabilities. These obstacles often result in delayed response times, inconsistent service delivery, and reduced customer satisfaction, with many enterprises finding that strategic investment in monitoring tools, staff training, and streamlined workflows ultimately delivers improved SLA compliance and competitive advantage.

Different industries define incident management SLAs based on their operational criticality, with financial services requiring sub-minute response times for trading systems, healthcare prioritizing patient safety with 15-minute critical alerts, and retail focusing on revenue-protecting 4-hour resolution targets. These sector-specific approaches enable organizations to align incident response with business impact, regulatory requirements, and customer expectations, ultimately delivering enhanced operational resilience and competitive advantage.

Setting realistic SLA targets involves analyzing historical performance data, understanding business priorities, considering resource constraints, and aligning expectations with stakeholder needs. Organizations should start with achievable baselines, incorporate buffer time for complex incidents, and regularly review metrics, with many IT departments finding that gradual target improvements maintain team morale while delivering measurable service enhancements.

Automation enhances incident management SLAs by accelerating detection, streamlining escalation workflows, and ensuring consistent response protocols across all severity levels. Through automated ticketing systems and intelligent routing, organizations minimize manual delays, reduce human error, and maintain precise SLA adherence, with many IT departments finding that automation delivers faster resolution times and improved customer satisfaction.

Prioritization in incident management SLAs ensures critical business functions receive immediate attention while optimizing resource allocation across varying severity levels. Through strategic priority classification, organizations streamline response times, minimize operational disruptions, and enhance customer satisfaction, with many enterprises finding that structured prioritization reduces downtime costs by 40% while improving overall service delivery efficiency.

Organizations should review and update their incident management SLAs quarterly or bi-annually, with additional reviews following major incidents, technology changes, or business expansions. Many companies find that regular assessments enable them to adjust response times, refine escalation procedures, and align metrics with evolving customer expectations, ultimately delivering improved service reliability and competitive advantage.

Organizations should track response time (time to acknowledge incidents), resolution time (time to fully resolve), escalation frequency, SLA breach rates, and mean time to recovery (MTTR). These metrics enable businesses to monitor service quality, identify bottlenecks in their incident workflows, and optimize resource allocation, with many IT departments finding that consistent tracking ultimately delivers improved customer satisfaction and operational efficiency.

Organizations effectively communicate SLA metrics to stakeholders through real-time dashboards, regular performance reports, automated alerts for threshold breaches, and executive summaries tailored to different audiences. By implementing visual analytics platforms and establishing clear escalation protocols, companies enhance transparency and accountability, with many finding that consistent metric sharing improves stakeholder confidence and enables faster incident resolution across teams.

Failing to meet incident management SLA targets results in diminished customer trust, potential financial penalties, reduced service credibility, and competitive disadvantage in the marketplace. Organizations often experience cascading effects including increased customer churn, damaged brand reputation, and strained client relationships, with many enterprises finding that consistent SLA failures ultimately compromise their market position and long-term business sustainability.

External factors like third-party vendors significantly impact incident management SLAs by introducing dependencies beyond direct organizational control, creating potential bottlenecks in resolution timeframes, and requiring coordinated response protocols. Many organizations address this through vendor SLA alignment, escalation procedures, and contingency planning, ultimately delivering more realistic incident resolution expectations while maintaining service quality standards.

**INPUT**: What tools or software are ideal for monitoring incident management SLA performance? **OUTPUT**: Ideal tools for monitoring incident management SLA performance include ServiceNow, Jira Service Management, PagerDuty, Freshservice, and Splunk IT Service Intelligence. These platforms streamline SLA tracking by automating escalations, providing real-time dashboards, and generating comprehensive reports, with many organizations finding that integrated monitoring ultimately delivers faster resolution times and enhanced operational transparency.

Ratings and Reviews

80% of 100
Review Form
Write a review
Most Relevant Reviews
  1. 80%

    by Smith Diaz

    Happy to incorporate such stunning templates in my presentation. Made my presentation look professional and engaging. 
  2. 80%

    by O'Kelly Phillips

    Fantastic collection of visually appealing PowerPoint templates. They certainly uplift the look of the presentation.

2 Item(s)

per page: