It demonstration powerpoint presentation slides
Understand the IT complexities and resolve those issues to provide better support for the business with the help of content-ready IT demonstration PowerPoint Presentation Slides. IT executives can get access to this IT demonstration PowerPoint presentation slideshow to deal with the IT complexities that disrupts the business outcomes. This deck covers topics like factors leading to IT complexities, levers of IT simplification, approaches to reduce complexities, IT simplification strategy, IT simplification roadmap, simplify processes and operating models, consolidate applications, automate and integrate, IT simplification benefits, and more. These templates are completely customizable. You can change the color, text, icon and font size as per your need. Add or remove the content from the presentation, if needed. Analyse the macro level changes, identify roadblocks, choose methodology, train, analyse, and deliver using IT demonstration PowerPoint templates. Remove as much IT complexity as possible without having any changes to the business functionality. Incorporate IT simplification PowerPoint templates to use it as a process to accomplish IT simplification. Download ready-made IT simplification PowerPoint presentation to have a more reliable, secure and cost-effective system. Enhance functional ability with our It Demonstration Powerpoint Presentation Slides. They come handy for career growth.
You must be logged in to download this presentation.
PowerPoint presentation slides
Presenting IT demonstration presentation slides. This deck consists of total of 43 PPT slides. Each slide comprises of professional visuals with an appropriate content. These templates have been designed keeping the requirements of the customers in mind. This complete presentation covers all the design elements such as layout, diagrams, icons, and more. This deck has been crafted after a thorough research. You can easily edit each template. Edit the colour, text, icon, and font size as per your requirement. Easy to download. Compatible with all screen types and monitors. Supports Google Slides. Premium Customer Support available.
People who downloaded this PowerPoint presentation also viewed the following :
Content of this Powerpoint Presentation
Slide 1: This slide introduces IT Demonstration. State Your Company Name and begin.
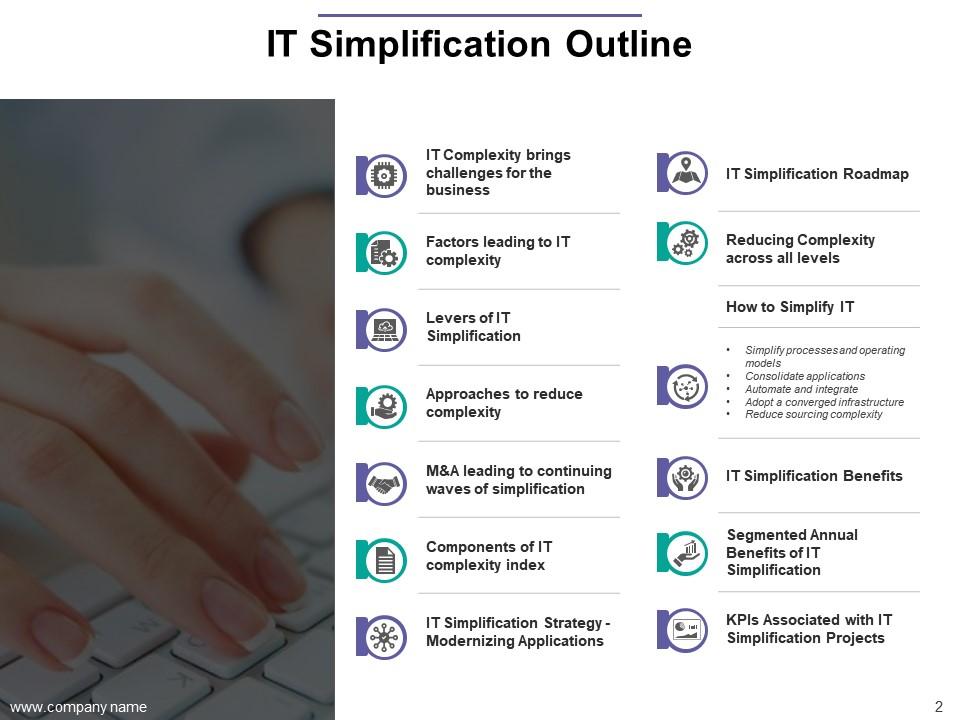
Slide 2: This slide showcases IT Simplification Outline. You can add the outline points if you want.
Slide 3: This slide shows IT Complexity Brings Challenges For the Business.
Slide 4: This slide presents Factors leading to IT complexity (1 of 2) with these three Corporate M&A Activity, Decentralization of the Business, Need to support greater Business Demands.
Slide 5: This slide showcases Factors leading to IT complexity (2 of 2) with these Continued use & Importance of Legacy systems, Disparate systems & standards, Supporting fast pace of change.
Slide 6: This slide presents Levers of IT Simplification with these factors- IT Demand Management, Application and Data Landscape, IT Infrastructure, IT Location and Sourcing Setup, IT Governance and Processes, IT Organisation and Workforce.
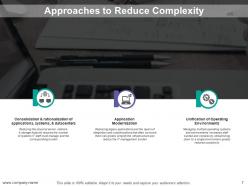
Slide 7: This slide showcases Approaches to Reduce Complexity with these three of the fatcors- Consolidation & rationalization of applications, systems, & datacenters, Application Modernization, Unification of Operating Environments.
Slide 8: This slide presents M&A Leading to Continuing Waves of Simplification having these four factors- Corporate M&A, Multiple Apps, Systems, and Datacenters, “Simplified” Business Operations, Rationalization and Consolidation.
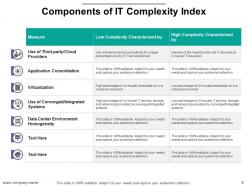
Slide 9: This slide showcases Components of IT Complexity Index table.
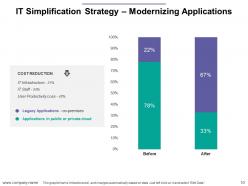
Slide 10: This slide shows IT Simplification Strategy – Modernizing Applications.
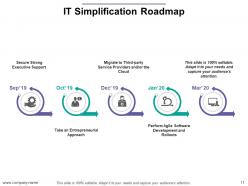
Slide 11: This slide presents IT Simplification Roadmap with these four factors- Take an Entrepreneurial Approach, Perform Agile Software Development and Rollouts, Secure Strong Executive Support, Migrate to Third-party Service Providers and/or the Cloud.
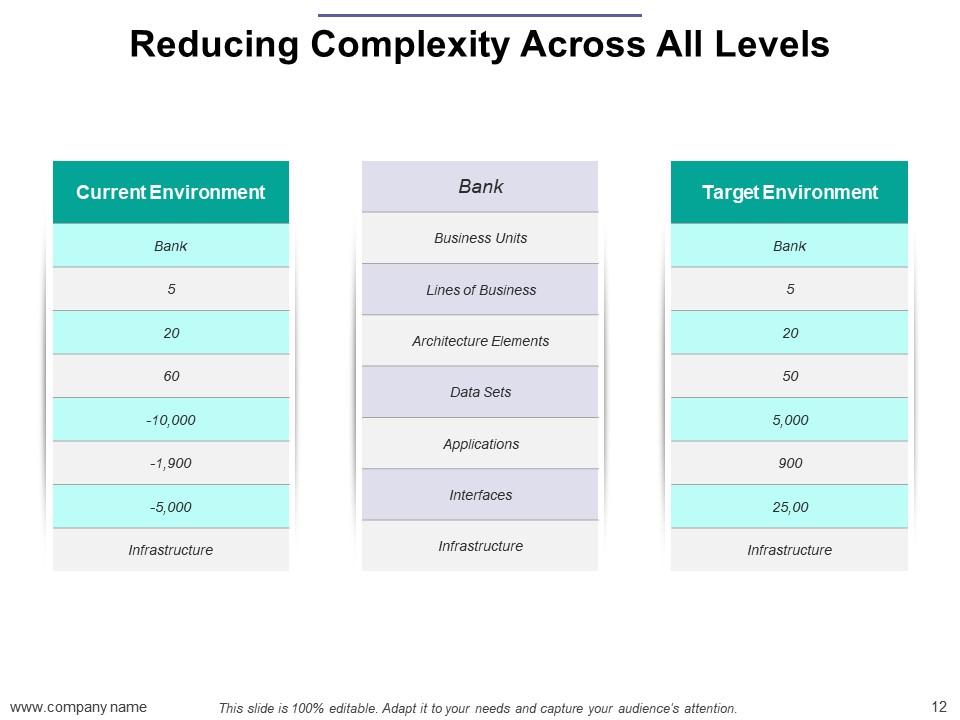
Slide 12: This slide showcases Reducing Complexity Across All Levels.
Slide 13: This slide presents How to Simplify IT with an imagery background.
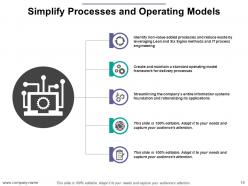
Slide 14: This slide showcases Simplify Processes and Operating Models which further.
Slide 15: This slide presents Consolidate Applications. You can use it for the addition of the applications.
Slide 16: This slide showcases Automate and Integrate.
Slide 17: This slide presents Adopt a Converged Infrastructure. Minimize compatibility issues between servers, storage systems and network devices by unifying infrastructure solutions.
Slide 18: This slide showcases Reduce Sourcing Complexity. We have listed four of the parameters.
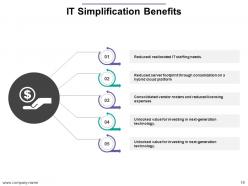
Slide 19: This slide presents IT Simplification Benefits with these four of the important we have noted- Reduced/ reallocated IT staffing needs, Reduced server footprint through consolidation on a hybrid cloud platform, Consolidated vendor rosters and reduced licensing expenses, Unlocked value for investing in next-generation technology.
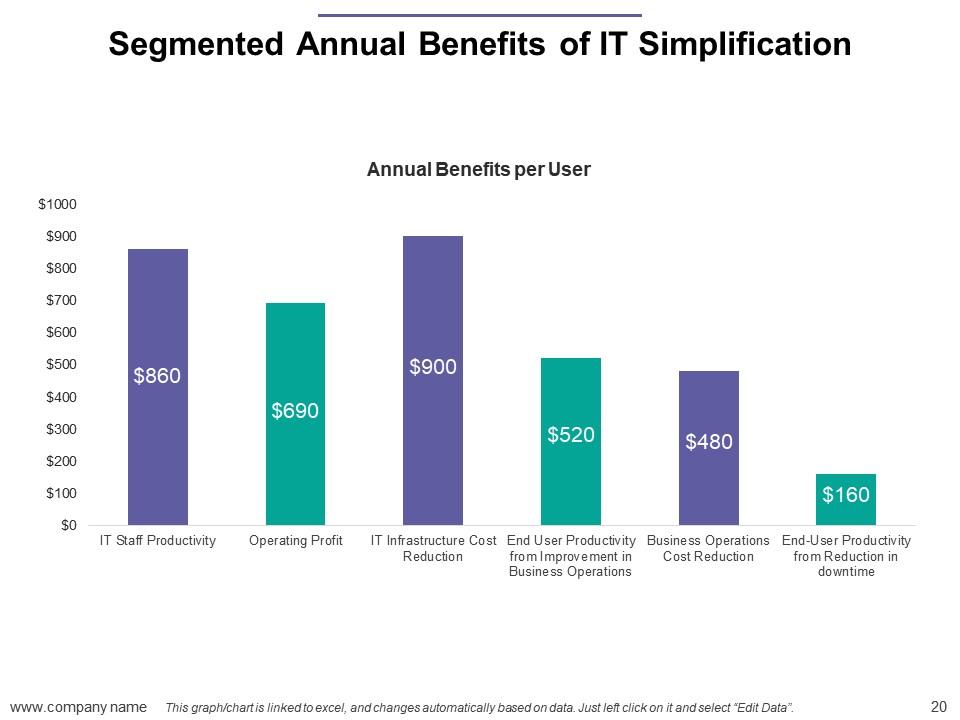
Slide 20: This slide presents Segmented Annual Benefits of IT Simplification.
Slide 21: This slide showcases KPIs associated with IT Simplification Projects.
Slide 22: This slide shows IT Demonstration Icon Slide.
Slide 23: This slide shows Coffee Break image.
Slide 24: This slide is titled Additional slides to proceed forward.
Slide 25: This slide showcases Clustered Bar.
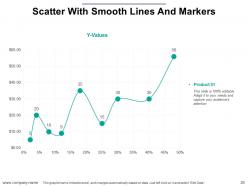
Slide 26: This slide presents Scatter With Smooth Lines And Markers.
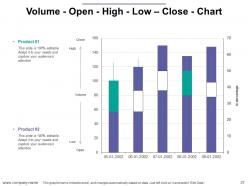
Slide 27: This slide showcases Volume - Open - High - Low – Close - Chart with which you can make the changes and use it.
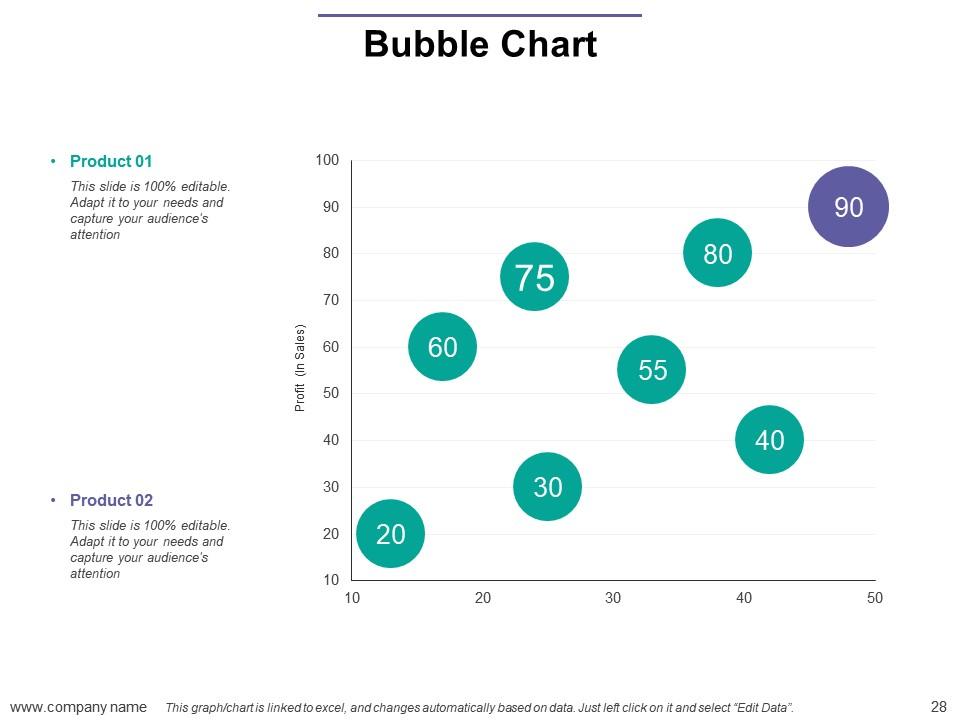
Slide 28: This slide preseents Bubble chart and use it accordingly.
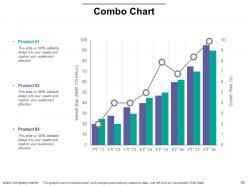
Slide 29: This slide showcases Combo Chart with which you can add for comparing.
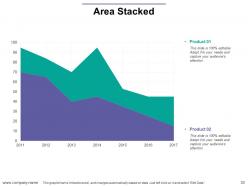
Slide 30: This slide shows Area Stacked. Add your own data and use it.
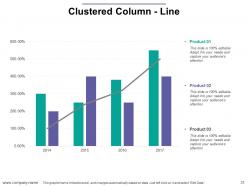
Slide 31: This slide presents Clustered Column - Line with which you can use it.
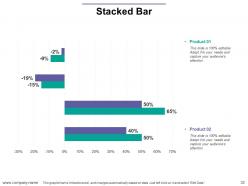
Slide 32: This slide shows a Stacked bar graph in terms of percentage and years for comparison of Product 01, Product 02, Product 03 etc.
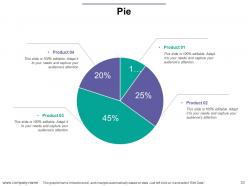
Slide 33: This slide presents Pie chart. Use this for the comparing.
Slide 34: This slide represents Our Mission. State your mission, goals etc.
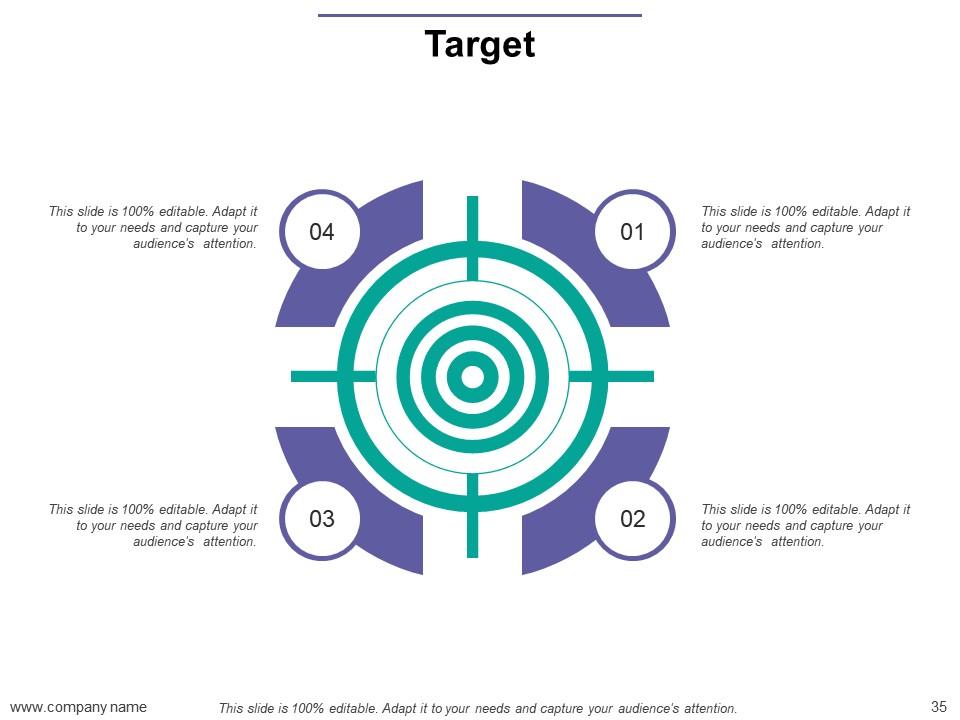
Slide 35: This slide displays Our Target with a background image.
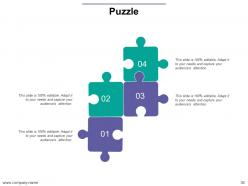
Slide 36: This is a Puzzle slide with the following subheadings- PPC Advertising, Media Marketing, Print Marketing, E-mail Campaigns.
Slide 37: This slide helps depict Our Team with text boxes.
Slide 38: This slide displays a Venn diagram image.
Slide 39: This is an Our Goal slide. State your important goals here.
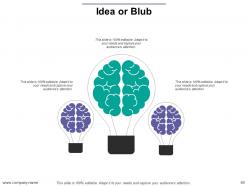
Slide 40: This is a Bulb or Idea slide to state a new idea or highlight specifications/information etc.
Slide 41: This slide shows Vital financial circles with percentage and text boxes.
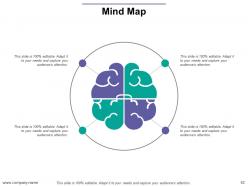
Slide 42: This slide presents a Mind map with text boxes
Slide 43: This is a Thank You slide with image
It demonstration powerpoint presentation slides with all 43 slides:
Folks feel driven to heed your ideas due to our It Demonstration Powerpoint Presentation Slides. It empowers you to command attention.
No Reviews


