KPIs To Track Variance Between Actual Budgeting Process For Financial Wellness Fin SS
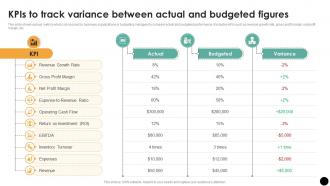
This slide shows various metrics which can be used by business organizations or budgeting managers to compare actual and budgeted performance. It includes KPIs such as revenue growth rate, gross profit margin, net profit margin, etc.
You must be logged in to download this presentation.
PowerPoint presentation slides
This slide shows various metrics which can be used by business organizations or budgeting managers to compare actual and budgeted performance. It includes KPIs such as revenue growth rate, gross profit margin, net profit margin, etc. Present the topic in a bit more detail with this KPIs To Track Variance Between Actual Budgeting Process For Financial Wellness Fin SS. Use it as a tool for discussion and navigation on Gross Profit Margin, Revenue Growth Rate, Net Profit Margin. This template is free to edit as deemed fit for your organization. Therefore download it now.
People who downloaded this PowerPoint presentation also viewed the following :
KPIs To Track Variance Between Actual Budgeting Process For Financial Wellness Fin SS with all 10 slides:
Use our KPIs To Track Variance Between Actual Budgeting Process For Financial Wellness Fin SS to effectively help you save your valuable time. They are readymade to fit into any presentation structure.
-
Extremely professional slides with attractive designs. I especially appreciate how easily they can be modified and come in different colors, shapes, and sizes!
-
Best Representation of topics, really appreciable.


