Loss Functions In Deep Learning Training Ppt
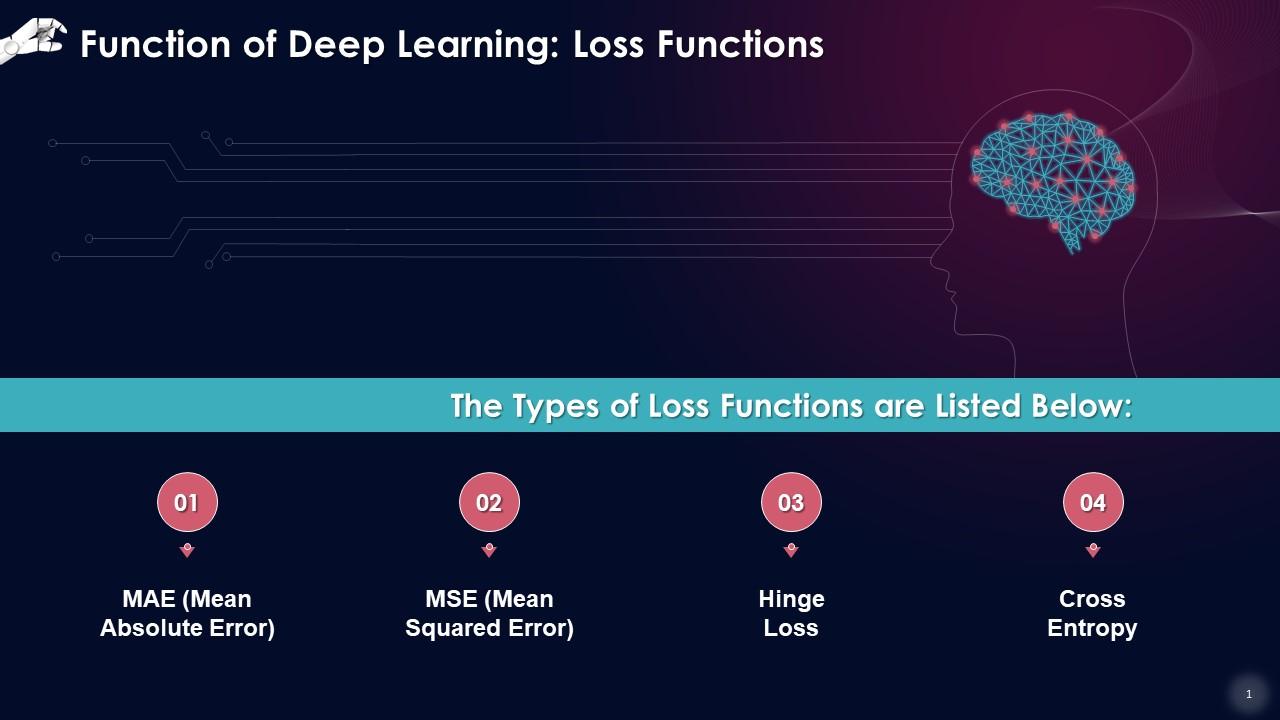
This set of slides informs about the types of Loss Functions as a component of Deep Learning. These include Mean Absolute Error, Mean Squared Error, Hinge Loss, and Cross-entropy.
This set of slides informs about the types of Loss Functions as a component of Deep Learning. These include Mean Absolute E..
- Google Slides is a new FREE Presentation software from Google.
- All our content is 100% compatible with Google Slides.
- Just download our designs, and upload them to Google Slides and they will work automatically.
- Amaze your audience with SlideTeam and Google Slides.
-
Want Changes to This PPT Slide? Check out our Presentation Design Services
- WideScreen Aspect ratio is becoming a very popular format. When you download this product, the downloaded ZIP will contain this product in both standard and widescreen format.
-

- Some older products that we have may only be in standard format, but they can easily be converted to widescreen.
- To do this, please open the SlideTeam product in Powerpoint, and go to
- Design ( On the top bar) -> Page Setup -> and select "On-screen Show (16:9)” in the drop down for "Slides Sized for".
- The slide or theme will change to widescreen, and all graphics will adjust automatically. You can similarly convert our content to any other desired screen aspect ratio.
Compatible With Google Slides

Get This In WideScreen
You must be logged in to download this presentation.
PowerPoint presentation slides
Presenting Core Functions of Deep Learning. These slides are 100 percent made in PowerPoint and are compatible with all screen types and monitors. They also support Google Slides. Premium Customer Support available. Suitable for use by managers, employees, and organizations. These slides are easily customizable. You can edit the color, text, icon, and font size to suit your requirements.
People who downloaded this PowerPoint presentation also viewed the following :
Content of this Powerpoint Presentation
Slide 1
This slide lists the types of loss functions as a component of Deep Learning. These include mean absolute error, mean squared error, hinge loss, and cross-entropy.
Slide 2
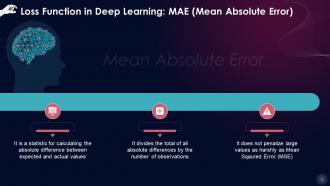
This slide states that mean absolute error is a statistic for calculating the absolute difference between expected and actual values. Divide the total of all absolute differences by the number of observations. It does not penalize large values as harshly as Mean Squared Error (MSE).
Slide 3
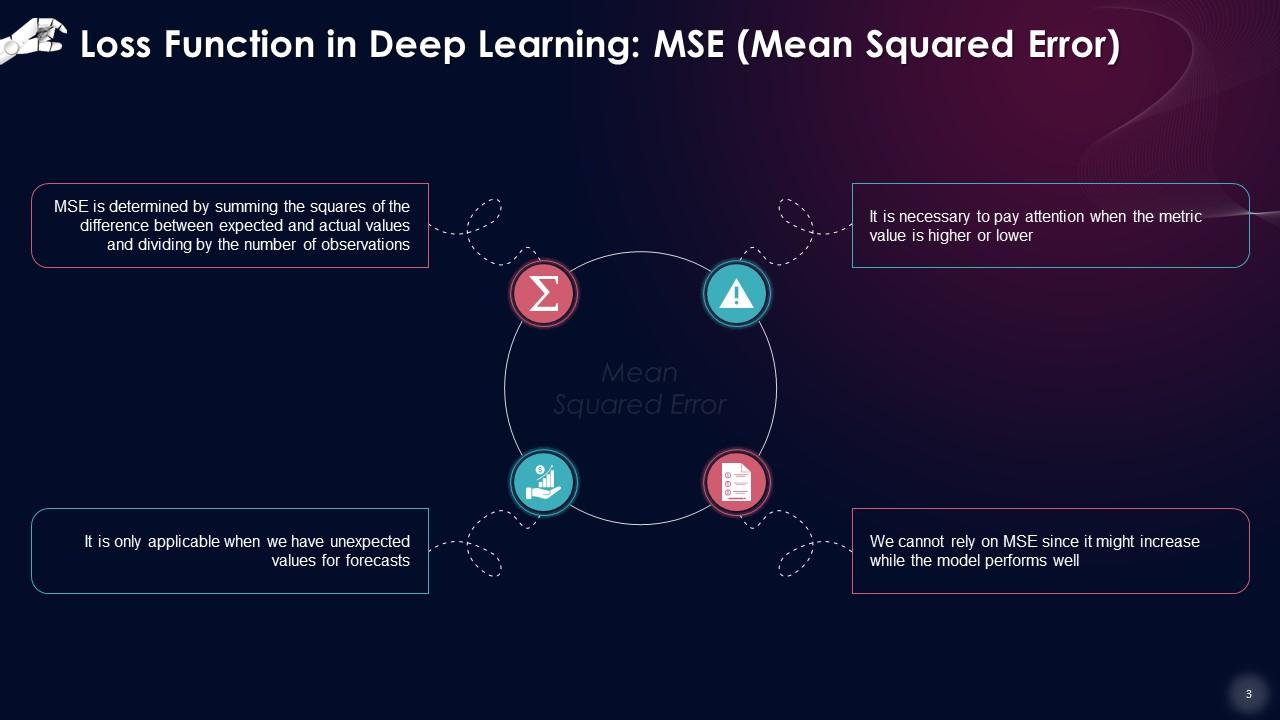
This slide describes that MSE is determined by summing the squares of the difference between expected and actual values and dividing by the number of observations. It is necessary to pay attention when the metric value is higher or lower. It is only applicable when we have unexpected values for forecasts. We cannot rely on MSE since it might increase while the model performs well.
Slide 4
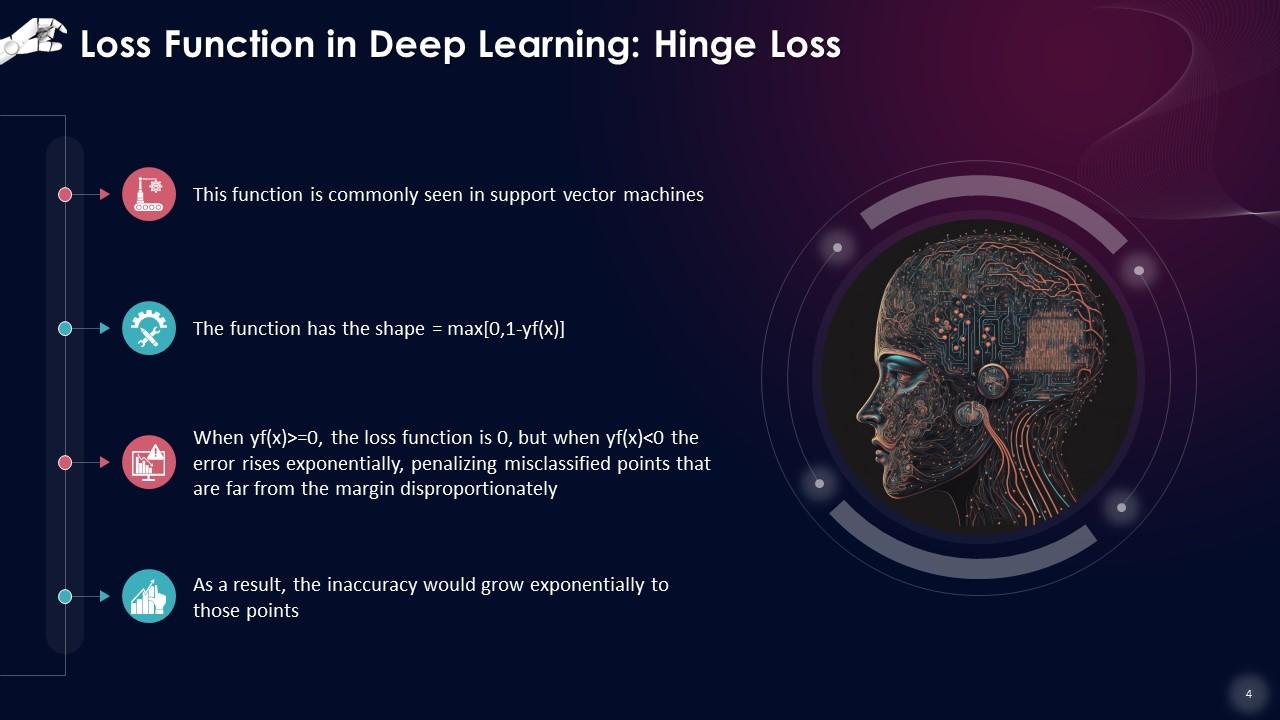
This slide explains that hinge loss function is commonly seen in support vector machines. The function has the shape = max[0,1-yf(x)]. When yf(x)>=0, the loss function is 0, but when yf(x)<0 the error rises exponentially, penalizing misclassified points that are far from the margin disproportionately. As a result, the inaccuracy would grow exponentially to those points.
Slide 5
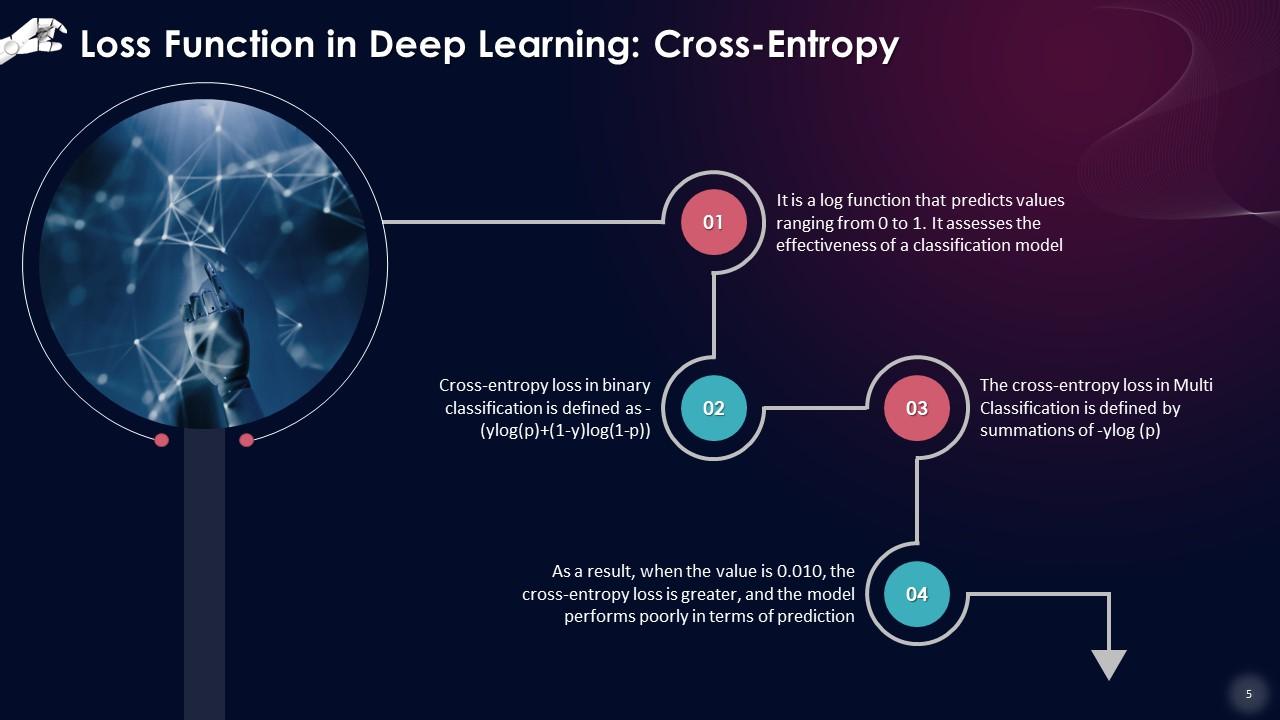
This slide states that cross-entropy is a log function that predicts values ranging from 0 to 1. It assesses the effectiveness of a classification model. As a result, when the value is 0.010, the cross-entropy loss is more significant, and the model performs poorly on prediction.
Loss Functions In Deep Learning Training Ppt with all 21 slides:
Use our Loss Functions In Deep Learning Training Ppt to effectively help you save your valuable time. They are readymade to fit into any presentation structure.
-
“Love it! I was able to grab an exciting proposal because of SlideTeam.”
-
Happy to found you SlideTeam. You guys are value for money. Amazing slides.


