Time Control Powerpoint Presentation Slides
Manage your work activities effectively with our content ready Time Control Powerpoint Presentation Slides. The effective time planning presentation deck has various professionally looking templates such as guiding principle of time & self-management, employee weekly time schedule, workload prioritization chart, ways to reduce employee travel time, time utilization analysis, communication plan checklist, detailed communication plan, sources of workplace stress & negative impacts, impact & avoidance of procrastination at workplace, importance of workplace breaks, criteria table, prioritizing workload & key tasks, assignment table, priority task table, employee timesheet, goals & tasks, competency team skills matrix, employee tasks status table, task-based recognition table, employee time management evaluation chart, employee weekly efficiency dashboard, labour effectiveness dashboard, employee efficiency status KPI, etc. You can utilize the same time analysis PowerPoint complete deck for topics like time value for money, opportunity cost, attention management, goal setting and so on. Outline time management strategies with these easily understandable PPT slides. Highlight the contribution of your ancestors with our Time Control Powerpoint Presentation Slides. Elaborate on your cultural heritage.
You must be logged in to download this presentation.
PowerPoint presentation slides
Presenting this set of slides with name - Time Control Powerpoint Presentation Slides. This presentation comprises a total of sixty-one slides. Each slide focuses on one of the aspects of Time Control Powerpoint Presentation Slides with content extensively researched by our business research team. When you download this presentation by clicking the Download button, you get the presentation in both standard and widescreen format. All slides are fully customizable. Change the colors, font, size, add and remove things as per your need and present before your audience.Download PowerPoint templates in both widescreen and standard screen. The presentation is fully supported by Google Slides. It can be easily converted into JPG or PDF format.
People who downloaded this PowerPoint presentation also viewed the following :
Content of this Powerpoint Presentation
Slide 1: This slide introduces Time Control. State Your company name and get started
Slide 2: This slide presents AGENDA.
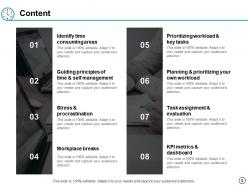
Slide 3: This slide shows Content with these of the following- Identify time consuming areas, Prioritizing workload & key tasks, Guiding principles of time & self management, Planning & prioritizing your own workload, Stress & procrastination, Task assignment & evaluation, Workplace breaks, KPI metrics & dashboard.
Slide 4: This slide showcases Identify Time Consuming Areas.
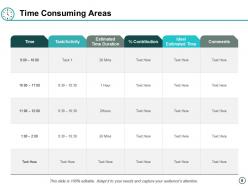
Slide 5: This slide shows Time Consuming Areas with these of the following- Time, Task/Activity, Estimated Time Duration, % Contribution, Ideal, Estimated Time, Comments.
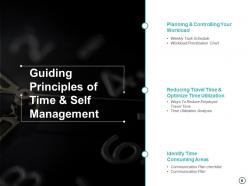
Slide 6: This slide presents Guiding Principles of Time & Self Management with these of the following- Weekly Task Schedule, Workload Prioritization Chart, Planning & Controlling Your Workload, Ways To Reduce Employee Travel Time, Time Utilization Analysis, Reducing Travel Time & Optimize Time Utilization, Communication Plan checklist, Communication Plan, Identify Time Consuming Areas.
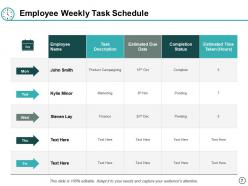
Slide 7: This slide showcases Employee Weekly Task Schedule.
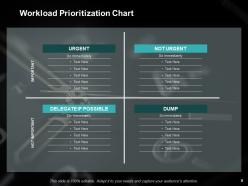
Slide 8: This slide Workload Prioritization Chart.
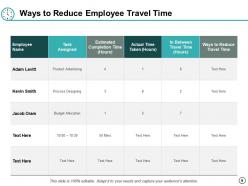
Slide 9: This slide showcases Ways to Reduce Employee Travel Time.
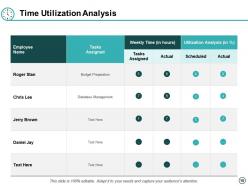
Slide 10: This slide presents Time Utilization Analysis.
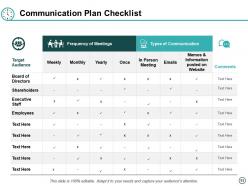
Slide 11: This slide shows Communication Plan Checklist.
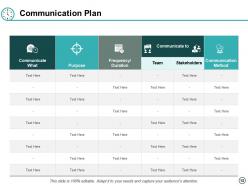
Slide 12: This slide presents Communication Plan.
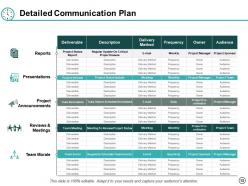
Slide 13: This slide showcases Detailed Communication Plan with these of the following factors and these of the following- Reports, Presentations, Project Announcements, Team Morale, Reviews & Meetings.
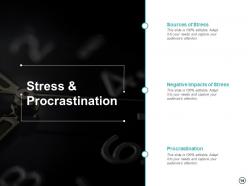
Slide 14: This slide presents Stress & Procrastination with these of the three- Sources of Stress, Negative Impacts of Stress, Procrastination.
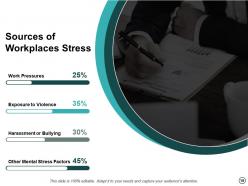
Slide 15: This slide showcases Sources of Workplaces Stress with these of the four basic factors- Work Pressures, Exposure to Violence, Harasment or Bullying, Other Mental Stress Factors.
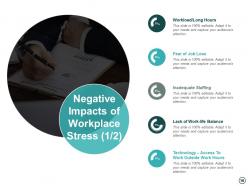
Slide 16: This slide presents Negative Impacts of Workplace Stress (1/2) with these of the following factors- Workload/Long Hours, Fear of Job Loss, Inadequate Staffing, Technology – Access To Work Outside Work Hours, Lack of Work-life Balance.
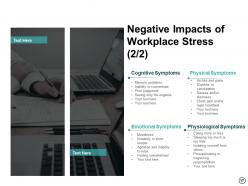
Slide 17: This slide presents Negative Impacts of Workplace Stress (2/2) with these of the four parameters- Cognitive Symptoms, Physical Symptoms, Emotional Symptoms, Physiological Symptoms.
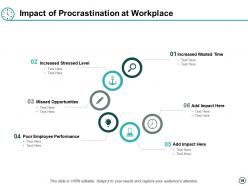
Slide 18: This slide shows Impact of Procrastination at Workplace with these of the following- Increased Wasted Time, Increased Stressed Level, Missed Opportunities, Poor Employee Performance.
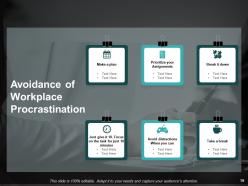
Slide 19: This slide presents Avoidance of Workplace Procrastination with these of the folloeing major factors- Avoid distractions, When you can, Prioritize your, Assignments, Break it down, Make a plan.
Slide 20: This slide showcases Workplace Break with these of the two main areas- Importance of Breaks, Workplace Breaks Criteria Table.
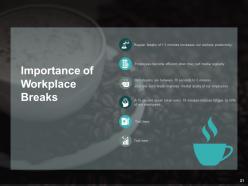
Slide 21: This slide presents Importance of Workplace Breaks with these of the following- Regular breaks of 1.5 minutes increases our workers productivity, Employees become efficient when they surf media regularly, Just one such break improves mental acuity of our employees, Microbreaks are between 30 seconds to 5 minutes.
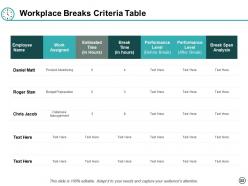
Slide 22: This slide showcases Workplace Breaks Criteria Table.
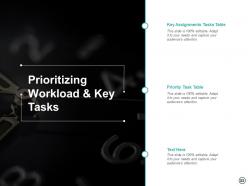
Slide 23: This slide presents Prioritizing Workload & Key Tasks with these of the following two factors- Key Assignments Tasks Table, Priority Task Table.
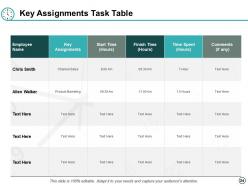
Slide 24: This slide presents Key Assignments Task Table.
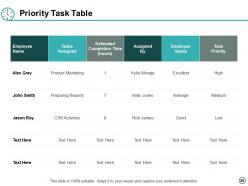
Slide 25: This slide shows Priority Task Table.
Slide 26: This slide presents Employee Timesheet with these of the following- Planning & Prioritizing Projects, Goals & Tasks, Planning & Prioritizing Your Own Workload.
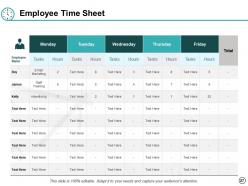
Slide 27: This slide shows Employee Time Sheet.
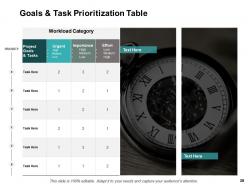
Slide 28: This slide presents Goals & Task Prioritization Table which further showcases priority.
Slide 29: This slide shows Competency Team Skills Matrix with these of the following- Project Team Skills Matrix, Team Skills Matrix Analysis, Team Skills Matrix, Employee Task Status Table, Task Based Recognition Chart, Team Based Evaluation, Employee Time Management Evaluation Chart, Task Assignment & Evaluation.
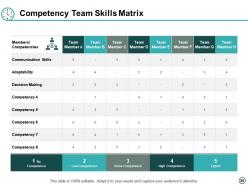
Slide 30: This slide Competency Team Skills Matrix.
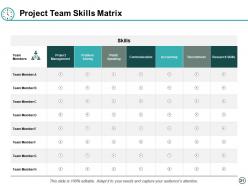
Slide 31: This slide presents Project Team Skills Matrix.
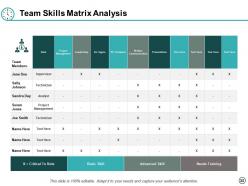
Slide 32: This slide showcases Team Skills Matrix Analysis.
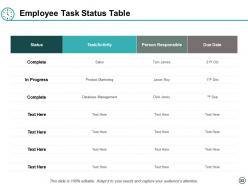
Slide 33: This slide presents Employee Task Status Table.
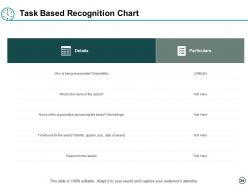
Slide 34: This slide shows Task Based Recognition Chart.
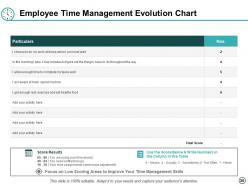
Slide 35: This slide showcases Employee Time Management Evolution Chart
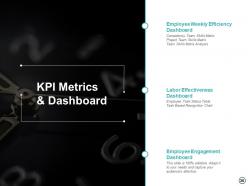
Slide 36: This slide presents KPI Metrics & Dashboard which further showcases- Competency Team Skills Matrix, Project Team Skills Matrix, Team Skills Matrix Analysis, Employee Weekly Efficiency Dashboard, Employee Task Status Table, Task Based Recognition Chart, Labor Effectiveness Dashboard, Employee Engagement Dashboard.
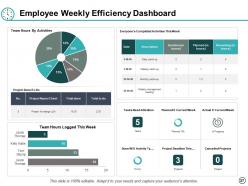
Slide 37: This slide presents Employee Weekly Efficiency Dashboard which has these of the following- Project Done/To Do, Everyone’s Completed Activities This Week, Planned 75h, Planned H Current Week, In Progress, Actual H Current Week, Tasks Need Attention, Tasks.
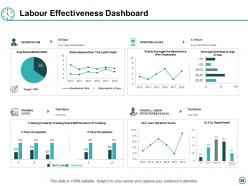
Slide 38: This Labour Effectiveness Dashboard with these of following satges we have taken.
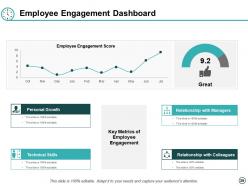
Slide 39: This slide presents Employee Engagement Dashboard which further showcases- Key Metrics of Employee Engagement, Personal Growth, Technical Skills, Relationship with Managers, Relationship with Colleagues.
Slide 40: This slide presents Employee Efficiency Status KPI with these of the four stages- Employee Efficiency, Inbox Status, Process Efficiency, Efficiency Index.
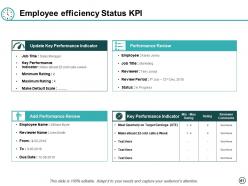
Slide 41: This slide showcases Employee efficiency Status KPI with these of the following- Meet Quarterly on Target Earnings (OTE), Key Performance Indicator.
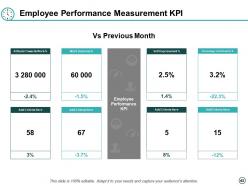
Slide 42: This slide presents Employee Performance Measurement KPI
Slide 43: This slide showcases Time Control Icons Slide.
Slide 44: This slide is titled Additional Slides to move forward.
Slide 45: This is a Vision, Mission and Goals slide. State them here.
Slide 46: This is an Our Team slide with name, image &text boxes to put the required information.
Slide 47: This is an About Us slide showing Our Company, Value Client, and Premium services as examples.
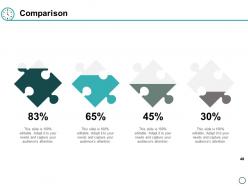
Slide 48: This slide shows Comparison of Positive Factors v/s Negative Factors with thumbs up and thumb down imagery.
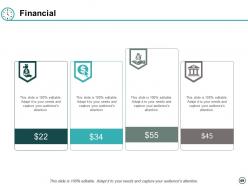
Slide 49: This is a Financial Score slide to show financial aspects here.
Slide 50: This is a Quotes slide to convey message, beliefs etc.
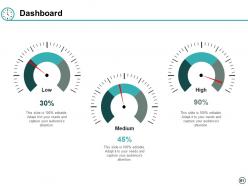
Slide 51: This is a Dashboard slide to show- Strategic System, Success, Goal Process, Sales Review, Communication Study.
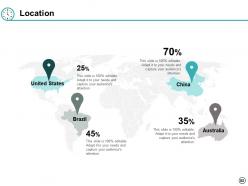
Slide 52: This is a Location slide to show global growth, presence etc. on world map.
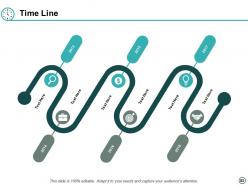
Slide 53: This is a Timelines slide to show- Plan, Budget, Schedule, Review.
Slide 54: This slide shows an image with text boxes titled Business Person with Post It notes.
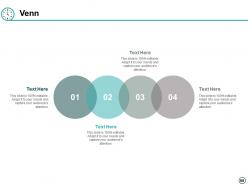
Slide 55: This is a Venn diagram image slide to show information, specifications etc.
Slide 56: This is a Bulb Or Idea image slide to show information, innovative aspects etc.
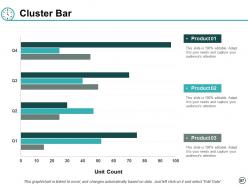
Slide 57: This slide presents Cluster Bar.
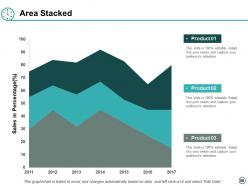
Slide 58: This is an Area Chart slide for product/entity comparison.
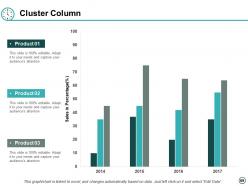
Slide 59: This slide presents Cluster Column.
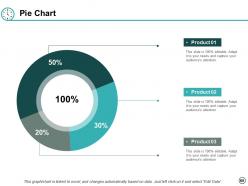
Slide 60: This slide showso Pie Chart.
Slide 61: This is a Thank You slide with Address# street number, city, state, Contact Numbers, Email Address.
Time Control Powerpoint Presentation Slides with all 61 slides:
Use our Time Control Powerpoint Presentation Slides to effectively help you save your valuable time. They are readymade to fit into any presentation structure.
-
Innovative and Colorful designs.


