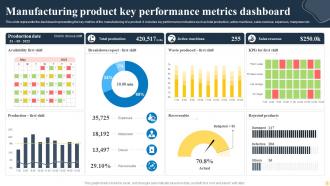
Manufacturing Metrics Powerpoint Ppt Template Bundles
Try Before you Buy Download Free Sample Product
Audience
Editable
of Time
Our Manufacturing Metrics Powerpoint Ppt Template Bundles are topically designed to provide an attractive backdrop to any subject. Use them to look like a presentation pro.
People who downloaded this PowerPoint presentation also viewed the following :
Manufacturing Metrics Powerpoint Ppt Template Bundles with all 17 slides:
Use our Manufacturing Metrics Powerpoint Ppt Template Bundles to effectively help you save your valuable time. They are readymade to fit into any presentation structure.
FAQs for Manufacturing Metrics Powerpoint
Focus on the big four first: OEE, quality metrics, safety incidents, and cost per unit. OEE's honestly a game-changer - it combines availability, performance, and quality into one meaningful number. Track your cycle times and inventory turns too. On-time delivery rates are huge for keeping customers happy. Oh, and don't forget employee productivity and energy consumption if sustainability's on your radar. Start with clean data on these core metrics before you get fancy with specialized KPIs. Once you nail the basics, then expand based on whatever your plant's actually struggling with.
Honestly, lean manufacturing is like decluttering your whole operation - you cut out all the BS that wastes time and money. Your cycle times get way faster, defect rates drop, and you're not burning through resources anymore. The continuous improvement stuff actually does work if you stick with it, though it takes patience. Map out what you're doing now first - seriously, this step matters. Find your biggest time wasters and attack those. Your OEE scores will probably jump pretty quick since you're only focusing on what actually adds value. We saw huge improvements within like 3 months when we finally committed to it.
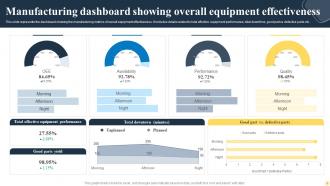
So OEE measures how well your equipment actually performs compared to what it could theoretically do. You multiply three things: availability (is it running?), performance (running at full speed?), and quality (making good parts?). Most places get humbled real quick when they first calculate it - kinda funny how everyone thinks they're crushing it until the numbers say otherwise. World-class is 85%+, but honestly don't stress if you're way below that starting out. Just find your biggest problem area and tackle that first. The whole point is spotting where you're bleeding efficiency.
So these two metrics are basically opposites - high first-pass yield means you're nailing it the first time, which keeps everything running smooth. Rework though? That's where things get messy. Every part you have to fix again just kills your capacity and drives costs up like crazy. Here's the thing - sometimes the real damage doesn't show up until you look at total throughput time, which honestly caught me off guard when I first started tracking this stuff. But yeah, even bumping first-pass yield by 5% can cut your rework way down. Definitely watch both on your dashboard together.
Think of KPIs as your translator between what's actually happening in manufacturing and what the executives care about. Don't track everything - that's a rabbit hole you don't want to go down. Pick metrics that tie directly to business goals like profit or customer happiness. Say your CEO wants faster delivery times - focus on cycle time and on-time delivery, not just random efficiency stuff. Honestly, I've seen too many people drown in data because they tried measuring everything. Start with what would matter to your CEO's dashboard, then figure out which manufacturing numbers feed into that.
So predictive analytics takes all your old manufacturing data and uses it to guess what'll happen next - way better than just eyeballing past trends. You can actually catch equipment failures and quality problems before they tank your production line. The algorithms find patterns you'd totally miss otherwise. Honestly, it's pretty wild how accurate these things get. Just dump your sensor data and maintenance logs into a basic model to start. Even simple setups improve forecast accuracy by like 20-30%. Way better than constantly putting out fires after stuff breaks.
Start with automated sensors - way better than relying on people to remember stuff (trust me, they won't). Real-time data beats everything. Focus on metrics that actually matter to your business, not just whatever's easiest to track. Been there with the useless KPI overload - what a nightmare that was! Clean your data right at the source or you'll hate yourself later. Don't get stuck looking at single numbers though. Trends over time tell the real story. Oh, and actually share what you find with your floor teams so they can do something about it.
Dude, real-time data is a game changer - you'll catch problems before they blow up your budget. Instead of waiting for those useless end-of-shift reports, you can actually fix stuff as it happens. Track your machine performance and quality metrics live, so when things start going sideways, boom - you're on it. I've watched way too many production lines pump out garbage for hours because nobody realized until the next morning. Total nightmare. Set up dashboards that your operators actually care about, then give them power to do something about it. Oh, and start with whatever's causing you the biggest headaches right now.
Honestly, the worst thing you can do is track everything under the sun - you'll just get buried in numbers. Most places obsess over stuff like defect rates but ignore the early warning signs that could've prevented issues. Pick maybe 5-7 metrics tops and actually use them to make changes. I've seen so many teams collect data religiously then never look at it again, which is maddening. Don't set crazy unrealistic goals either - that just kills morale. Also watch out for comparing different production lines without context. Make sure whatever you're tracking actually matters to your business goals and review it with your team regularly.
Look, your quality metrics basically predict how happy customers will be. Low defects and solid reliability? People trust you and tell their friends. Makes sense, right? But here's the thing - bad metrics turn into angry customers writing those nasty reviews that never go away. I've seen companies tank because they ignored early warning signs. The smart move is catching problems before customers do. Track the right stuff upfront and you won't be dealing with returns and complaints later. Way easier than damage control after the fact.
Your supply chain metrics basically control whether manufacturing runs smooth or becomes a total nightmare. Track stuff like supplier delivery times and inventory turnover - it'll help you catch problems before they wreck your production schedule. Honestly, I've watched entire plants transform just by getting better visibility into their supply chain data. The trick is linking those upstream numbers to what's happening on your factory floor. Lead times matter way more than most people think. When you can spot bottlenecks early, you're able to adjust before everything goes sideways.
Honestly, benchmarking is like finally seeing your report card compared to everyone else's. You'll figure out what you're actually good at versus where you're totally falling behind - stuff like OEE, quality rates, cycle times against industry standards. Instead of randomly guessing what "improvement" means, you get real targets to hit. The cool part? Finding companies doing 20-30% better than you at specific things. I'd start with trade association reports or just reach out to other manufacturers. Most people are surprisingly willing to swap numbers if you ask nicely. Way better than flying blind.
Dude, go with Power BI or Tableau first - they're solid for real-time feeds and make reports that don't look like garbage. Grafana's worth checking out too if you need something more specialized for manufacturing. Honestly though, I've watched teams waste months overengineering this stuff. Just pick whatever plays nice with your current setup, whether that's ERP or your historian databases. Oh and make sure the charts aren't microscopic - your operators shouldn't need a magnifying glass to read KPIs. Start basic, you can always get fancier later.
Productivity in manufacturing basically tells you everything about how your operation's running. Track stuff like units per hour or revenue per employee - you'll catch problems before they wreck your margins. Low numbers? Usually means your team needs training, equipment's acting up, or your workflow sucks. Honestly, I'd rather compare against your own past performance than worry about industry benchmarks all the time. Pick maybe 2-3 simple metrics and check them weekly. That's when you'll actually see patterns emerging.
Honestly, the biggest pain is gonna be systems that don't play nice together. Chicago measures downtime one way, Texas does it completely different - and neither wants to budge. Been there! Legacy equipment makes it worse since you're stuck with whatever data collection they've got. Different regulations per site don't help either. Start with just 2-3 metrics that actually matter. Get the site managers on board first or you're dead in the water. A good centralized platform helps normalize all the chaos, but that's probably your biggest upfront cost.
-
Attractive design and informative presentation.
-
Awesome presentation, really professional and easy to edit.