

Market performance evaluation powerpoint presentation slides





Try Before you Buy Download Free Sample Product
 Impress Your
Audience
 100%
Editable
 Save Hours
of Time


Assess your marketing activities with the help of Market Performance Evaluation PowerPoint Presentation Slides. Impress the senior management by offering insights via market performance appraisal PPT, and highlight areas that seek refinement. The parameters mentioned in this marketing analysis PPT slideshow effectively helps in presenting the consumer market, business market, and international market segmentations. It is important to measure performance after every marketing cycle, and our performance assessment PPT offers a strong framework. Graphical representation of financial highlights through this marketing review PowerPoint theme will help the audience easily grasp complex data. Showcase competitor analysis by compiling information according to the metrics stated in our market strategy analysis PPT slide deck. Align your marketing strategy with the customer and stakeholder needs using operational review PowerPoint presentation. Elucidate customer segmentation through diagrams included in our marketing campaign assessment PPT slideshow.
People who downloaded this PowerPoint presentation also viewed the following :
Content of this Powerpoint Presentation
Slide 1: This slide introduces Market Performance Evaluation. State your Company name and begin.
Slide 2: This slide displays the Content of the presentation.
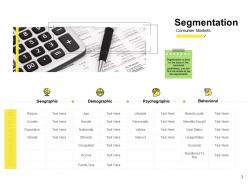
Slide 3: This slide describes Segmentation containing- Consumer Markets, Geographic, Demographic, Psychographic, Behavioral.
Slide 4: This slide depicts Business Markets.
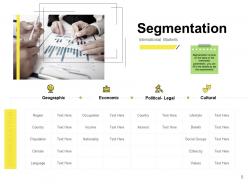
Slide 5: This slide describes Segmentation containing- International Markets, Geographic, Economic, Political- Legal, Cultural. Segmentation is done on the basis of the mentioned parameters, you can fill in the details as per the requirements
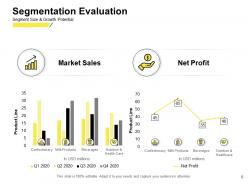
Slide 6: This slide showcases Segmentation Evaluation Segment Size & Growth Potential Market Sales Net Profit
Slide 7: This slide describes Segmentation Evaluation.
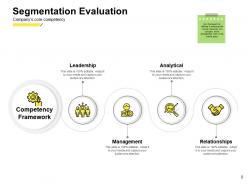
Slide 8: This slide showcases Company’s core competency.
Slide 9: This slide is about Analysing and understand the customer needs & requirements
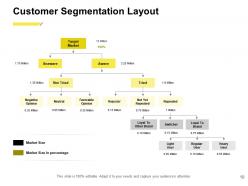
Slide 10: This slide depicts Customer Segmentation Layout.
Slide 11: This slide showcases Segmentation Map.
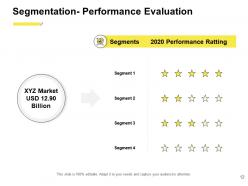
Slide 12: This slide showcases Segmentation- Performance Evaluation.
Slide 13: This is Market Performance Evaluation Icons Slide.
Slide 14: This slide is titled as Additional Slides for moving forward.
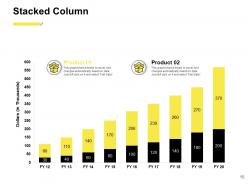
Slide 15: This slide displays Stacked Column chart for different product comparison.
Slide 16: This slide depicts Bar Chart with product comparison.
Slide 17: This is Our Mission slide with Vision, Mission and Goal.
Slide 18: This is Our Team slide with names and designations.
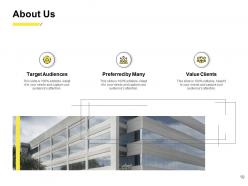
Slide 19: This is About Us slide to showcase Company specifications.
Slide 20: This is Our Goal slide. State your goals here.
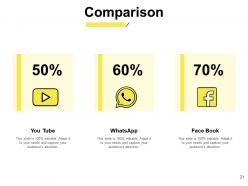
Slide 21: This is Comparison slide showcasing comparison between You Tube, WhatsApp and Facebook.
Slide 22: This is Financial slide. Showcase finance related stuff here.
Slide 23: This is Thank You slide with Address, Email address and Contact number.
Market performance evaluation powerpoint presentation slides with all 23 slides:
Use our Market Performance Evaluation Powerpoint Presentation Slides to effectively help you save your valuable time. They are readymade to fit into any presentation structure.












FAQs for Market performance evaluation
Revenue growth and CAC are your bread and butter - start there since they hit your wallet directly. Customer lifetime value matters too, plus ROI and conversion rates. I'm obsessed with checking conversion rates way too often lol. Market share and brand awareness are solid if you're doing big picture stuff. But seriously, don't go crazy tracking every single metric out there. Pick maybe 3-4 that actually align with what you're trying to accomplish. Otherwise you'll just drown in data and not get anywhere meaningful with it.
Look, the numbers never tell the whole story. Your market data might look terrible compared to benchmarks, but maybe you're actually stealing customers from your biggest competitor - that's way more valuable than hitting some arbitrary metric. Brand reputation shifts, new regulations, customer mood changes... all that stuff explains why your performance seems off. I learned this the hard way at my last company tbh. Short-term numbers can be misleading. Sometimes you're building something bigger that won't show up in quarterly reports. Management quality matters too. Always ask yourself what's really driving those results before panicking.
Honestly, competitor analysis is like your sanity check for whether you're actually doing well or just think you are. Your 15% growth sounds amazing until you realize your competitors hit 20%, right? I usually tell people to pick 3-5 direct competitors and track their main metrics monthly - sounds boring but it's super helpful. You'll start seeing patterns in what the whole industry is doing versus what's just you. Plus it helps you figure out if you're missing something obvious they're all doing. Way better than just staring at your own numbers in a vacuum.
When people change how they shop, it hits your conversion rates and customer costs hard. Like if everyone suddenly cares more about being eco-friendly than saving money - boom, your sales speed tanks and market share drops. Honestly, this stuff keeps me up at night sometimes because it's so unpredictable! Your inventory starts moving differently, marketing channels that worked great before suddenly suck, and you lose pricing power. I always tell people to watch search trends and what's buzzing on social. Catch those shifts early so you can tweak your benchmarks before everything goes sideways.
So market share is basically your slice of the pie compared to competitors. You might see great revenue numbers, but if everyone else grew faster and you lost share, that's actually pretty concerning. Growth could just mean you're riding the wave instead of being strategic about it. What's interesting is market share trends usually predict future profits better than current financials do - learned that the hard way once. Keep tracking it alongside revenue. If one goes up while the other drops, something's definitely off and worth investigating.
So grab your performance data first, then break it down using SWOT. Internal stuff - what's your team actually good at? Where are you dropping the ball? Most people totally skip this part and just blame the market, which is annoying but whatever. Then look at what's happening externally - new trends, competitors being weird, that kind of thing. The whole point is connecting those dots to figure out what you should actually do next. Like if you're crushing social media and see a gap in video content, that's your move right there.
Don't put all your eggs in one basket - grab data from multiple sources like Bloomberg or Reuters. They all have weird quirks that'll bite you eventually. Cross-reference everything because pricing discrepancies are way more common than people realize (trust me on this one). Real-time feeds matter when you're trading, but historical stuff works fine for spotting trends. Here's something most people skip: document where your data came from and when you grabbed it. Sounds boring but you'll thank yourself later when something breaks. Oh, and always double-check those crazy outliers before panicking.
Dude, segmentation totally flips performance tracking on its head. You can't just look at overall numbers anymore - what crushes it with millennials might completely flop with Gen X. Each segment needs its own KPIs and conversion tracking. Your B2B folks probably care about ROI while consumers are all about brand buzz. Set up your dashboard to filter by segment so you can actually see what's happening where. Honestly, it's kind of a pain to set up initially but makes such a difference. Then you'll know which strategies work for who.
So many good options for market tracking! TradingView is probably your best bet to start - their free version is actually pretty decent and I'm honestly addicted to their charts. Bloomberg Terminal is obviously the holy grail but unless you've got serious cash, skip it. Yahoo Finance and Google Finance work fine for basic stuff. If you need heavy-duty analytics later, check out Refinitiv Eikon or FactSet. Most of these play nice with Excel too which is clutch for reports. I'd mess around with TradingView first and see what you actually need before going crazy with paid subscriptions.
Start with the basics - revenue growth, market share, customer acquisition costs. IBISWorld has decent industry reports, or check your trade associations. Bloomberg's great if you have access, but honestly industry surveys work too and they're free. The annoying part? Making sure you're actually comparing similar companies - same geography, market segment, all that. Grab public data on 2-3 direct competitors if possible. Here's what really matters though - don't just do this once. Set up quarterly check-ins to track everything consistently. Otherwise you're just getting a snapshot that doesn't mean much.
Dude, you've gotta look at economic indicators before you judge your market performance. GDP growth, inflation, unemployment - all that stuff directly affects how consumers spend. Last month I thought our numbers were trash, but then I realized unemployment had just spiked in our area. Makes total sense, right? If the economy's booming, your "amazing" results might just be riding the wave. When things are rough, decent performance could actually mean you're crushing it. Always compare your metrics to what's happening economically or you'll have no clue if you're actually good at this.
Look, seasonal stuff will mess with your head if you don't watch out. Q4 might look incredible but that's just holiday shopping doing its thing. Compare the same periods year-over-year instead of quarter to quarter - way more honest that way. I learned this the hard way when I got all excited about numbers that were basically just Christmas magic. Set up your benchmarks to expect those seasonal swings. Otherwise you'll spend months thinking you're crushing it or failing when really it's just normal patterns playing out.
So look at your performance data and see what needs fixing. Maybe your pricing is off, or you're throwing money at the wrong marketing channels. If some segments totally suck, figure out if it's your targeting or if those markets just aren't worth it right now - honestly, sometimes you gotta cut your losses. Flip side, double down on what's actually working. You might catch competitors slipping in areas where you could jump in. The whole point is doing something with this info instead of letting another report collect dust on your desktop.
Honestly, social media metrics are way better than waiting around for survey results or sales reports. You get instant feedback on whether your positioning actually makes sense to people. Set up alerts for brand mentions first - you'll be shocked what people are saying. Track sentiment and what competitors are doing, but don't get obsessed with likes and shares (total vanity trap). The conversation themes matter way more than engagement numbers anyway. Pull this stuff into your monthly reviews with your other metrics. Sentiment shifts will show you problems before they tank your revenue.
Dude, the worst thing you can do is cherry-pick numbers that make you look good. Don't compare your Q4 to their Q1 - that's totally meaningless. I see so many teams obsessing over revenue while their customer acquisition costs are going crazy. Track your leading indicators too, not just the lagging stuff. Oh and context matters big time - what's happening in your market right now? Seasonal trends are real whether you want to admit it or not. Build a dashboard that shows everything, including the ugly parts. Short-term metrics can be misleading as hell.
-
Appreciate the research and its presentable format.
-
Great experience, I would definitely use your services further.
-
Out of the box and creative design.