


Marketing kpi dashboard showing investments revenue metrics details





Try Before you Buy Download Free Sample Product
 Impress Your
 Audience
 100%
100% Editable
 Save Hours
 of Time


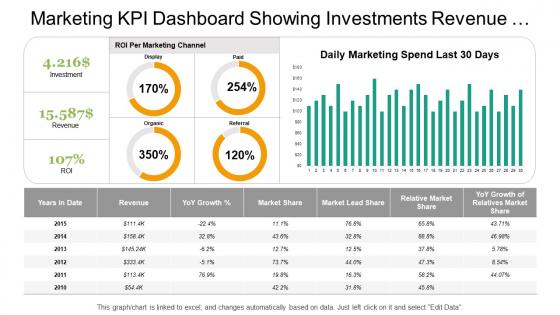
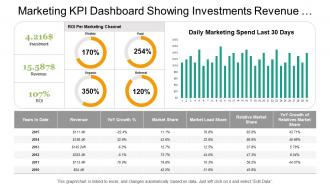
Track your business revenue and gained the return on investment using this marketing KPI dashboard showing investments revenue metrics details PPT PowerPoint template slide. This marketing KPI dashboard is crafted using impressive pie charts, bar graphics, and a table. Four pie charts represent ROI per marketing channels, bar graph represents daily marketing spend last 30 days, and a table represents years in date, revenue, growth percentage, market share, market lead share, relative market share, and growth of relative market share. To make this marketing KPI dashboard presentation template slide highly impactful, our graphic designers have used an impressive graph and chart. Our graphic designers aim to craft slide designs that are self-descriptive. If you are planning to create a presentation on topics such as marketing report, business growth, business revenue tracking, revenue management, financial analysis, financial management, budget management, consumer behavior, marketing performance measurement, return on marketing investment, and revenue growth. Grab the attention of viewers with this editable marketing KPI dashboard in your presentation. Download this marketing KPI dashboard showing investments revenue metrics details presentation template slide. Handle the aftermath with our Marketing Kpi Dashboard Showing Investments Revenue Metrics Details. Control the fallout of adverse conditions.
People who downloaded this PowerPoint presentation also viewed the following :
Marketing kpi dashboard showing investments revenue metrics details with all 6 slides:
Ensure that the excitement endures with our Marketing Kpi Dashboard Showing Investments Revenue Metrics Details. Escape from boredom's clutches.

FAQs for Marketing kpi dashboard showing investments
Essential marketing KPIs include conversion rates, customer acquisition cost, return on ad spend, lead generation metrics, and customer lifetime value. These indicators enable marketing teams to track campaign effectiveness, optimize budget allocation, and demonstrate ROI across channels, with many organizations finding that comprehensive dashboard visibility ultimately drives better strategic decisions and improved marketing performance.
Effective marketing data visualization combines clear chart selection, consistent color coding, and intuitive dashboard layouts that highlight key performance indicators like conversion rates, customer acquisition costs, and campaign ROI. Strategic use of interactive filters, trend comparisons, and real-time data feeds enables stakeholders to quickly identify patterns and opportunities, ultimately delivering enhanced decision-making speed and improved marketing accountability across teams.
KPI dashboards enable real-time marketing performance tracking by providing instant visibility into campaign metrics, conversion rates, ROI analysis, and audience engagement patterns. Through automated data visualization, marketing teams streamline decision-making, optimize campaigns mid-flight, and allocate resources more effectively, with many organizations finding that real-time insights deliver faster campaign adjustments and improved marketing outcomes.
Different marketing channels require distinct KPIs based on their unique metrics and objectives, with email marketing focusing on open rates and click-through rates, social media emphasizing engagement and reach, while paid advertising prioritizes cost-per-acquisition and return on ad spend. This strategic selection enables marketing teams to optimize channel-specific performance, allocate resources more effectively, and ultimately deliver comprehensive campaign insights that drive better ROI across their entire marketing portfolio.
Top marketing KPI dashboard tools include Tableau, Power BI, Google Data Studio, HubSpot, and Salesforce Analytics, each offering robust visualization and integration capabilities. These platforms streamline performance tracking by providing real-time data syncing, customizable reporting templates, and automated alert systems, with many marketing teams finding that drag-and-drop interfaces and multi-channel integration ultimately deliver faster insights and enhanced campaign optimization across organizations.
Marketing KPIs should be reviewed daily for real-time metrics like website traffic and social media engagement, weekly for campaign performance and lead generation, and monthly for strategic metrics like customer acquisition cost and lifetime value. This tiered approach enables marketing teams to respond quickly to trends while maintaining focus on long-term objectives, ultimately delivering more agile campaigns and improved ROI.
Customer engagement serves as a foundational metric for defining marketing KPIs because it directly correlates with brand loyalty, conversion rates, and long-term customer value across multiple touchpoints. Through engagement analytics, organizations can establish meaningful KPIs like social media interactions, email open rates, and website dwell time, ultimately delivering measurable insights that drive strategic marketing decisions and competitive advantage.
Social media metrics integrate into marketing KPI dashboards through API connections, third-party tools like Hootsuite or Sprout Social, and native platform analytics exports that consolidate engagement, reach, and conversion data. This integration enables marketers to track cross-platform performance, measure ROI from social campaigns, and optimize content strategies, ultimately delivering comprehensive visibility into how social efforts contribute to overall marketing objectives.
Common pitfalls include overwhelming users with too many metrics, focusing on vanity metrics rather than actionable KPIs, poor data visualization choices, and lack of stakeholder alignment on key objectives. These issues create confusion rather than clarity, with many marketing teams finding that cluttered dashboards actually hinder decision-making and strategic planning, ultimately reducing campaign effectiveness and ROI measurement accuracy.
A/B testing results can be effectively represented through conversion rate comparisons, statistical significance indicators, sample size metrics, confidence intervals, and performance trend charts. These visualizations enable marketing teams to quickly identify winning variants, assess test reliability, and make data-driven decisions, with many organizations finding that clear dashboard representation accelerates campaign optimization and improves overall marketing ROI.
Effective alignment strategies include establishing SMART objectives, conducting regular stakeholder meetings, implementing cross-functional reviews, creating cascading goal frameworks, and utilizing integrated analytics platforms. These approaches streamline communication between teams, enhance transparency across departments, and ensure consistent measurement standards, with many organizations finding that structured quarterly alignment sessions ultimately deliver improved campaign performance and clearer ROI visibility.
Brand awareness can be measured through metrics like brand recall surveys, search volume data, social media mentions, direct traffic analytics, and share of voice analysis. These measurements enhance overall marketing effectiveness by revealing campaign reach, customer acquisition patterns, and competitive positioning, with many organizations finding that stronger brand awareness correlates directly with improved conversion rates and reduced customer acquisition costs.
Marketing KPI dashboards generate executive summaries for leadership, campaign performance reports for marketing teams, ROI analyses for finance departments, lead generation reports for sales teams, and customer acquisition reports for stakeholders. These tailored reports enable organizations to streamline decision-making across departments, enhance strategic alignment, and deliver targeted insights that drive marketing optimization and competitive advantage.
Conversion rates significantly influence KPI selection by determining which metrics best track customer journey progression, from initial engagement through final purchase completion. Marketing teams prioritize conversion-focused KPIs like lead-to-customer ratios, funnel drop-off points, and cost-per-acquisition, while incorporating supporting metrics such as click-through rates and engagement scores, ultimately creating dashboards that deliver actionable insights for optimizing campaign performance and maximizing ROI.
Innovative data storytelling approaches include interactive narrative flows, predictive scenario modeling, customer journey visualizations, comparative benchmarking displays, and real-time performance animations. These techniques transform static metrics into compelling business narratives by contextualizing campaign performance, highlighting conversion pathways, and demonstrating ROI impact, with marketing teams finding that storytelling elements significantly enhance stakeholder engagement and strategic decision-making.
-
It saves your time and decrease your efforts in half.
-
Very unique and reliable designs.