


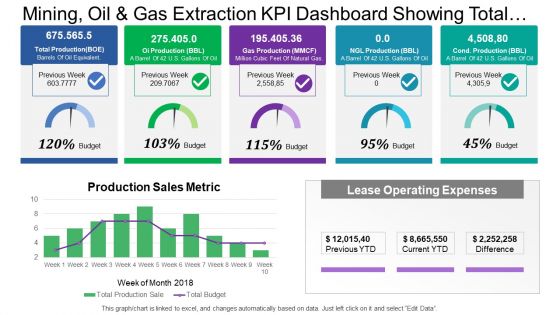
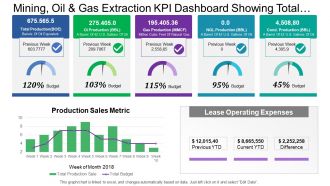
Mining oil and gas extraction kpi dashboard showing total production and budget





Try Before you Buy Download Free Sample Product
 Impress Your
 Audience
 100%
100% Editable
 Save Hours
 of Time


Influence their feelings with our Mining Oil And Gas Extraction Kpi Dashboard Showing Total Production And Budget. Get folks to consider alternate approaches.
People who downloaded this PowerPoint presentation also viewed the following :
Mining oil and gas extraction kpi dashboard showing total production and budget with all 6 slides:
Cater to any handicap with our Mining Oil And Gas Extraction Kpi Dashboard Showing Total Production And Budget. They compensate for any disability.

FAQs for Mining oil and gas extraction kpi dashboard showing total
So honestly, start with the basics - production rates (barrels per day), well uptime, and production costs per barrel. Safety incidents and environmental compliance are huge too. Equipment stuff like pump performance matters, but don't get buried in metrics right away. Reserve replacement ratios and drilling completion times should definitely be on there. Financial wise - finding and development costs plus netback per barrel. Pipeline throughput is another good one, though I feel like people sometimes overthink this whole dashboard thing. Just nail down these core KPIs first, then you can always layer on more specialized ones later based on what's actually driving your operations.
Dude, this stuff is a game changer. Instead of finding out about problems from yesterday's reports, you'll catch them as they're happening. Equipment acting weird? You'll know before it breaks and costs you big money. Market shifts? React immediately instead of being three steps behind. Honestly, the visual part is what sold me - trying to spot patterns in endless spreadsheet rows is brutal, but charts make everything obvious. Your team can pivot in minutes instead of waiting around. Oh, and definitely set up alerts for the critical stuff so you're not glued to monitors all day.
Dude, predictive analytics is seriously a lifesaver for catching production issues early. Your dashboard can spot trends showing when equipment might fail or production rates will tank - way before it actually happens. We use historical data and machine learning to forecast all this stuff. Short pumps, drilling schedules, reservoir performance, you name it. Instead of scrambling when something breaks, you'll get alerts that let you fix things proactively. Honestly beats the hell out of reactive maintenance. Just make sure you're tracking these predictive metrics alongside your regular KPIs so you can actually do something about it.
Just stick the environmental stuff right in your regular production dashboard - emissions per barrel, water recycling rates, methane leaks. Track 'em next to your usual volume metrics. Here's what works: find targets that hit both goals at once, like better well completions that boost production while cutting flaring. Most operators overthink this honestly. Focus on ratios instead of total numbers - so like emissions per unit produced rather than overall emissions. That way your environmental wins stay connected to actual business results. Oh, and don't go crazy - start with maybe 2-3 environmental KPIs first.
Honestly, the worst part is your data scattered across like 20 systems - SCADA, production databases, maintenance stuff, geological software, whatever else. Each one has different formats and speaks its own weird language. Field data gets messy too with busted sensors and people typing things wrong. Oh, and don't get me started on time sync issues between systems - makes dashboards a nightmare. I learned this the hard way at my last job. Start by actually mapping where all your data lives first. Then pick your most important KPIs and get those standardized before you try automating everything else.
Real-time production metrics are right there next to your historical data, so spotting problems becomes way easier. Equipment downtime, declining wells, energy spikes - stuff that used to hide in spreadsheets for weeks now jumps out immediately. The visual alerts alone make it worth it, honestly. Drill down from the big picture to specific wells when something looks weird. Set automated alerts for your key thresholds too - catches issues before they get expensive. My team's been using this approach and it's pretty solid for staying ahead of problems instead of always playing catch-up.
Put your most critical stuff right at the top - production rates, downtime, safety incidents. Oil and gas people honestly just want straightforward bar charts and trend lines, not some fancy widget that takes 30 seconds to load. Group similar KPIs together and stick with consistent colors throughout. Your real-time data better actually update in real-time though, because stale numbers kill your credibility instantly. Also set up automated alerts for anything going outside normal parameters. You don't want to be staring at screens all day waiting for something to break.
So ML algorithms are actually pretty amazing at forecasting KPIs - way better than those basic linear models everyone used to rely on. They crunch through tons of data like production patterns, equipment stats, geological info, weather stuff, market changes - you name it. The cool thing? They adapt in real-time and learn from past weird events that would've thrown off traditional methods. Equipment failure prediction is where they really shine, plus optimizing production schedules. You're looking at 15-30% better accuracy typically, which saves you from nasty surprises and helps with resource planning. I'd say start with your most important KPIs first.
So upstream you'll want production rates, well uptime, drilling costs per barrel - basically stuff that shows how efficiently you're pulling oil out of the ground. Downstream's completely different though. Focus on refinery utilization, crack spreads, product yields instead. Honestly, I'd just build separate dashboards since they're measuring totally different things - one's about extraction, the other's about processing margins and what the market actually wants. Oh and don't go crazy with metrics right away. Pick maybe 4-6 key ones for each segment first, then expand from there.
Honestly, dashboards are game-changers for this stuff. Your drilling team sees how their work hits refining numbers downstream. Maintenance crews finally get why their uptime matters for production goals. It's like everyone suddenly speaks the same language, you know? Those blame-game meetings basically disappear when the data's right there. Set up alerts between departments so teams can jump in before things go sideways. The trick is tracking metrics that actually connect departments instead of just... isolated stuff. Cross-functional visibility just works better than hoping people will magically collaborate.
Power BI or Tableau are your best bets for oil & gas dashboards. Power BI's cheaper and plays nice with Microsoft tools you probably already have. Tableau's visualization game is stronger though - I'm honestly biased toward it after using both. If budget isn't tight, check out OSIsoft PI Vision or Spotfire since they're actually built for industrial data. They handle real-time production stuff way better than general tools. Oh, and definitely run a pilot first to see how well whatever you pick connects with your current data setup. Saves headaches later.
Honestly, KPI dashboards are a game-changer for regulatory stuff. You get real-time tracking of everything - emissions, safety incidents, production volumes, waste data. No more panic when inspectors randomly show up! The automated alerts will ping you when you're getting close to limits or something's going sideways. I can't stress enough how much time this saves during audits since all your historical data's right there. Oh, and set up those automated compliance reports to pull straight from the dashboard. Trust me, it beats scrambling to compile everything manually when review time comes around.
Safety stuff first - incident rates, near-misses, all that. One bad accident and you're screwed. Then hit the operational basics: labor hours per barrel, equipment uptime, how well you're using your crews. Overtime tracking matters too since burnout is real in this industry. Don't skip turnover rates either - finding good people is a nightmare out there. Training completion's worth watching. Oh, and set up alerts so you catch problems before they blow up. Nothing worse than finding out something's been broken for weeks.
Dude, market swings mess with your KPIs big time. Oil crashes? Suddenly you're obsessing over cost-per-barrel instead of growth metrics - who cares about expansion when you're losing money on each barrel, right? Then prices spike and boom, you're back to watching production efficiency like a hawk. I swear it feels like redesigning your whole dashboard every quarter (which honestly gets exhausting). The trick is setting up your reporting so you can pivot fast to whatever matters most without completely ignoring the basics that keep operations running.
Honestly, quarterly reviews work best for most ops. Get feedback from your field teams and engineers about what metrics actually matter - not just the ones that look good on pretty dashboards. Too many companies (mine included, sadly) track like 50 KPIs that nobody even glances at. Set up alerts for when things start trending weird. Don't be scared to ditch metrics that aren't useful anymore. Compare your numbers to industry benchmarks and tweak thresholds when operations change. The whole point is making your dashboard something people actually use, not another report that just sits there.
-
Attractive design and informative presentation.
-
Awesomely designed templates, Easy to understand.