Oil and gas dashboard with monthly average production by companies powerpoint template
Our Oil And Gas Dashboard With Monthly Average Production By Companies Powerpoint Template are topically designed to provide an attractive backdrop to any subject. Use them to look like a presentation pro.
You must be logged in to download this presentation.
PowerPoint presentation slides
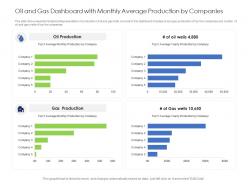
This slide Showcases the Graphical Representation of production of oil and gas Data covered in this dashboard includes oil and gas production of top five companies and number of oil and gas wells of top five companies. This is a Oil And Gas Dashboard With Monthly Average Production By Companies Powerpoint Template drafted with a diverse set of graphics, that can be reformulated and edited as per your needs and requirements. Just download it in your system and make use of it in PowerPoint or Google Slides, depending upon your presentation preferences.
People who downloaded this PowerPoint presentation also viewed the following :
Oil and gas dashboard with monthly average production by companies powerpoint template with all 2 slides:
Use our Oil And Gas Dashboard With Monthly Average Production By Companies Powerpoint Template to effectively help you save your valuable time. They are readymade to fit into any presentation structure.
-
Best way of representation of the topic.
-
Unique design & color.
-
Amazing product with appealing content and design.
-
Excellent work done on template design and graphics.
-
Use of different colors is good. It's simple and attractive.
-
Enough space for editing and adding your own content.
-
Great designs, Easily Editable.


